With the advent of hydraulic fracturing to increase production of oil and gas from tight geologic formations, such as shale, the demand for fracking sand (frac sand, or frack sand) has increased drastically in recent years. What does this process look like, you might ask. To help you understand this subsidiary of the oil and gas industry, we’ve compiled all of our frac sand photos into three albums on the topic.
Frac Sand Mining Photo Album
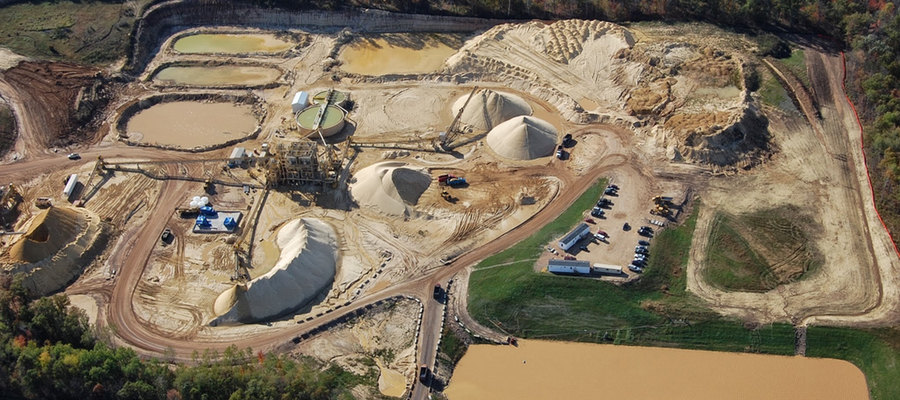
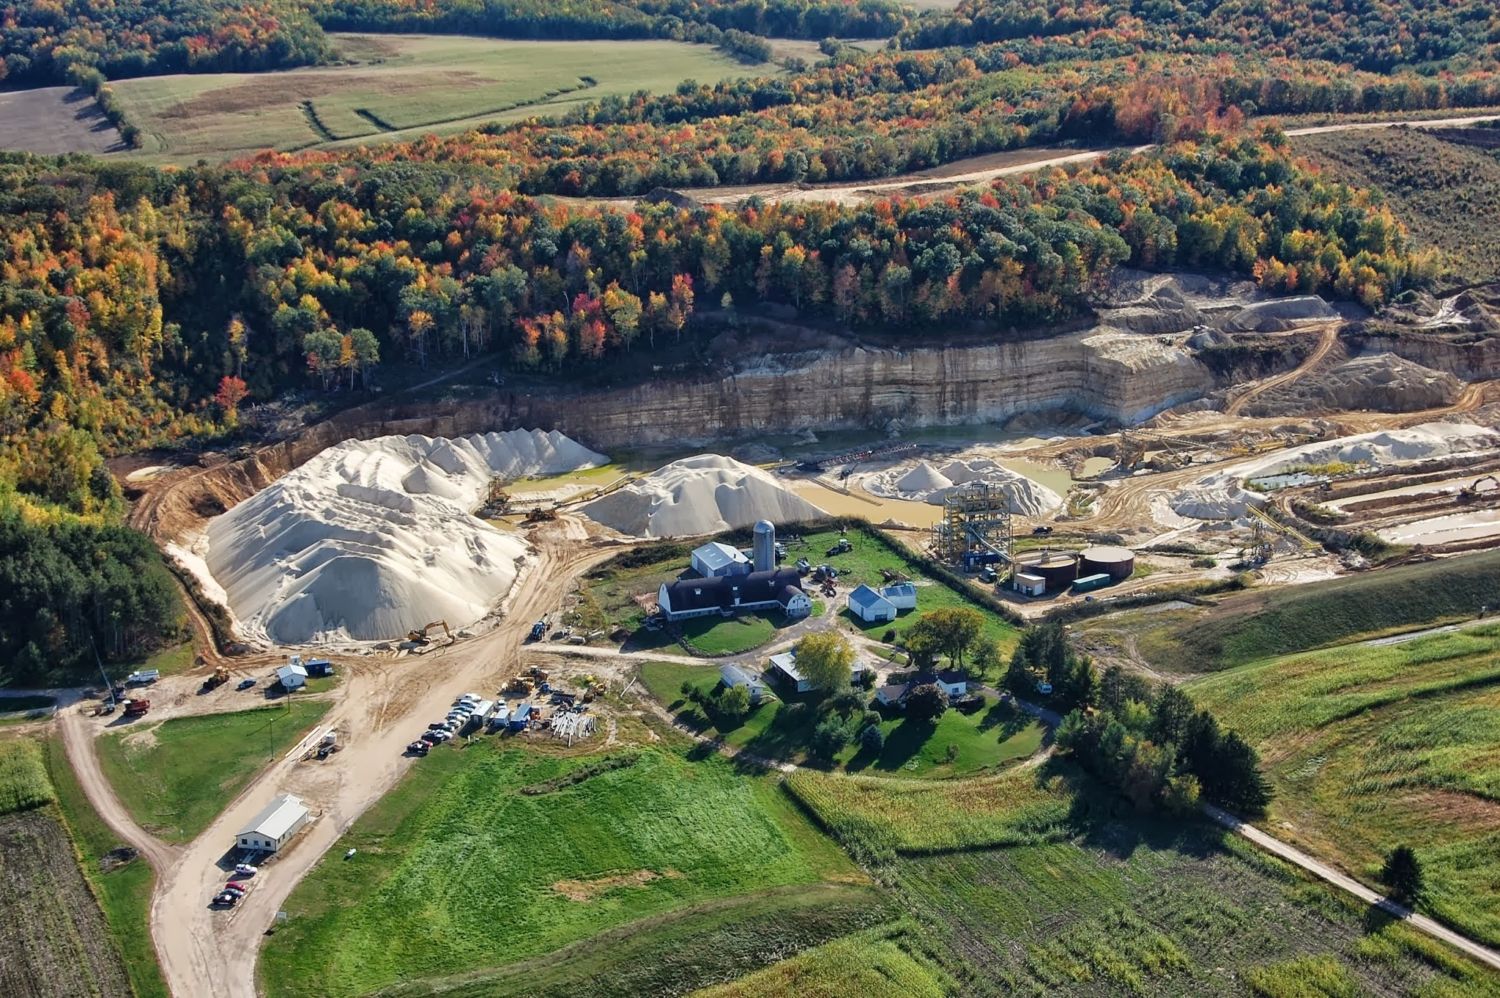
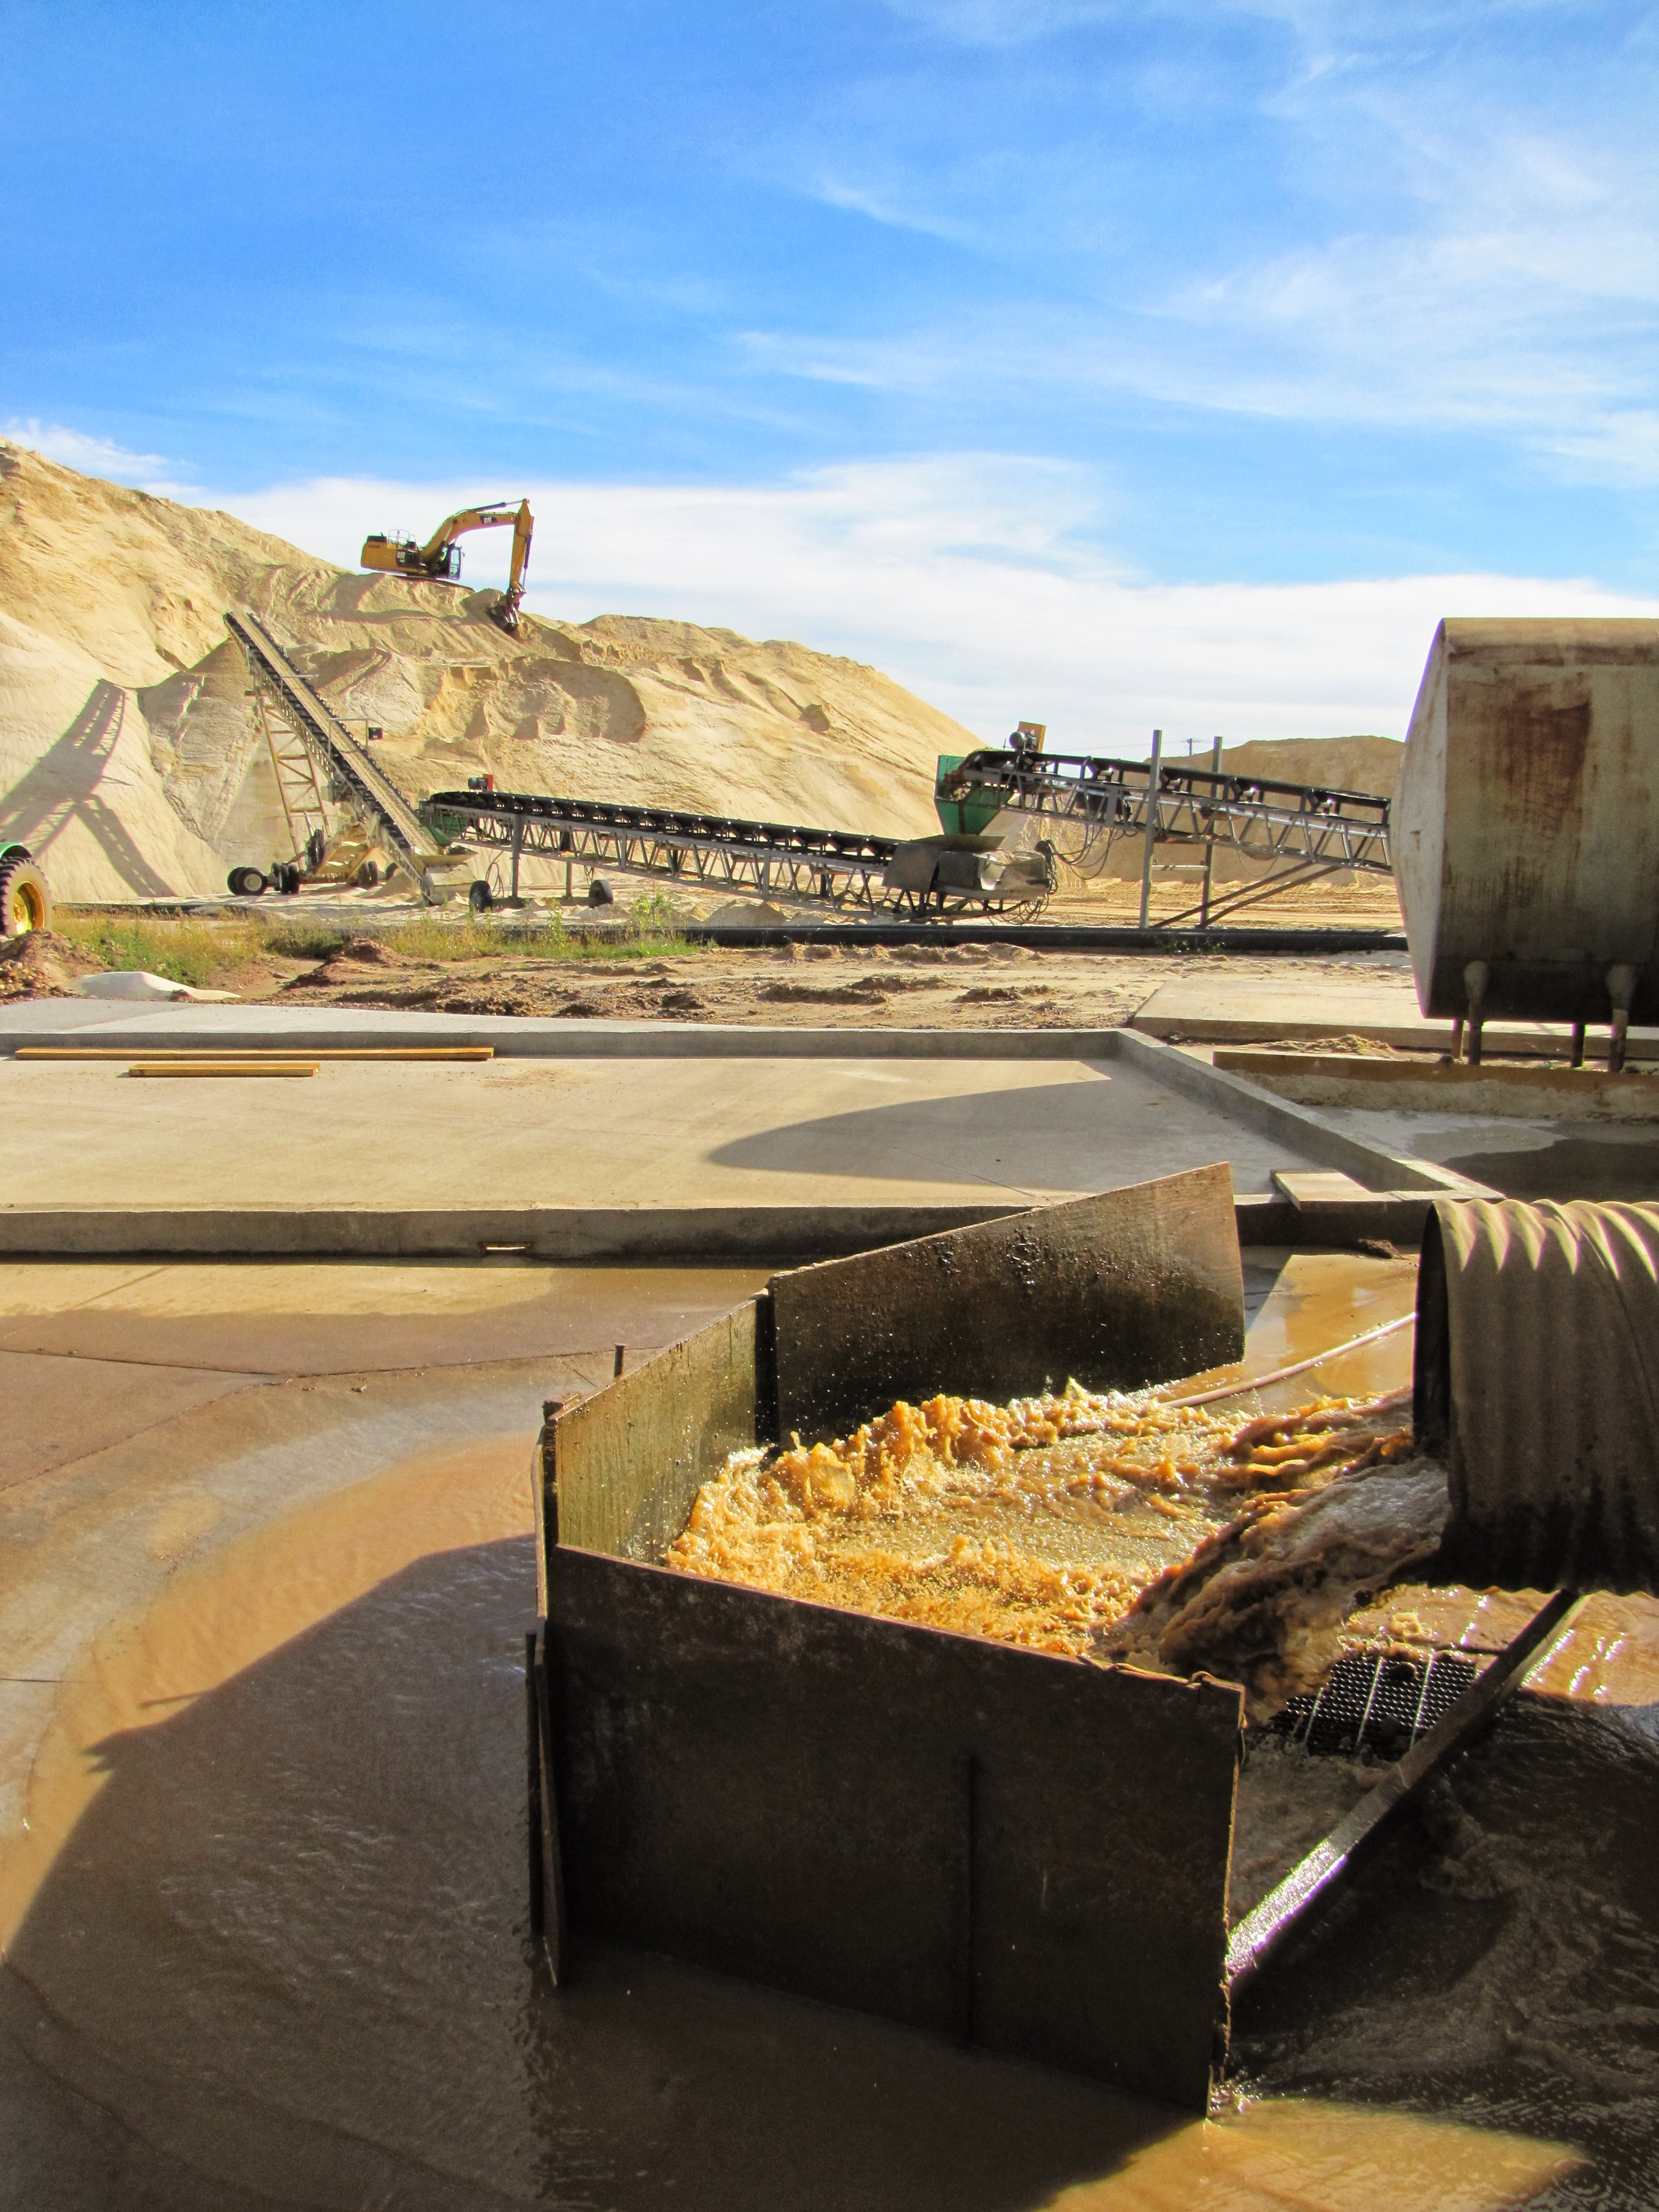
This album contains all of the photos we have amassed of frac sand mining and transportation operations – both from the ground and the sky.
All of these frac sand photos, and more, can also be found on our Energy Imagery page, organized by topic and also location.
If you have photos or videos that you would like to contribute to this growing collection of publicly available information, just email us at info@fractracker.org, along with where and when the imagery was taken, and by whom.
https://www.fractracker.org/a5ej20sjfwe/wp-content/uploads/2016/09/SandMining-Feature.jpg400900FracTracker Alliancehttps://www.fractracker.org/a5ej20sjfwe/wp-content/uploads/2021/04/2021-FracTracker-logo-horizontal.pngFracTracker Alliance2016-09-20 16:33:572021-04-15 15:04:26Frac Sand Photos Available on FracTracker.org
By Brook Lenker, Executive Director, FracTracker Alliance
Frac sand mining is a growing threat to the agricultural landscapes of the upper Midwest and a health risk to those who live near the mines. With a general slowdown in the oil and gas industry, sand mining may seem a lessening concern in the universe of extraction impacts, but a recent visit to Wisconsin during Earth Week suggested otherwise.
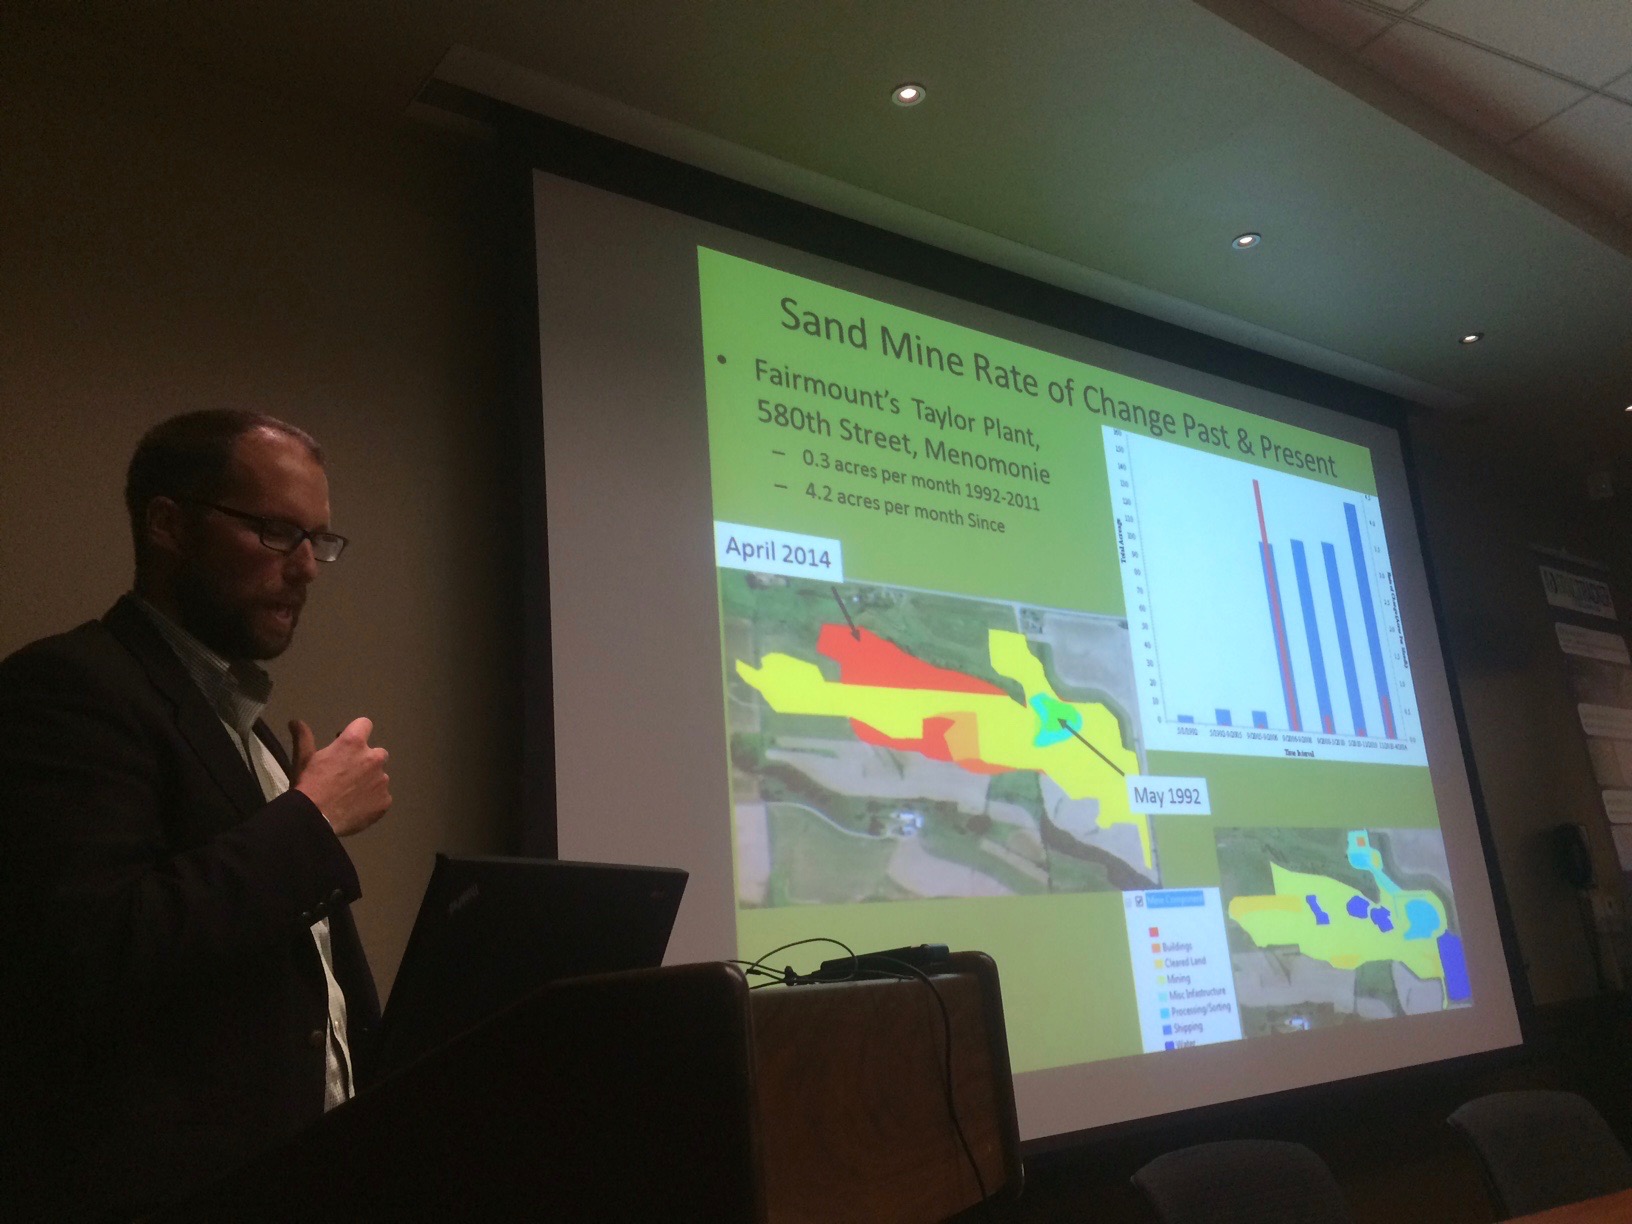
Frac Sand Mining Presentations
Dr. Auch presenting in Wisconsin on frac sand mining issues
I joined my colleague, Dr. Ted Auch, on an informative cross-state tour that started in Milwaukee. We were presenters at the Great Lakes Water Conservation Conference where representatives from breweries around the region and across the country came together to discuss their most precious commodity: clean and abundant water. Extraction affects both the quantity and quality of water – and our insights opened many eyes. Businesses like microbreweries with a focus on sustainability and a strong environmental ethic recognize the urgency and benefit of the renewable energy transformation.
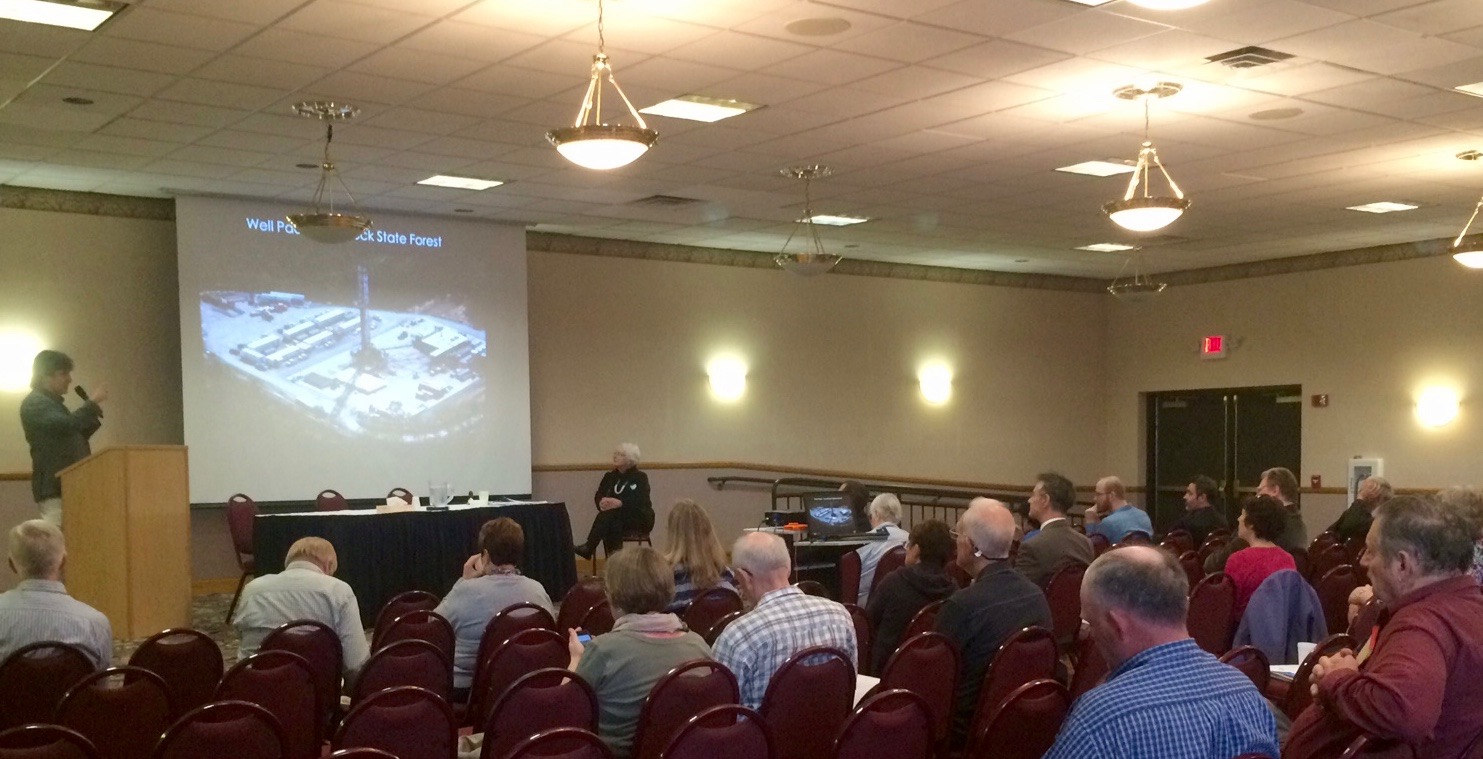
From Milwaukee, we headed west to Madison and the University of Wisconsin where Caitlin Williamson of the Wisconsin Chapter of the Society for Conservation Biology organized the first of two forums entitled “Sifting the Future: The Ecological, Agricultural, and Health Effects of Frac Sand Mining in Wisconsin.” We were joined by Kimberlee Wright of Midwest Environmental Advocates to address an engaged audience of 35 people from the campus and greater community. Thanks to Wisconsin Eye, a public affairs network, the entire program was videotaped.
Brook Lenker presenting at Sifting the Future event in Wisconsin
A long drive to Eau Claire revealed rolling farmland, wooded hills, and prodigious wetlands home to waterfowl and the largest cranberry industry in the nation. At the Plaza Hotel, we met Cheryl Miller of the Save the Hills Alliance, the grantor enabling us to study the regional footprint of sand mining, and Pat Popple, advocate extraordinaire and our host for the second “Sifting the Future” event. The good folks at Public Lab were also in town to facilitate citizen monitoring of silica dust from the mining process, including a free workshop and training that weekend.
The evening program attracted 50 people from as far away as Iowa and Minnesota. Their interest in and knowledge of sand mining issues was impressive, and many were heavily involved in fighting local mines. Dr. Crispin Pierce spoke of his research about airborne particulates around frac sand operations, complementing both FracTracker presentations – mine emphasizing the broad array of environmental and public health perils related to oil and gas extraction and Ted’s examining the scale and scope of sand mining, demand for proppant, and the toll of the industry on agricultural productivity, forests and the carbon cycle.
Mining Photos
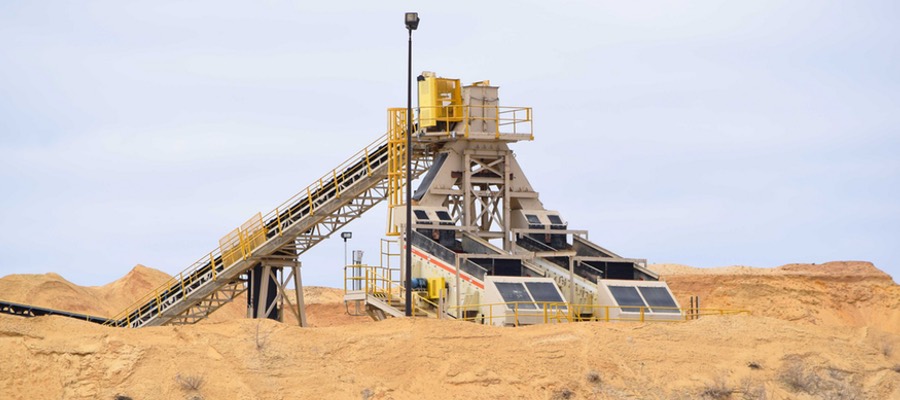
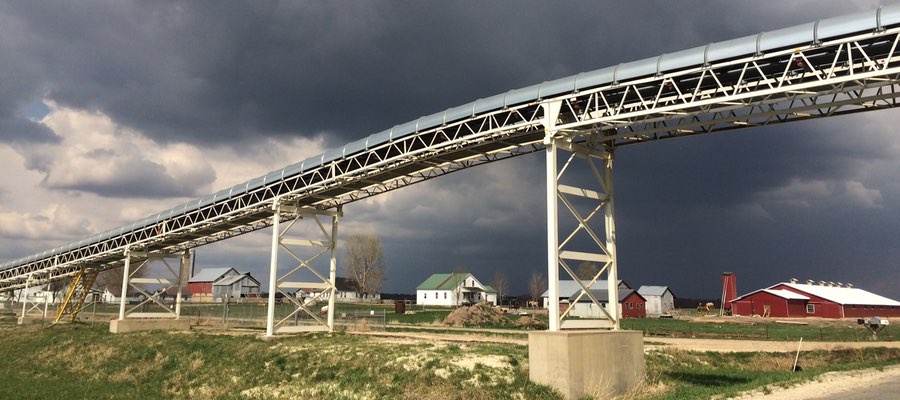
During the five day trip, sand mines were visited and documented, their incongruent and expanding presence marring the countryside. Some of them can be seen in this photo gallery:
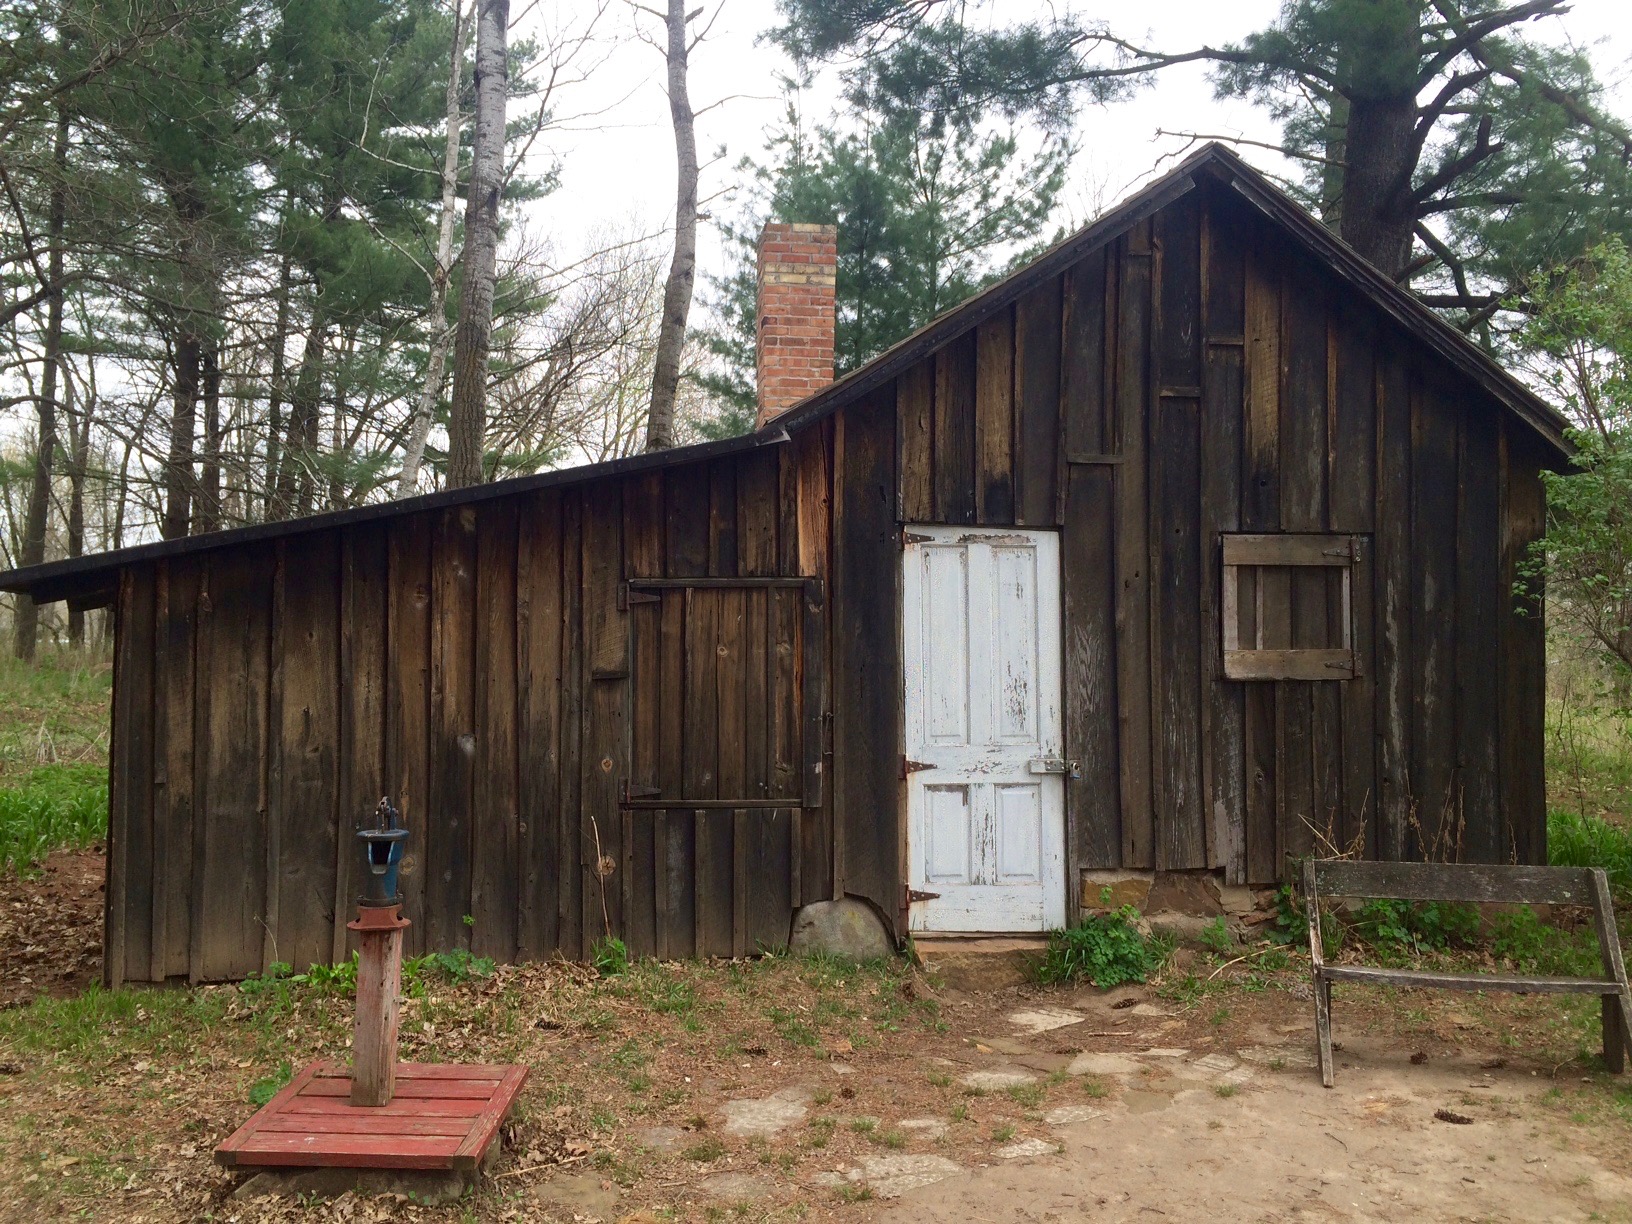
On Earth Day, while driving east to return to Milwaukee, Sandhill cranes, a timeless symbol of the Wisconsin wild, poked the rich prairie soils searching for food. Joined by Autumn Sabo, a botanist and researcher who assisted our Wisconsin work, we detoured to the nearby Aldo Leopold Center visiting the simple shack that inspired Mr. Leopold to write Sand County Almanac. Considering the reason for my travel, the irony was thick. Ecological consciousness has come a long way, but more evangelism is sorely needed.
Aldo Leopold Center, Wisconsin
https://www.fractracker.org/a5ej20sjfwe/wp-content/uploads/2016/05/WITour-Feature.jpg400900Guest Authorhttps://www.fractracker.org/a5ej20sjfwe/wp-content/uploads/2021/04/2021-FracTracker-logo-horizontal.pngGuest Author2016-05-05 15:36:252020-03-11 17:07:10Earth Week in Wisconsin
By Ted Auch, Great Lakes Program Coordinator, and Elliott Kurtz, GIS Intern
The Great Lakes may see a major increase in the number of sand mines developed in the name of fracking. What impacts has the area already seen, and does future development mean for the region’s ecosystem and land use?
Wisconsin’s 125+ silica sand mines and processing facilities are spread out across 15,739 square miles of the state’s West Central region, adjacent to the Minnesota border in the Northern Mississippi Valley. These mines have dramatically altered the landscape while generating proppant for the shale gas industry; approximately 2.5 million tons of sand are extracted per mine. The length of the average shale gas lateral well grows by > 50 feet per quarter, so we expect silica sand usage will grow from 5,500 tons to > 8,000 tons per lateral. To meet this increase in demand, additional mines are being proposed near the Great Lakes.
Migration of the sand industry from the Southwest to the Great Lakes in search of this silica sand has had a large impact on regional ecosystem productivity and watershed resilience[1]. The land in the Great Lakes region is more productive, from a soil and biomass perspective; much of the Southwest sandstone geology is dominated by scrublands that have accrue plant biomass at much slower rates, while the Great Lakes host productive forests and agricultural land. Great Lakes ecosystems produce 1.92 times more soil organic matter and 1.46 times more perennial biomass than Southwestern ecosystems.
Effects on the Great Lakes
Quantifying what the landscape looks like now will serve as a baseline for understanding how the silica sand industry will have altered the overall landscape, much like Appalachia is doing today in the aftermath of strip-mining and Mountaintop Removal Mining[2]. West Central Wisconsin (WCW) has a chance to learn from the admittedly short-cited and myopic mistakes of their brethren across the coalfields of Appalachia.
Herein we aim to present numbers speaking to the diversity and distribution of WCW’s “working landscape” across eight types of land-cover. We will then present numbers speaking to how the silica mining industry has altered the region to date and what these numbers mean for reclamation. The folks at UC Berkeley’s Department of Environmental Science, Policy , and Management describe “Working Landscapes” as follows:
a broad term that expresses the goal of fostering landscapes where production of market goods and ecosystem services is mutually reinforcing. It means working with people as partners to create landscapes and ecosystems that benefit humanity and the planet… A goal is finding management and policy synergies—practices and policies that enhance production of multiple ecosystem services as well as goods for the market…Collaborative management processes can help discover synergies and create better decisions and policy. Incentives can help private landowners support management that benefits society.
Methods
We used the 1993 WISCLAND satellite imagery to determine how WCW’s landscape is partitioned and then we applied these data to an updated inventory of silica sand mine boundaries to determine what existed within their boundaries prior to mining. The point locations of Wisconsin’s current inventory of silica sand mines was determined using the “Geocode Address” function in ArcMap 10.2 using the Composite_US Address Locator. Addresses were drawn from mine inventory information originally maintained by the West Central WI Regional Planning Commission (WCWRPC) and now managed by the WI Department of Natural Resources’ Mines, pits and quarries division. Meanwhile current mine extent boundary polygons were determined using one of three satellite data-sets:
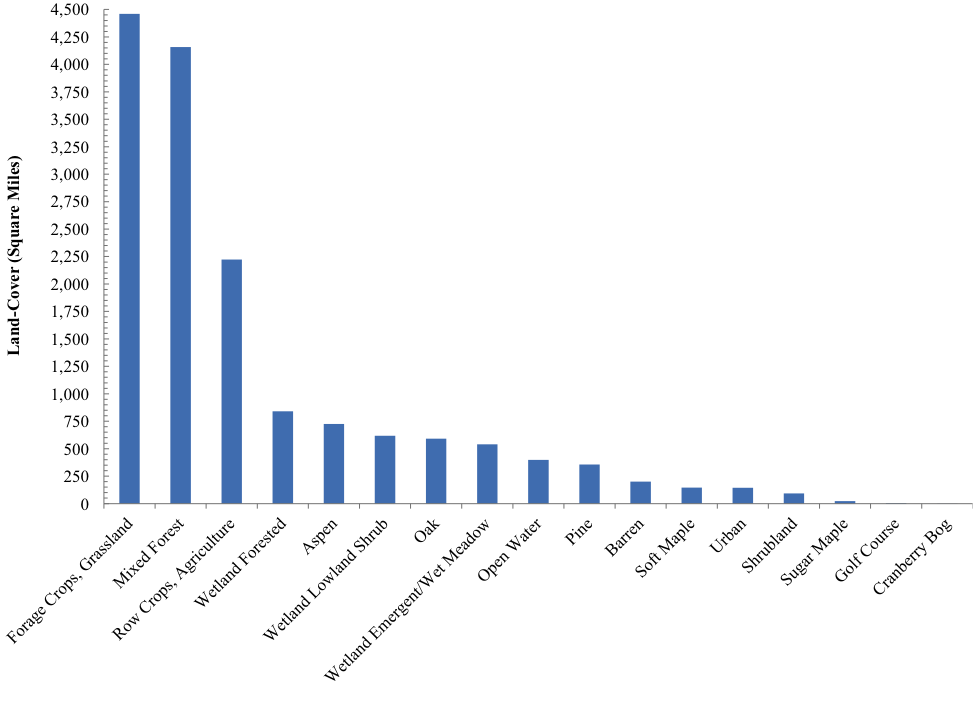
Fig 1. Square mileage of various land cover types replaced by silica sand mining in WCW
Thirty-nine percent of the WCW landscape is currently allocated to forests, 43% to agriculture broadly speaking, and 13% is occupied by various types of wetlands. Open waters occupy 2.6% of the landscape with tertiary uses including barren lands (1.3%), golf courses (0.03%), high and low-density urban areas (0.9%), and miscellaneous shrublands (0.6%) (See Figure 1).
Effects by Land Cover Type
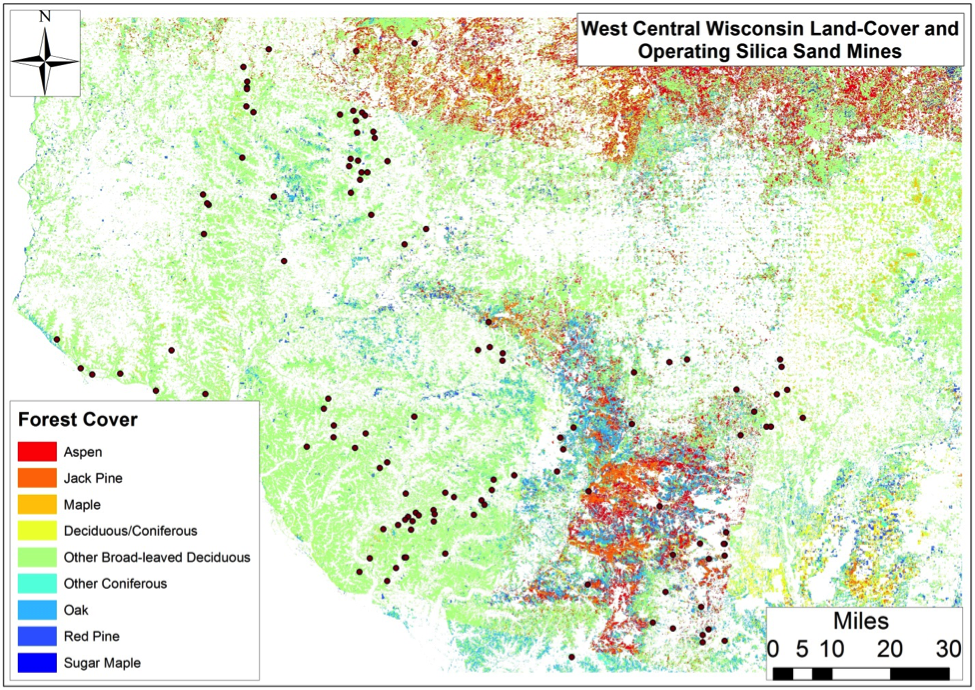
Fig 2. Forest Cover in WCW
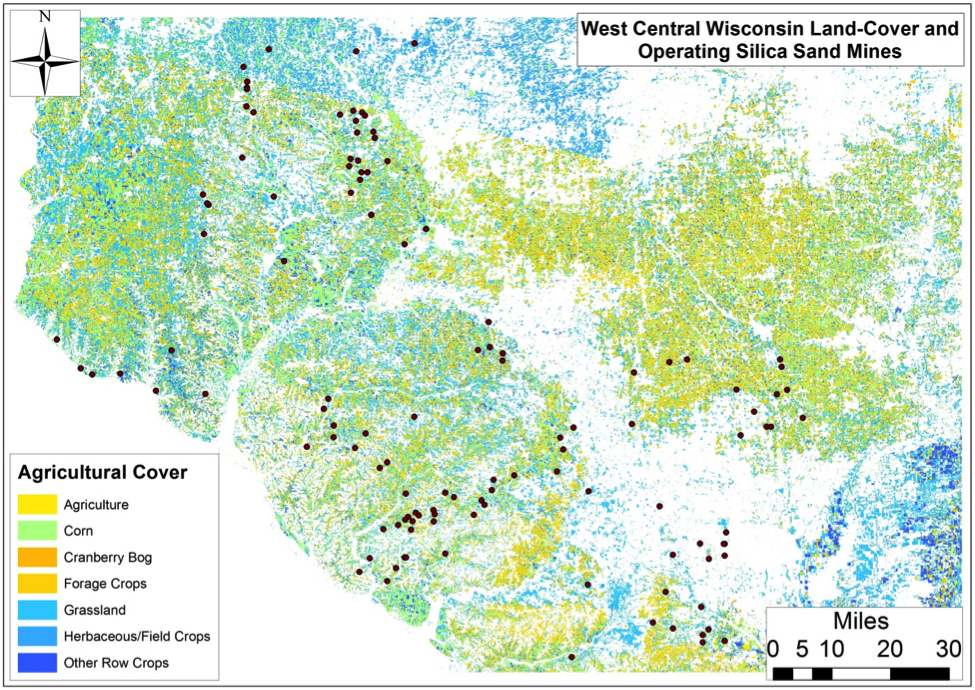
Fig 3. Agricultural Cover
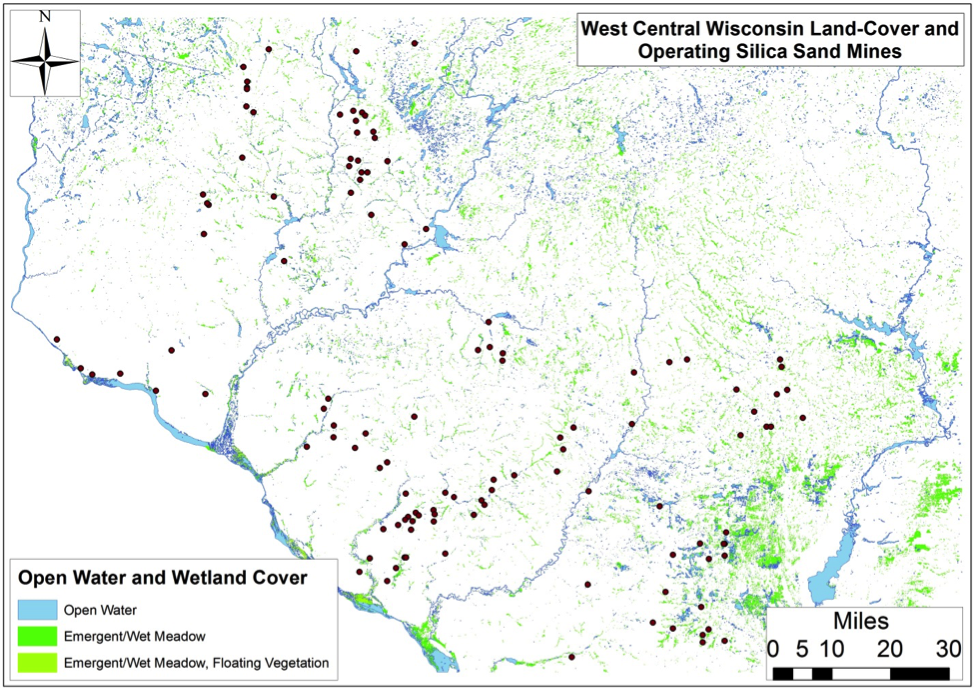
Fig 4. Open Water & Wetland Cover
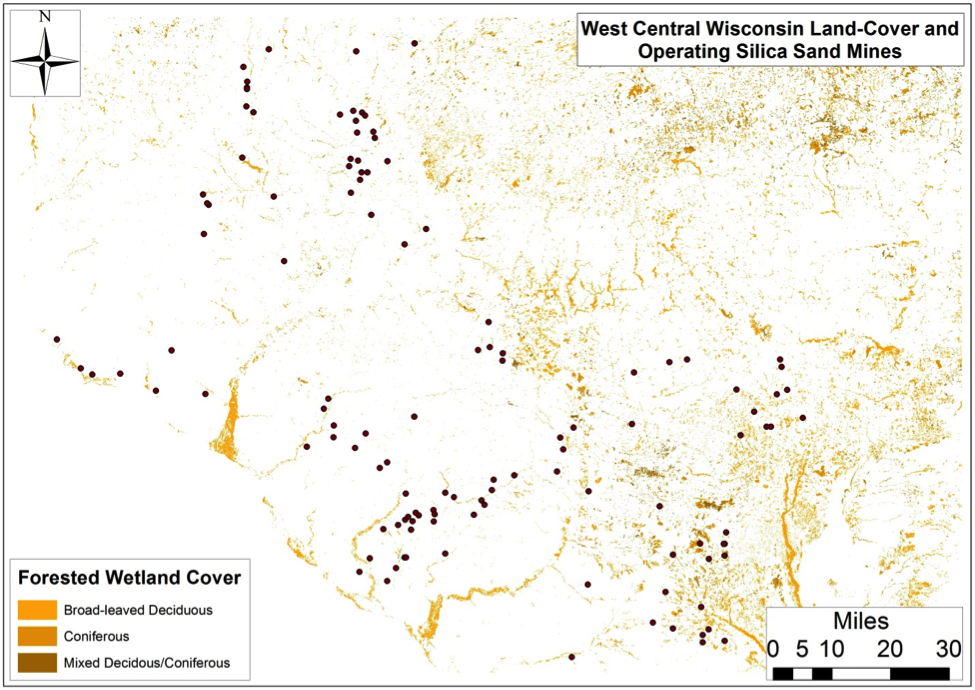
Fig 5. Forested Wetland Cover
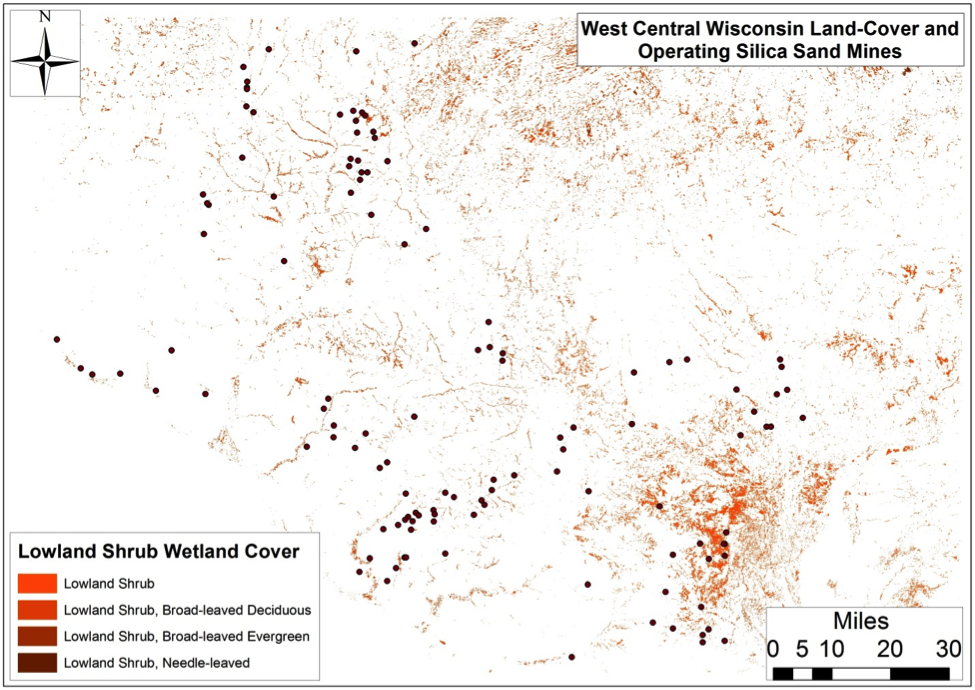
Fig 6. Lowland Shrub Wetlands
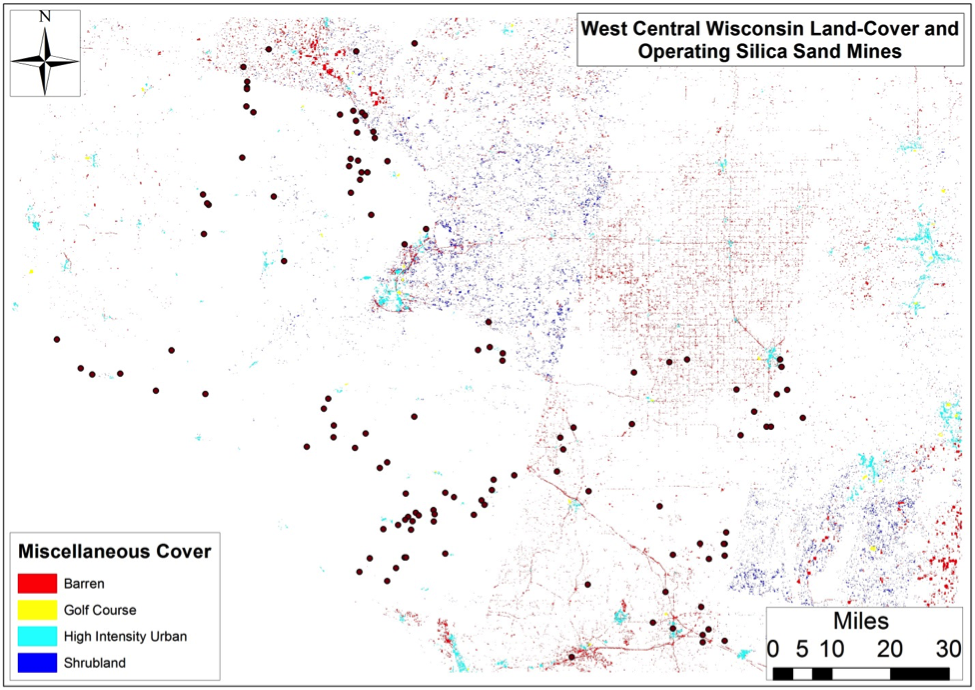
Fig 7. Miscellaneous Cover
Figure 2. The wood in these forests has a current stumpage value of $253-936 million and by way of photosynthesis accumulates 63 to 131 million tons of CO2 and has accumulated 4.8-9.8 billion tons of CO2 if we assumed that on average forests in this region are 65-85 years old. Putting a finer point on WCW forest cover and associated quantifiables is difficult because most of these tracts (2.7 million acres) fall within a catchall category called “Mixed Forest”. Pine (2.3% of the region), Aspen (4.7%), and Oak (3.8%) most of the remaining 1.2 million forested acres with much less sugar (Acer saccharum) and soft (Acer rubrum) maple acreage than we expected scattered in a horseshoe fashion across the Northeastern portion of the study area.
Figure 3. Seven different agricultural land-uses occupy 4.3 million WCW acres with forage crops and grasslands constituting 29% of the region followed by 1.4 million acres of row crops and miscellaneous agricultural activities. Additionally, 2% of WI’s 19,700 cranberry bog acres are within the study area generating $4.02 million worth of cranberries per year. The larger agricultural categories generate $3.2 billion worth of commodities.
Figure 4. Nearly 16% of WCW is characterized by open waters or various types of wetlands with a total area of 2,396 square miles clustered primarily in two Northeast and one Southeast segment. Open waters occupy 398 square miles with forested wetlands – possibly vernal pool-type systems – amounting to 5.4% of the region or 841 square miles. Lowland shrub and emergent/wet meadows occupy 540 and 618 square miles, respectively.
Figure 5. Of the nine types of wetlands present in this region the forested broad-leaved deciduous and emergent/wet meadow variety constitute the largest fraction of the region at 1,107 square miles (7.1% of region). Some percentage of the former would likely be defined by Wisconsin DNR as vernal pools, which do the following according to their Ephemeral Pond program. The WI DNR doesn’t include silica sand mining in its list of 14 threats to vernal pools or potential conservation actions, however.
These ponds are depressions with impeded drainage (usually in forest landscapes), that hold water for a period of time following snowmelt and spring rains but typically dry out by mid-summer…They flourish with productivity during their brief existence and provide critical breeding habitat for certain invertebrates, as well as for many amphibians such as wood frogs and salamanders. They also provide feeding, resting and breeding habitat for songbirds and a source of food for many mammals. Ephemeral ponds contribute in many ways to the biodiversity of a woodlot, forest stand and the larger landscape…they all broadly fit into a community context by the following attributes: their placement in woodlands, isolation, small size, hydrology, length of time they hold water, and composition of the biological community (lacking fish as permanent predators).
Figure 6. Broad-leaved evergreen lowland shrub wetlands constitute ≈2.1% of the region or 319 square miles with most occurring around the Legacy Boggs silica mines and several cranberry operations turned silica mines in Jackson County. Meanwhile broad-leaved deciduous and needle-leaved lowland shrub wetlands are largely outside the current extent of silica sand mining in the region occupying 1.9% of the region with 293 square miles spread out within the northeastern 1/5th of the study area.
Figure 7. Finally, miscellaneous land-covers include 200 square miles of barren land, 145 square miles of low/high intensity urban areas including the cities of Eau Claire (Pop. 67,545) and Stevens Point (Pop. 26,670) as well as towns like Marshfield, Wisconsin Rapids, Merrill, and Rib Mountain-Weston. WCW also hosts 3,204 acres (0.03% of region) worth of golf courses which amounts to roughly 21 courses assuming the average course is 157 acres. Shrublands broadly defined occur throughout 0.6% of the region scattered throughout the southeast corner and north-central sixth of the region, with the both amalgamations poised to experience significant replacement or alteration as they are adjacent to two large silica mine groupings.
Producing Mine Land-Use/Land-Cover Change
To date we have established the current extent of land-use/land-cover change associated with 25 producing silica mines occupying 12 square miles of WCW. These mines have displaced 3 square miles of forests and 7 square miles of agricultural land-cover. These forested tracts accumulated 31,446-64,610 tons of CO2 per year or 2.4-4.9 million tons over the average lifespan of a typical Wisconsin forest. These values equate to the emissions of 144,401-295,956 Wisconsinites or 2.5-5.1% of the state’s population. The annual wood that was once generated on these parcels would have had a market value of $126,097-197,084 per year. Meanwhile the above agricultural lands would be generating roughly $1.5-3.3 million in commodities if they had not been displaced.
However, putting aside measurable market valuations it turns out the most concerning result of this analysis is that these mines have displaces 871 acres of wetlands which equals 11% of all mined lands. This alteration includes 158 acres of formerly forested wetlands, 352 acres of lowland shrub wetlands, and 361 acres of emergent/wet meadows. As we mentioned previously, the chance that these wetlands will be reconstituted to support their original plant and animal assemblages is doubtful.
We know that the St. Peter Sandstone formation is the primary target of the silica sand industry with respect to providing proppant for the shale gas industry. We also know that this formation extend across seven states and approximately 8,884 square miles, with all 91 square miles overlain by wetlands in Wisconsin. To this end carbon-rich grasslands soils or Mollisols, which we discussed earlier, sit atop 36% of the St. Peter Sandstone and given that these soils are alread endangered from past agricultural practices as well as current O&G exploration this is just another example of how soils stand to be dramatically altered by the full extent of the North American Hydrocarbon Industrial Complex. The following IFs would undoubtedly have a dramatic effect on the ability of the ecosystems overlying the St. Peter Sandstone to capture and store CO2 to the extent that they are today not to mention dramatically alter the landscape’s ability to capture, store, and purify precipitation inputs.
IF silica sand mining continues at the rate it is on currently
IF reclamation continues to result in “very poor stand of grass with some woody plants of very poor quality and little value on the whole for wildlife. Some areas may be reclaimed as crop land, however it is our opinion that substantial inputs such as commercial fertilizer as well as irrigation will be required in most if not all cases in order to produce an average crop.”
IF the highly productive temperate forests described above are not reassembled on similar acreage to their extent prior to mining and reclamation is largely to the very poor stands of grass mentione above
For example: Great Lakes forests like the ones sitting atop the St. Peter Sandstone capture 20.9 tons of CO2 per acre per year Vs their likely grass/scrublands replacement which capture 10.6-12.8 tons of CO2 per acre per year… You do the math!
“None two sites are capable of supporting the growing of food. They grow trees and some cover grass, but that is all. General scientific research says that the reclaimed soils lose up to 75% of their agricultural productivity.”
Quote from a concerned citizen:
I often wonder what it was like before the boom, before fortunes were built on castles of sand and resultant moonscapes stretched as far as the eye could see. In the past few years alone, the nickname the “Silica Sand Capital of the World” has become a curse rather than a blessing for the citizens of LaSalle County, Illinois. Here, the frac sand industry continues to proliferate and threaten thewellbeing of our people and rural ecosystem.
The US Forest Service defined Watershed Resilience as “Over time, all watersheds experience a variety of disturbance events such as fires and floods [and mining]. Resilient watersheds have the ability to recover promptly from such events and even be renewed by them. Much as treating forests can make them more resilient to wildfire, watershed restoration projects can improve watershed resilience to both natural and human disturbances.”
https://www.fractracker.org/a5ej20sjfwe/wp-content/uploads/2015/07/SandMine-WI-Feature.jpg400900Ted Auch, PhDhttps://www.fractracker.org/a5ej20sjfwe/wp-content/uploads/2021/04/2021-FracTracker-logo-horizontal.pngTed Auch, PhD2015-07-16 14:24:562020-03-12 14:05:24West Central Wisconsin’s Landscape and What Silica Sand Mining Has Done to It
Each silica sand mine displaces 871 acres of wetlands and more than 12 square miles of forests and agriculture land in Wisconsin to provide the shale gas industry with fracking proppant.
By Juliana Henao, Communications Intern
Silica sand is used by the oil and gas industry as a way to prop open the fractures made during fracking – and is also referred to as a proppant. The industry’s demand for silica sand is steadily increasing (i.e., 4-5K tons per shale lateral, +86 tons per lateral per quarter), directly affecting the Great Lakes, their ecosystems, and land use. Silica sand is often found in Wisconsin and Michigan, which have felt the effects of increased sand mining demands through altered landscapes, impacted ecosystem productivity, and altering watershed resilience; these impacts will only continue to increase as the demand for silica sand increases.
To better understand frack sand mining’s current and potential effects, FracTracker’s Ted Auch and intern Elliott Kurtz, with generous support from the Save The Hills Alliance, explored mining and land use changes data in West Central Wisconsin (WCW). In their research paper, Auch and Kurtz show the current and future environmental impacts of increased sand mining in WCW in order to supply the oil and gas industry with sand. Not only does this research illustrate what is at risk in the WCW landscape, it also showcases what sand mining has already done to the region.
Sixteen percent, or 2,396 square miles, of the West Central Wisconsin (WCW) is made up of wetlands or open waters. These and the other existing WCW landscapes are unquestionably profitable. The forests buffer climate change impacts – to date accumulating between 4.8-9.8 billion tons of CO2 assuming they are 65-85 years old – and have a current stumpage value of $253-936 million.
The 25 producing silica mines in this region occupy 12 square miles of WCW and have already displaced:
3 mi2 of forests
7 mi2 of agricultural land-cover
1.36 mi2 of wetlands (equal to 11% of all mined lands)
Formerly, these wetlands were one of three types:
18% (158 acres) forested wetlands
41% (353 acres) lowland shrub wetlands, and
41% (361 acres) emergent/wet meadows
Breakdown of the current landscape types near these expanding mines, based on an analysis of satellite imagery
Why Wisconsin?
There are more than 125 silica sand mines throughout WCW, a stretch of ~16,000 square miles. Previously, the mining industry focused their efforts in Oklahoma and Texas’s Riley, Hickory/Brady, and Old Creek formations, where the land is not as agriculturally or ecologically productive as WCW. Now, more and more mines are being proposed and built in the WCW region. We wanted to determine what this change would mean for such an ecosystem diverse area of Wisconsin – many of which are considered “globally imperiled” or “globally rare” including oak savanna, dry prairies, southern dry-mesic forests, pine barrens, moist cliffs and oak openings.
The St. Peter Sandstone – along with the early Devonian and much smaller Sylvania Sandstone in Southeastern Michigan – is the primary target of the silica sand industry. Carbon-rich grassland soils cover 36% of the St. Peter, where they aid the ecosystem by capturing and sorting 20.9 tons of CO2 per year, as well as purifying precipitation inputs. This ecosystem, amongst many others around sand mining activities, will be dramatically altered if silica sand mining continues at its increasing rate. We will see CO2 capturing levels drop from 20.9 tons to 10.6 tons per acre per year if the highly productive temperate forests are not reassembled and reclaimed to their original acreage, as well as a significant loss (75%) in agricultural productivity on sites that are not reclaimed properly.
Out-of-state mining companies are settling into Wisconsin and displacing the land at a very high rate. As the president of Iowa’s Allamakee County Protectors Ric Zarwell told us by email “Frac sand mining companies do not come from the area where I live. So efforts to destroy landscapes for frac sand are going to involve Neighbors Opposing Invaders.”
A high demand in silica sand from the shale gas industry will continue to drive this influx of mining companies into WI, providing a potentially collapsed ecosystem in the future. Factors at play include additional – and often much larger – mines under consideration, the average shale gas lateral grows by > 50 feet per quarter, and silica sand usage will grow from 5,500 tons to > 8,000 tons per lateral (i.e., 85 tons per quarter per lateral). Auch and Kurtz’s research paper describes in detail where how much silica sand might be needed in the future, as well as a detailed set of maps depicting land cover and usage in WI.
Potential Land-Cover Change and Ecosystem Services By Ted Auch, Great Lakes Program Coordinator, FracTracker Alliance
Chieftain Metals Corp, a relatively large mining company, recently proposed to develop nine silica sand mines in the Barron County, Wisconsin towns of Sioux Creek and Dovre, as well as adjacent Public Land Survey System (PLSS) parcels.1 Here we show that the land that Chieftain is proposing to convert into one of the state’s largest collections of adjacent silica sand mine acreage (like the one shown above) currently generates $8-15 million in ecosystem services and commodities per year.
Background
Sand, often silica sand, is used in the hydraulic fracturing process of oil and gas drilling. Including sand in the frac fluid helps to prop open the small cracks that are created during fracking so that the hydrocarbons can be more easily drawn into the well. To supply the growth in the oil and gas industry, bigger and bigger sand mines are being developed with four factors being critical to this expansion:
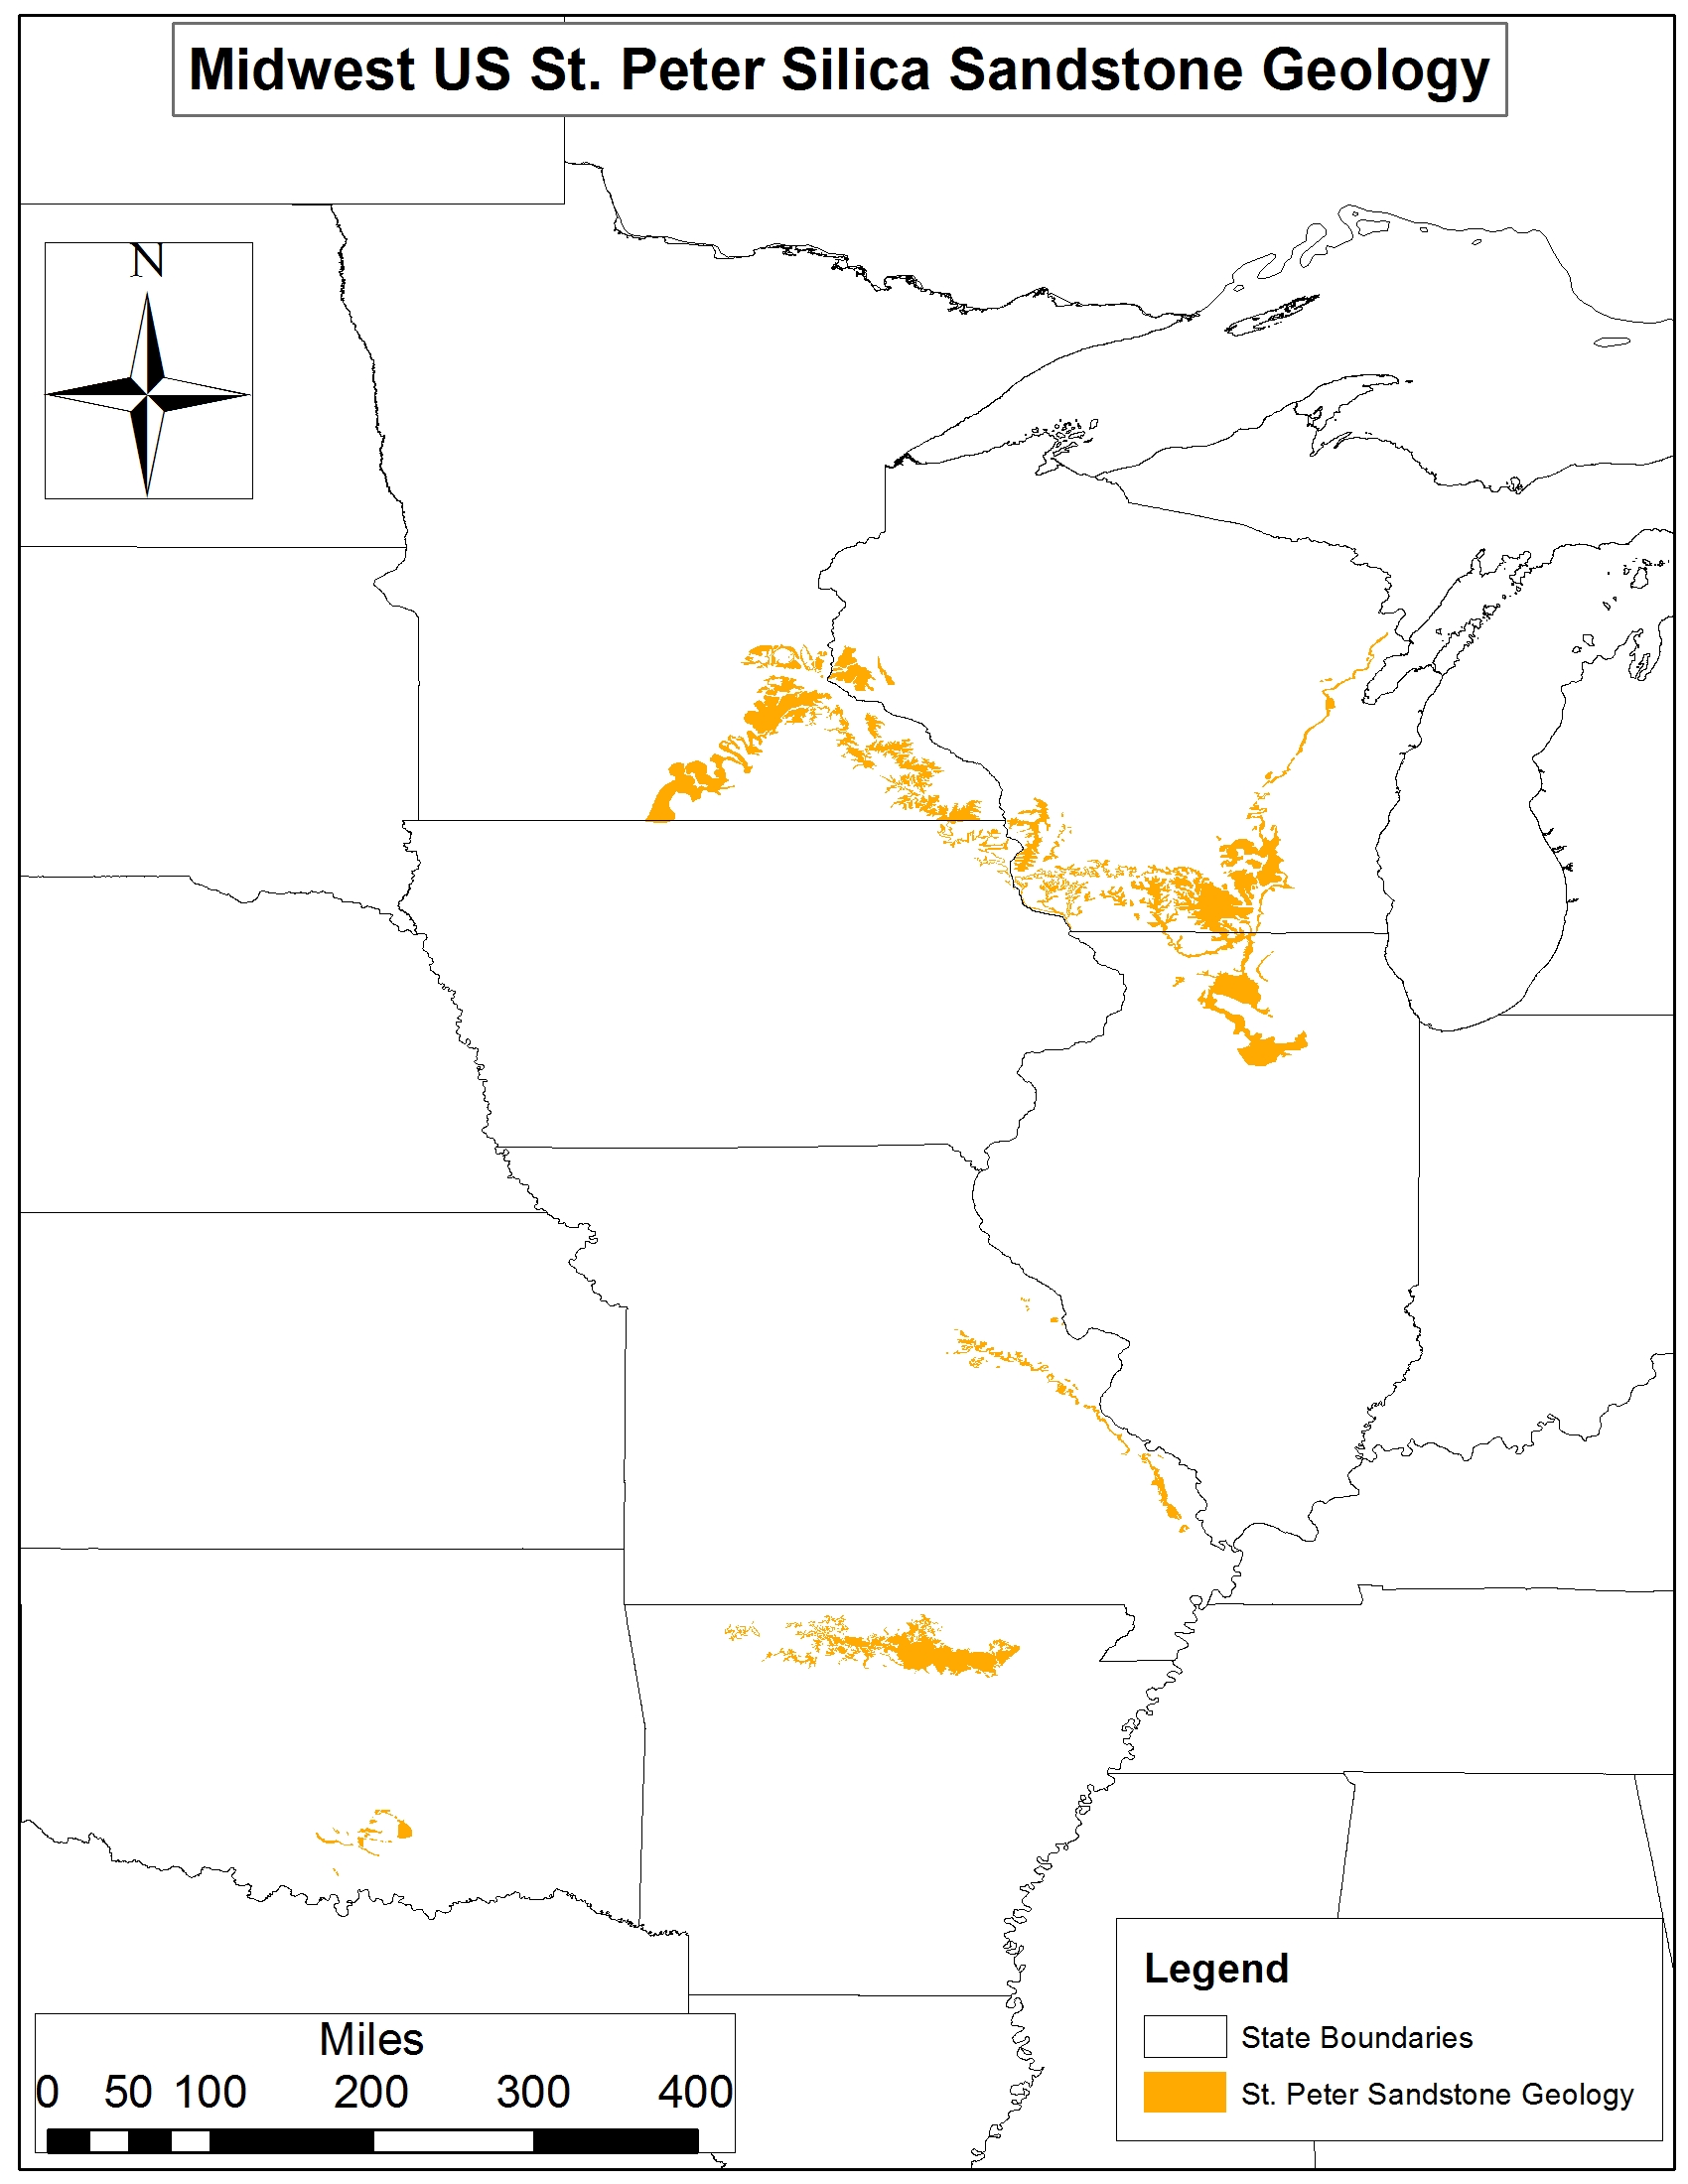
Figure 1. St. Peter Silica Sandstone geology across Minnesota, Wisconsin, Illinois, Missouri, Arkansas, and Oklahoma
The average shale lateral is getting longer by 50-55 feet per quarter and the average silica sand demand is increasing in parallel by 85-90 tons per lateral per quarter with current averages per lateral in the range of 3,500-4,300 tons (Note: These figures stem from an analysis of 780 and 1,120 Ohio and West Virginia laterals, respectively.)
The average silica sand mine proposal throughout the Great Lakes is increasing exponentially.
The average sand mine is targeted at non-agricultural parcels disproportionately. As an example we looked at one of the primary Wisconsin frac sand counties and found that even though 6% of the county was forested and nearly 50% was in some form of agriculture, 98.2% of the frac sand mine area was forested prior to mining. An already fragmented landscape with respect to threatened or endangered ecosystems is becoming even more so, as the price of sand hits an exponential phase and the silica industry all but abandons its positions in Oklahoma and Texas.
The primary geology of interest to the silica sand industry is the St. Peter Silica sandstone geology, which includes much of Southern Minnesota, West Central and Southern Wisconsin, as well as significant sections of Missouri and Arkansas (Figure 1).
To quantify the land-cover/land-use change (LULC) of these proposed mines, we extracted the parcel locations from WI DNR’s Surface Water Data Viewer using the company’s construction permit.2 These parcels encompass approximately 5,671 acres along the edge of what US Forest Service calls the Eastern Broadleaf Forest (Minnesota & NE Iowa Morainal, Oak Savannah) and Laurentian Mixed Forest provinces (Southern Superior Uplands).
Using a now-defunct WI DNR program called WISCLAND we were able to determine the land-cover within the aforementioned acreage in an effort to determine potential changes in ecosystem services and watershed resilience. The WISCLAND satellite imagery was generated in 1992, so it provided a nice snapshot of what this region’s landscape looks like absent silica sand mining.
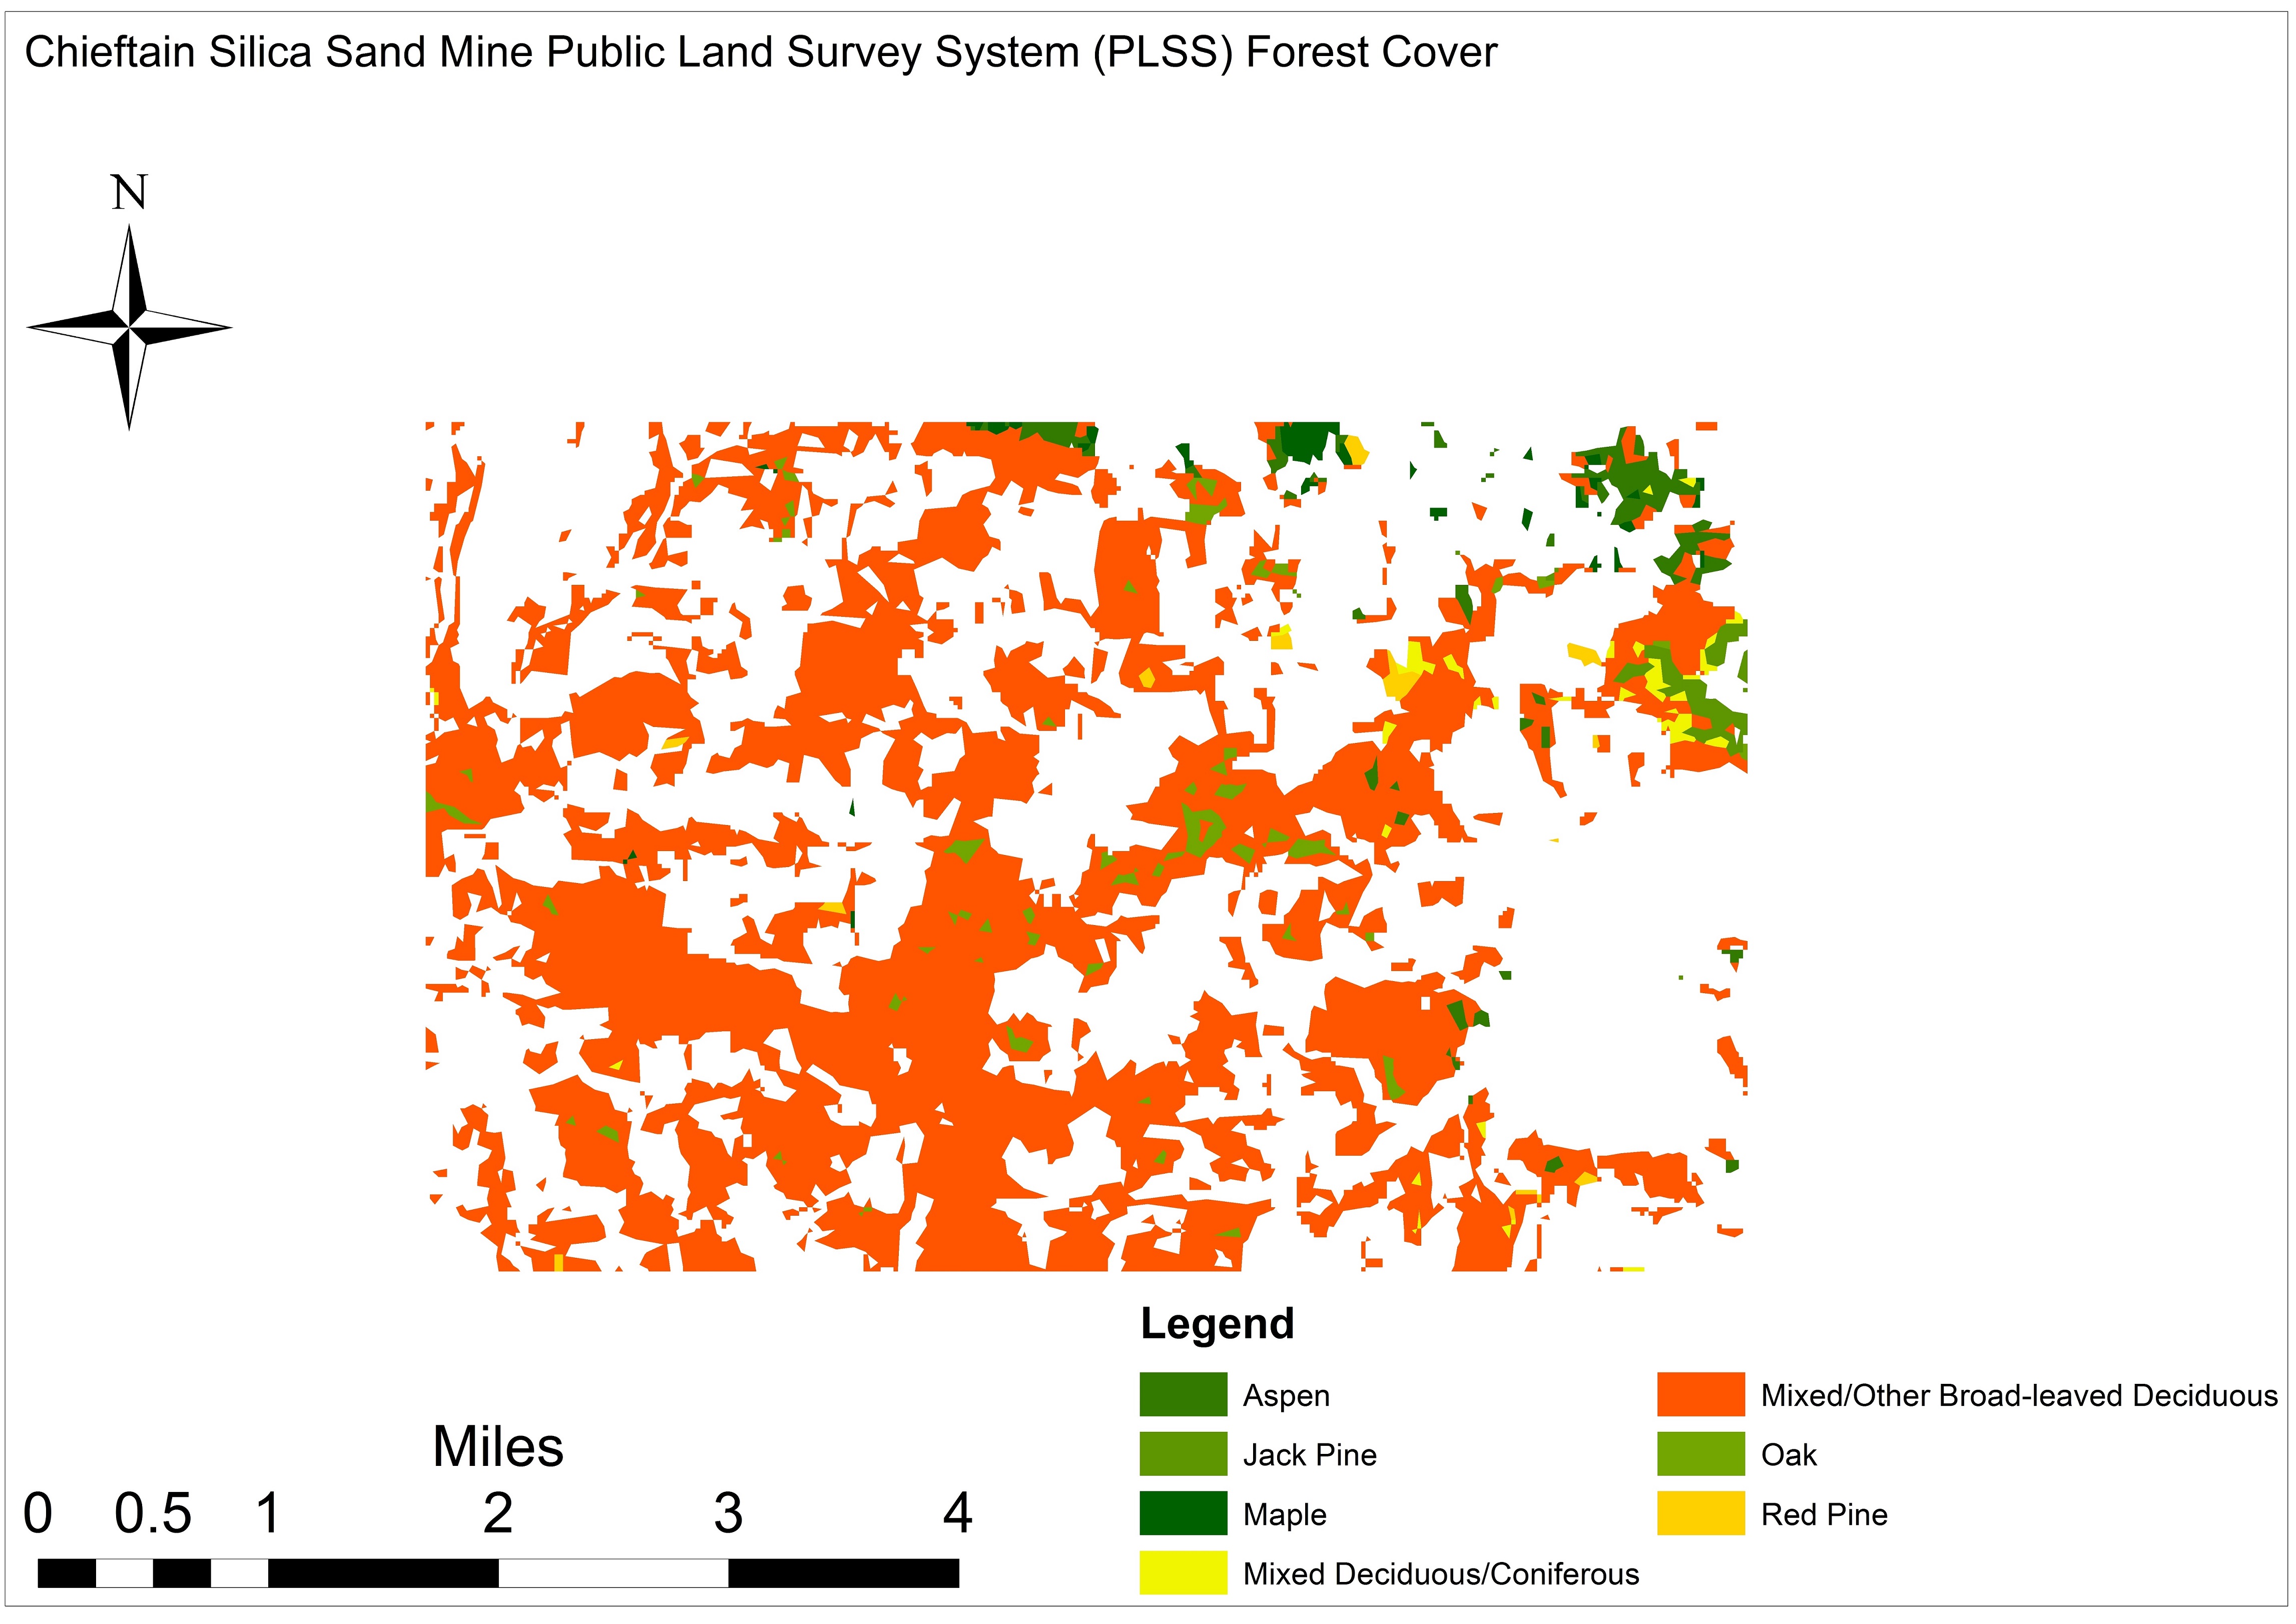
In our joining of the PLSS and WISCLAND data we determined that 2,684 acres (47%) are currently covered by forests, namely:
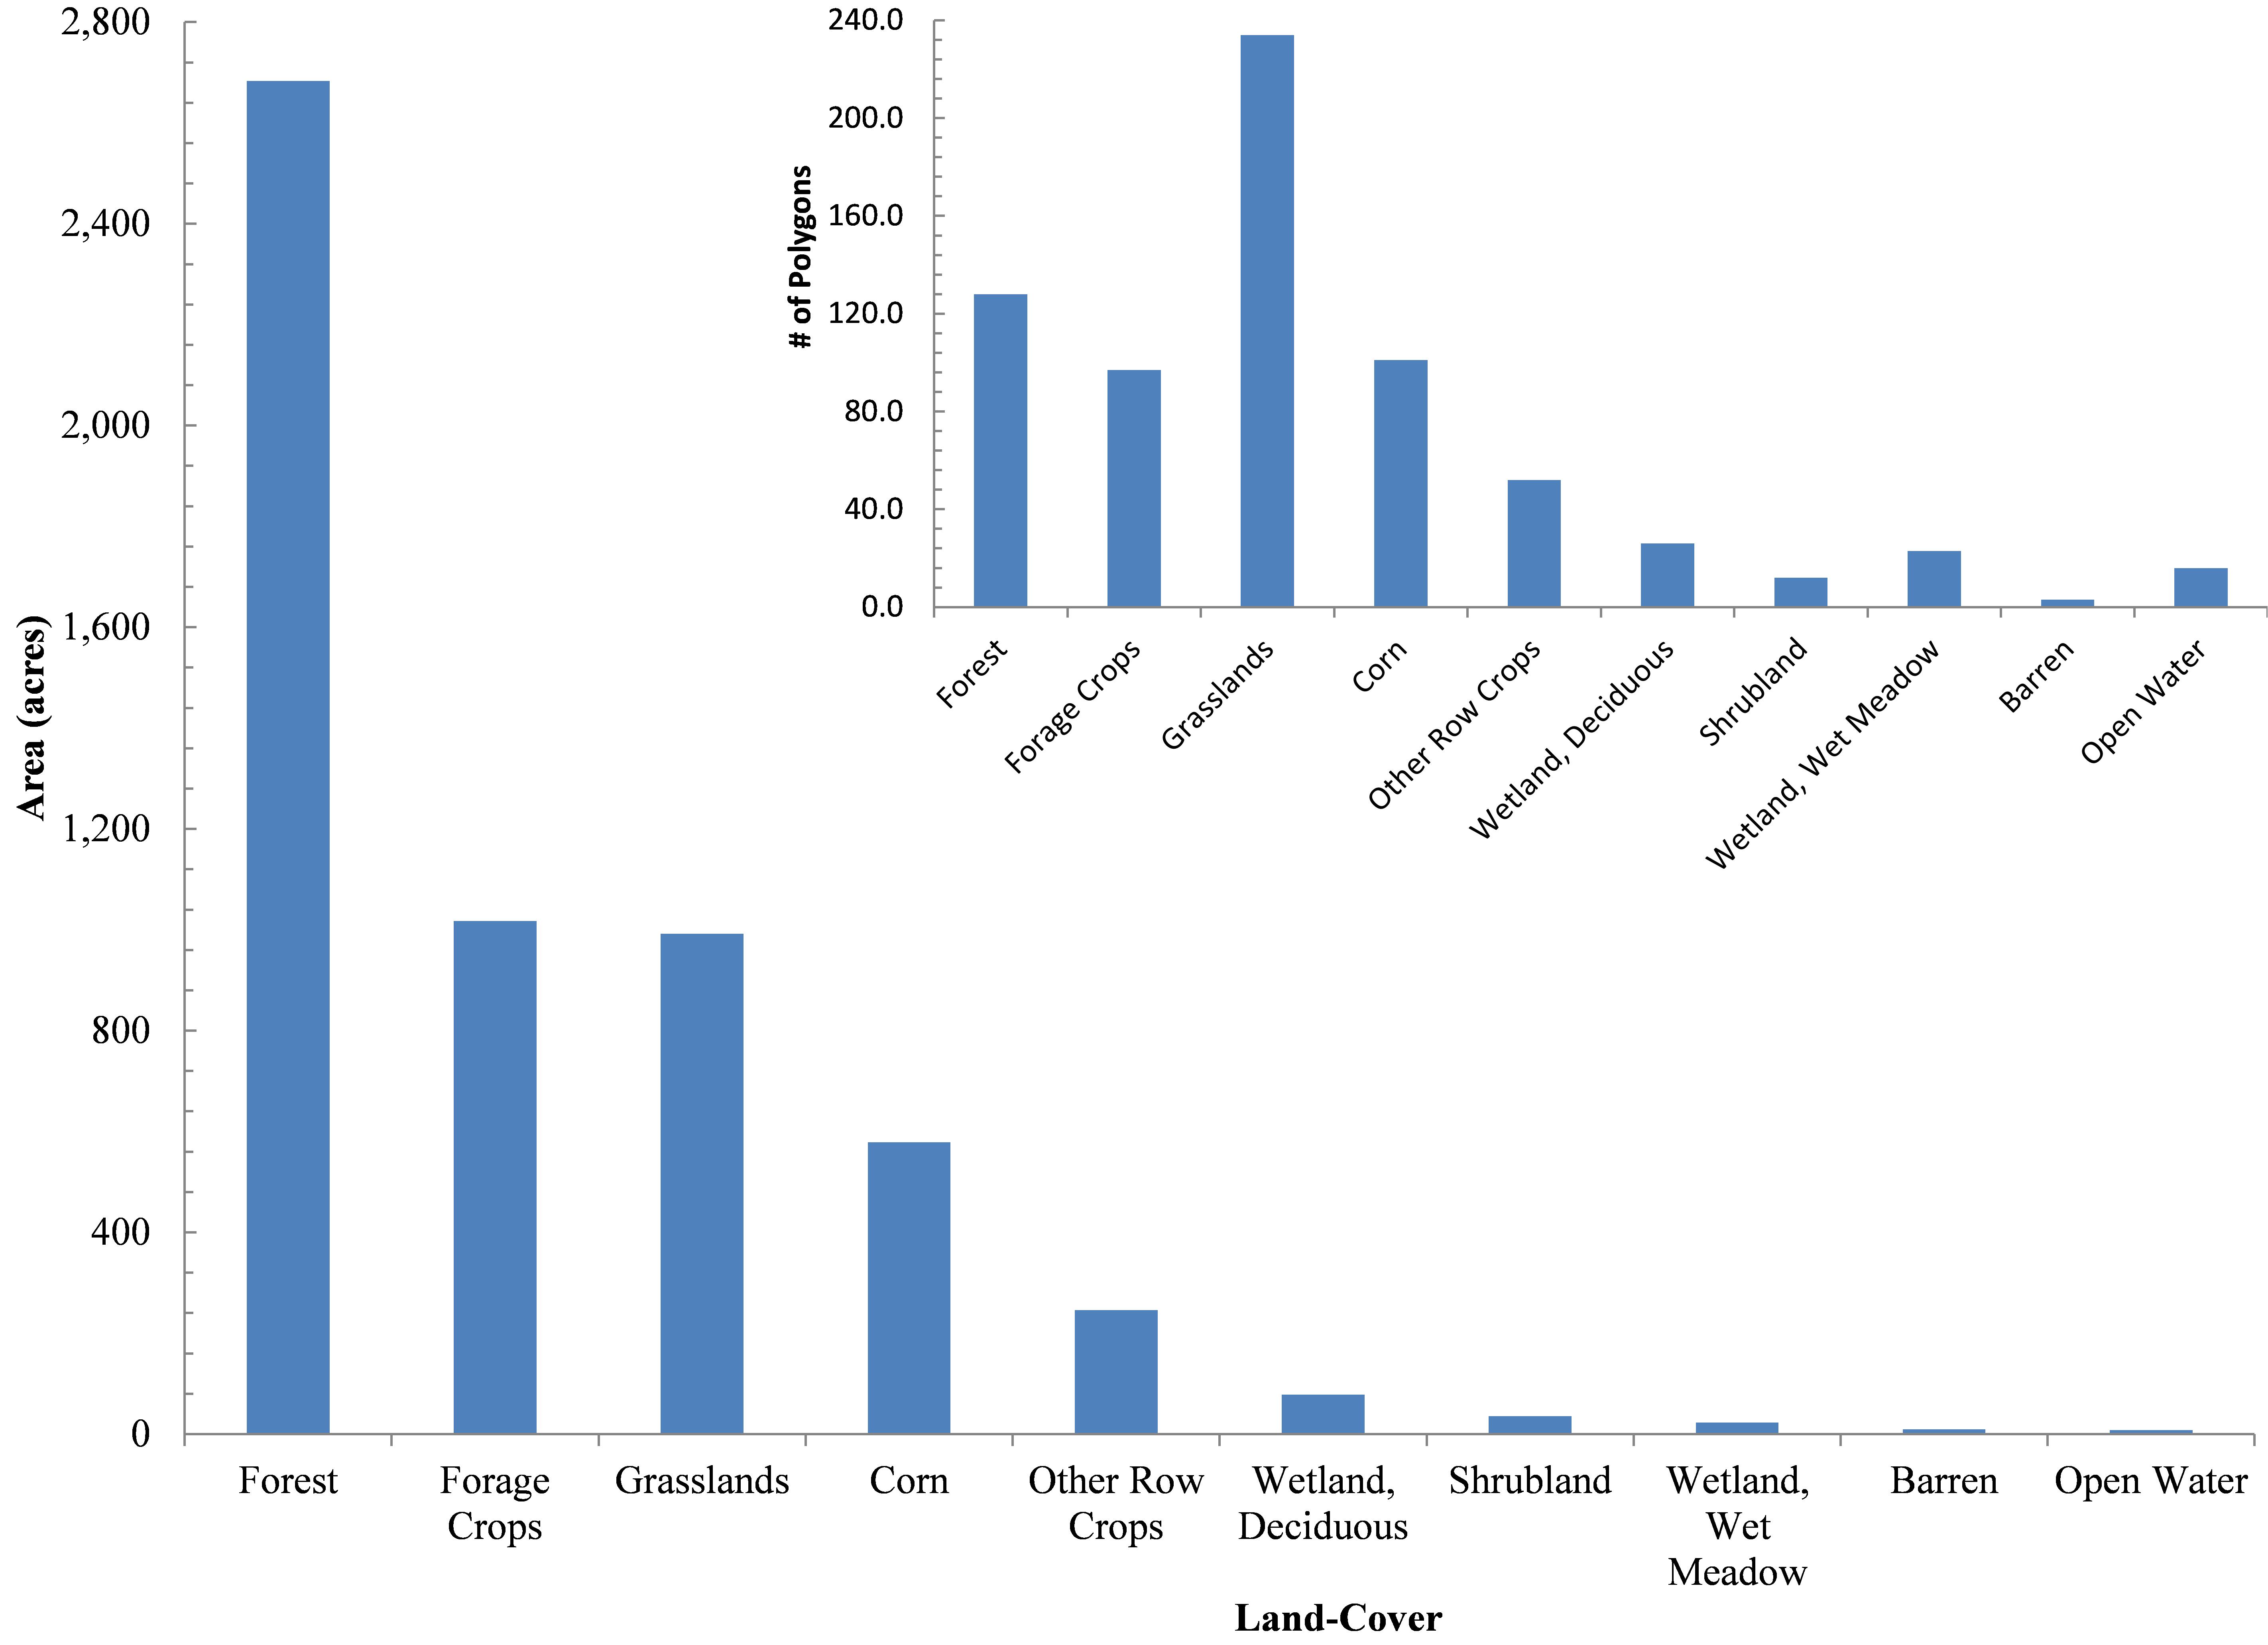
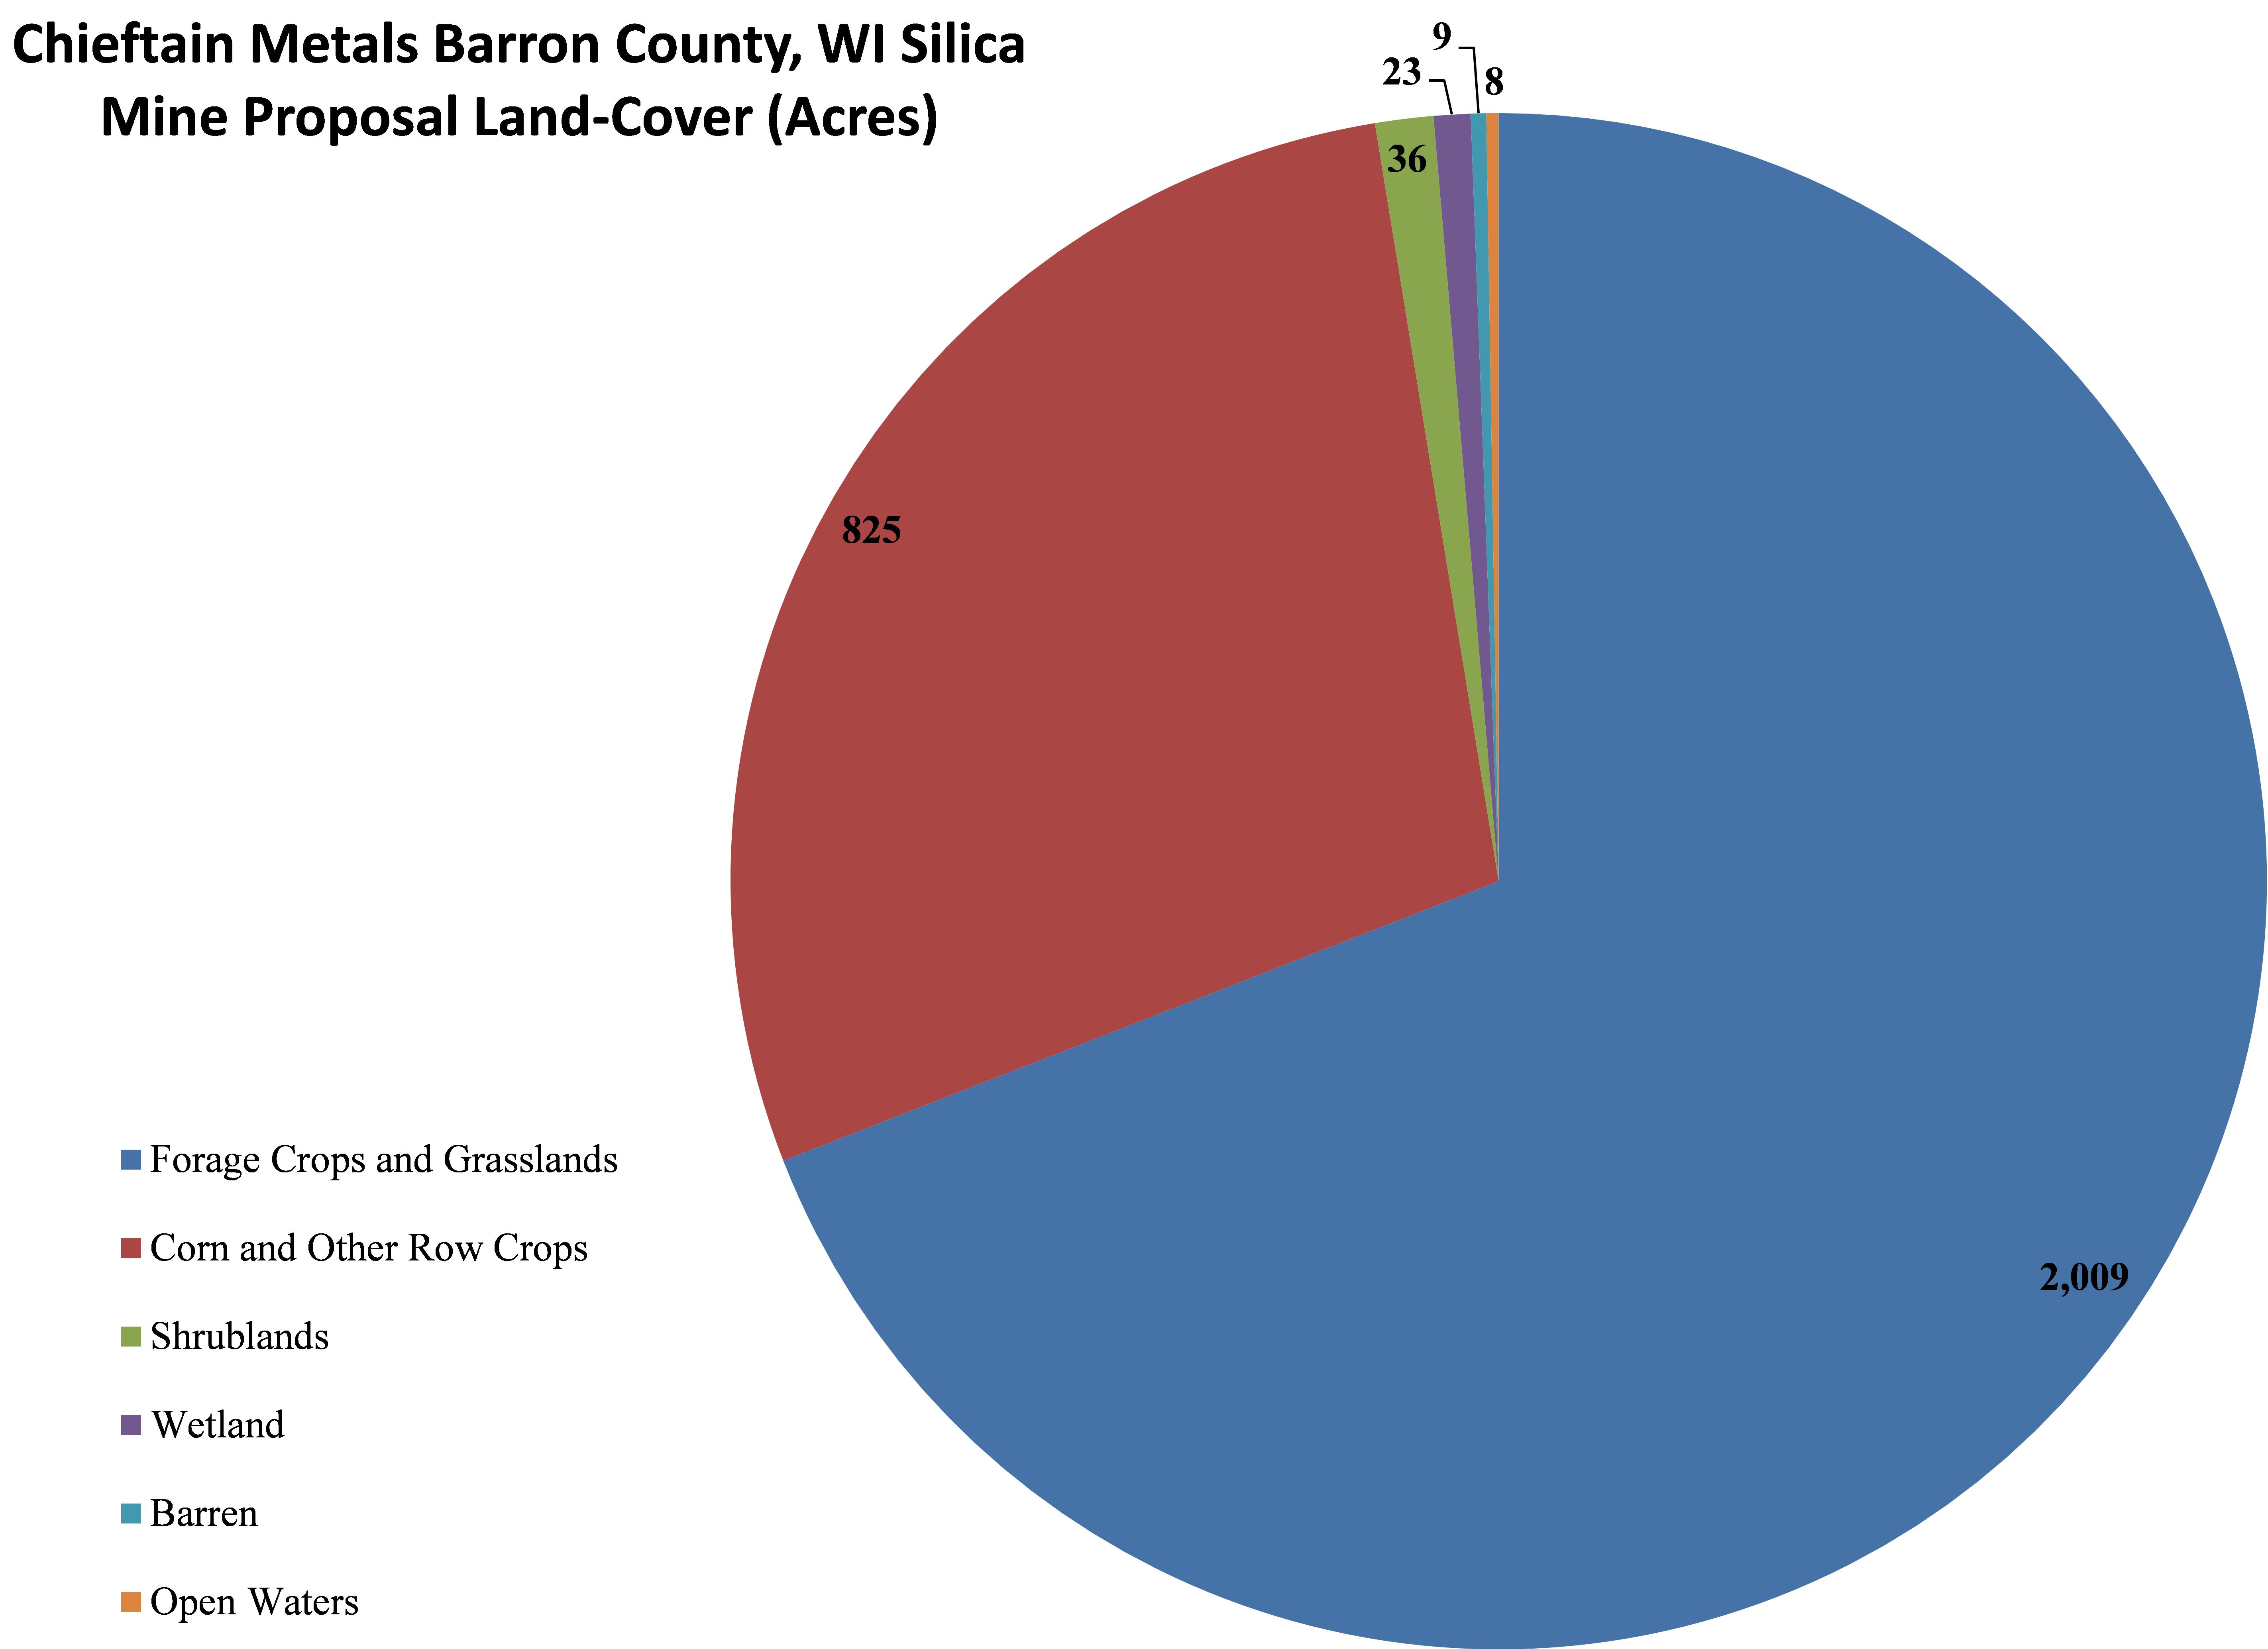
Figure 2. Chieftain silica sand mine proposal’s land-cover across 5,671 acres in Barron County, WI
Figure 3. Chieftain proposal’s forest cover across 5,671 acres in Barron County, WI
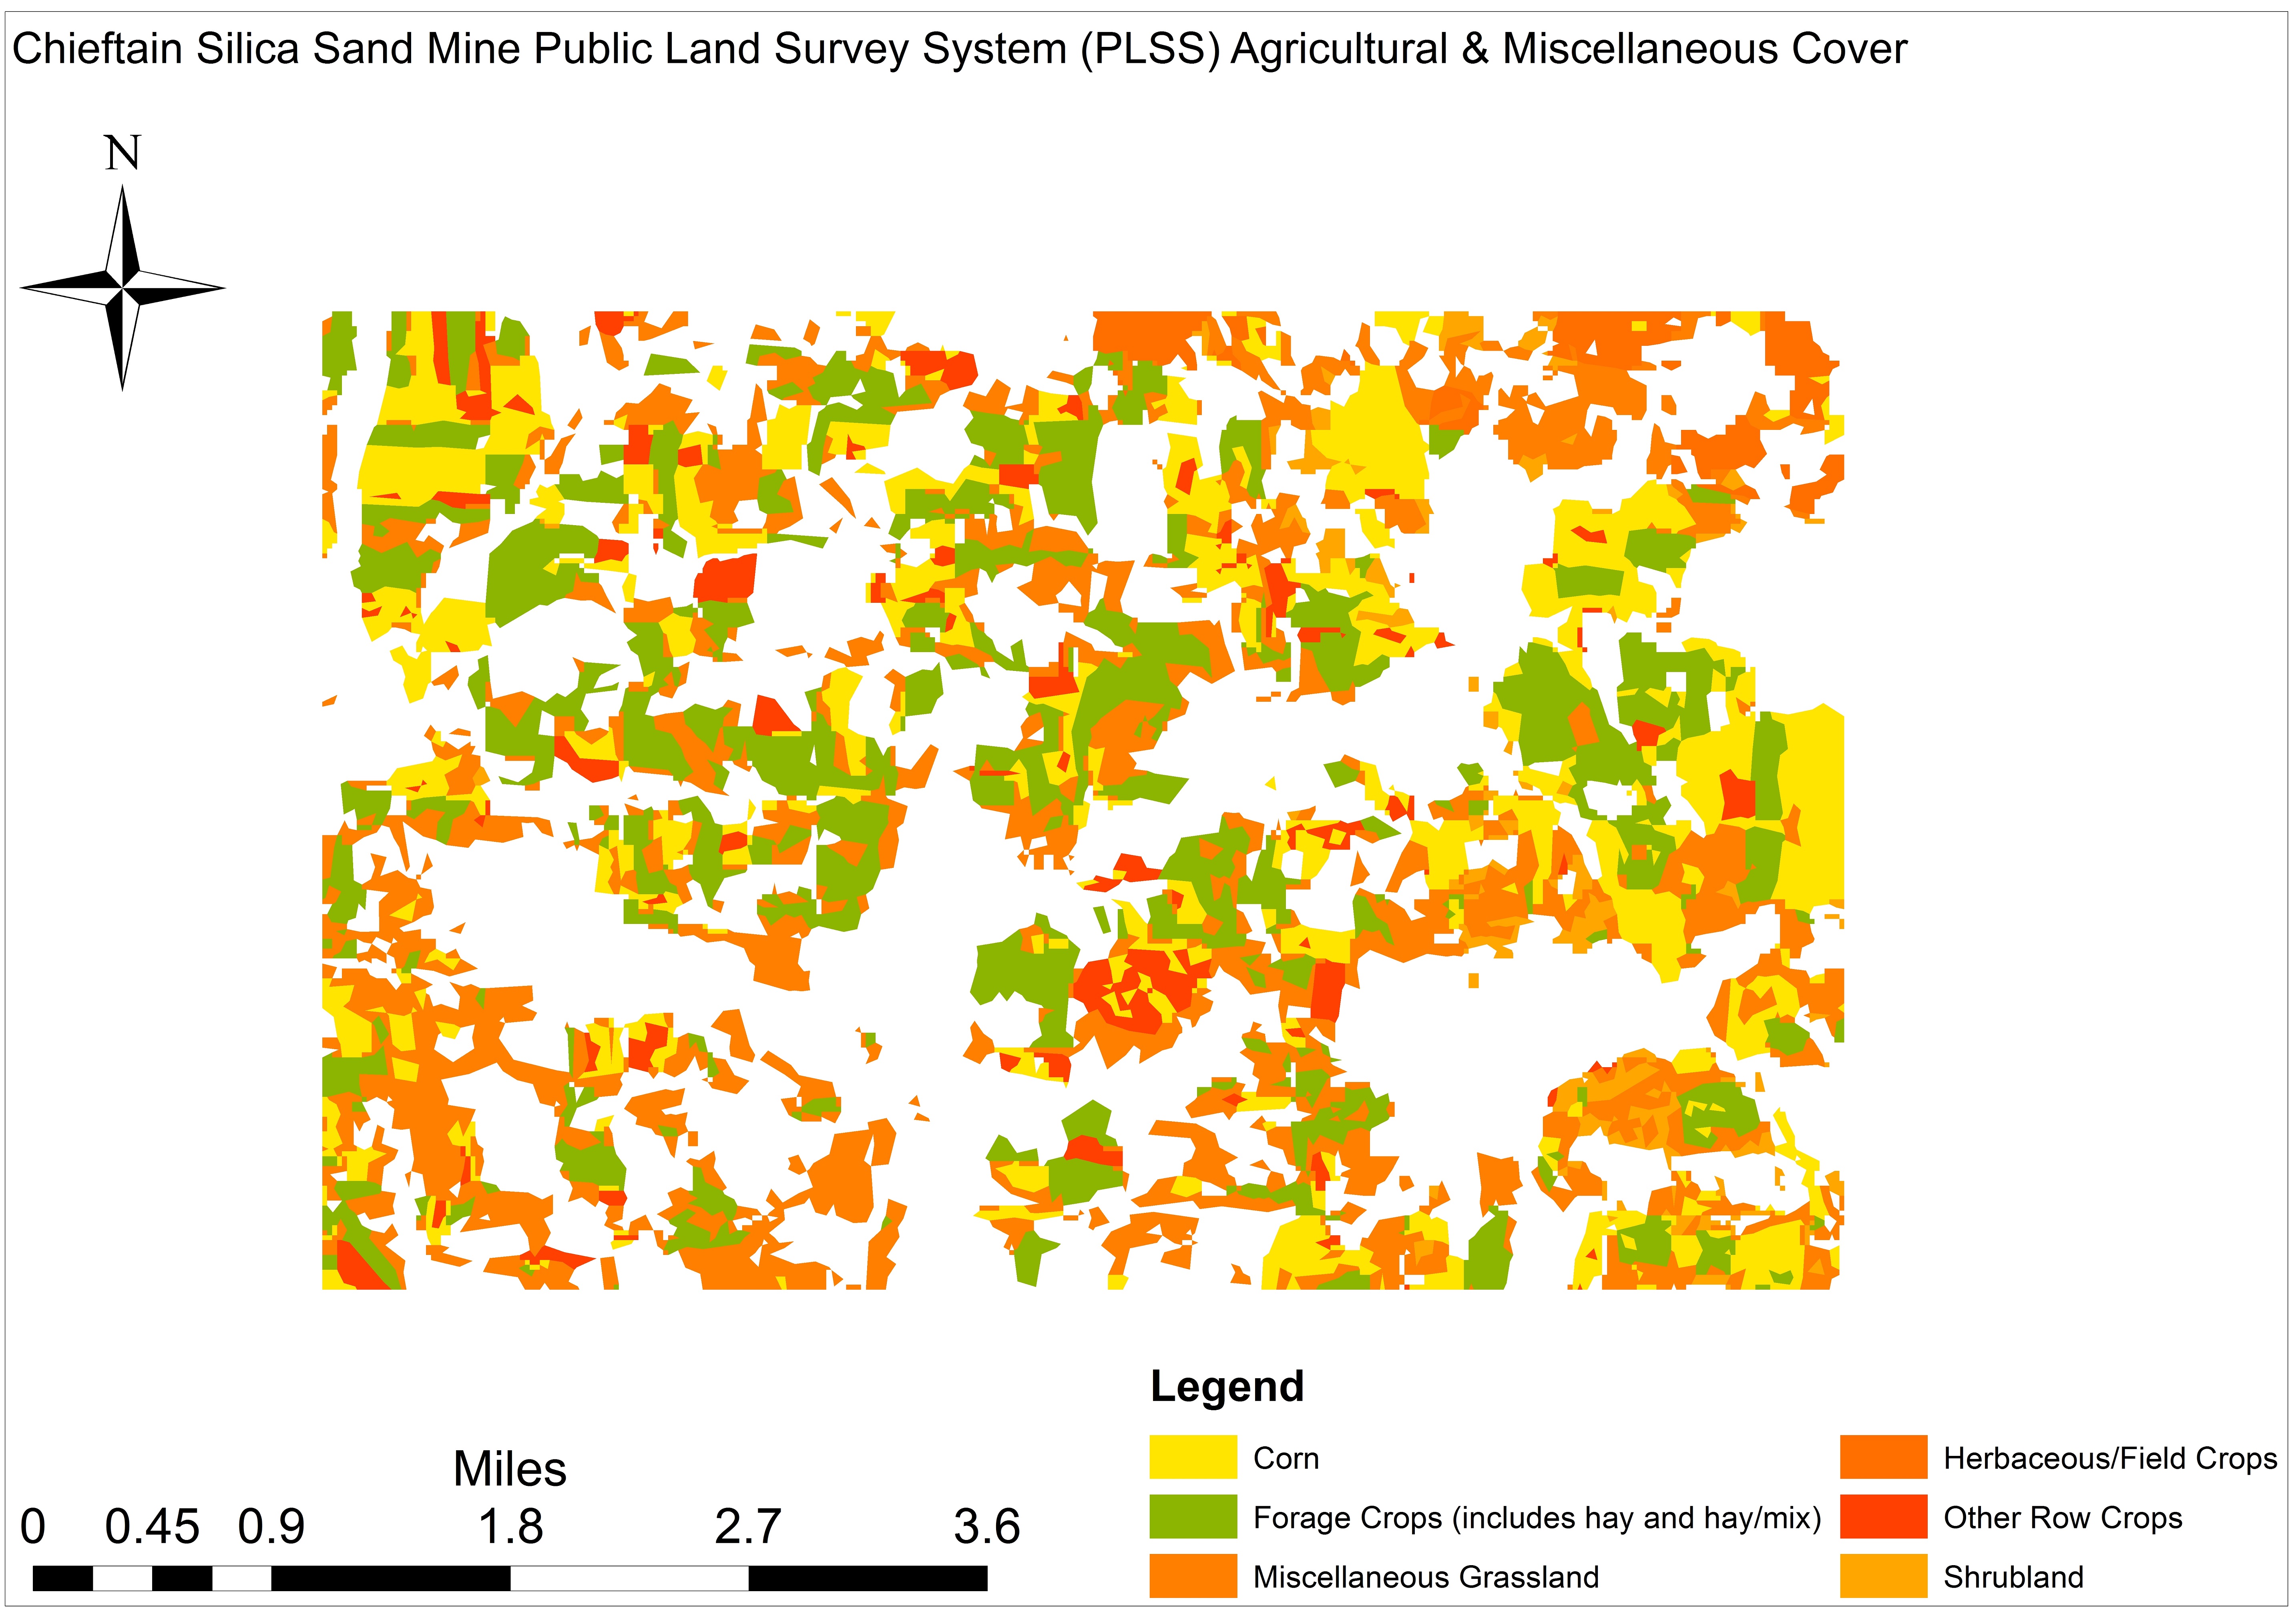
Forage crops and grasslands occupy 2,010 acres (35%) across 331 polygons averaging 7 acres scattered across the proposed mining area. Corn and other row crops account for 825 acres (15%) of Chieftain’s proposal, randomly distributed across the area of interest. Collectively, these land-cover types account for 22% of all polygons averaging 5.7 and 4.7 acres, respectively. Shrublands account for ≤1% of the Chieftain proposal (36 acres) averaging 3 acres spread across a mere 12 polygons (Figures 4 and 5).
Figure 4. Chieftain proposal’s agricultural & miscellaneous cover across 5,671 acres, Barron County, WI
Figure 5. Chieftain proposal’s land-cover by acreage across 5,671 acres, Barron County, WI
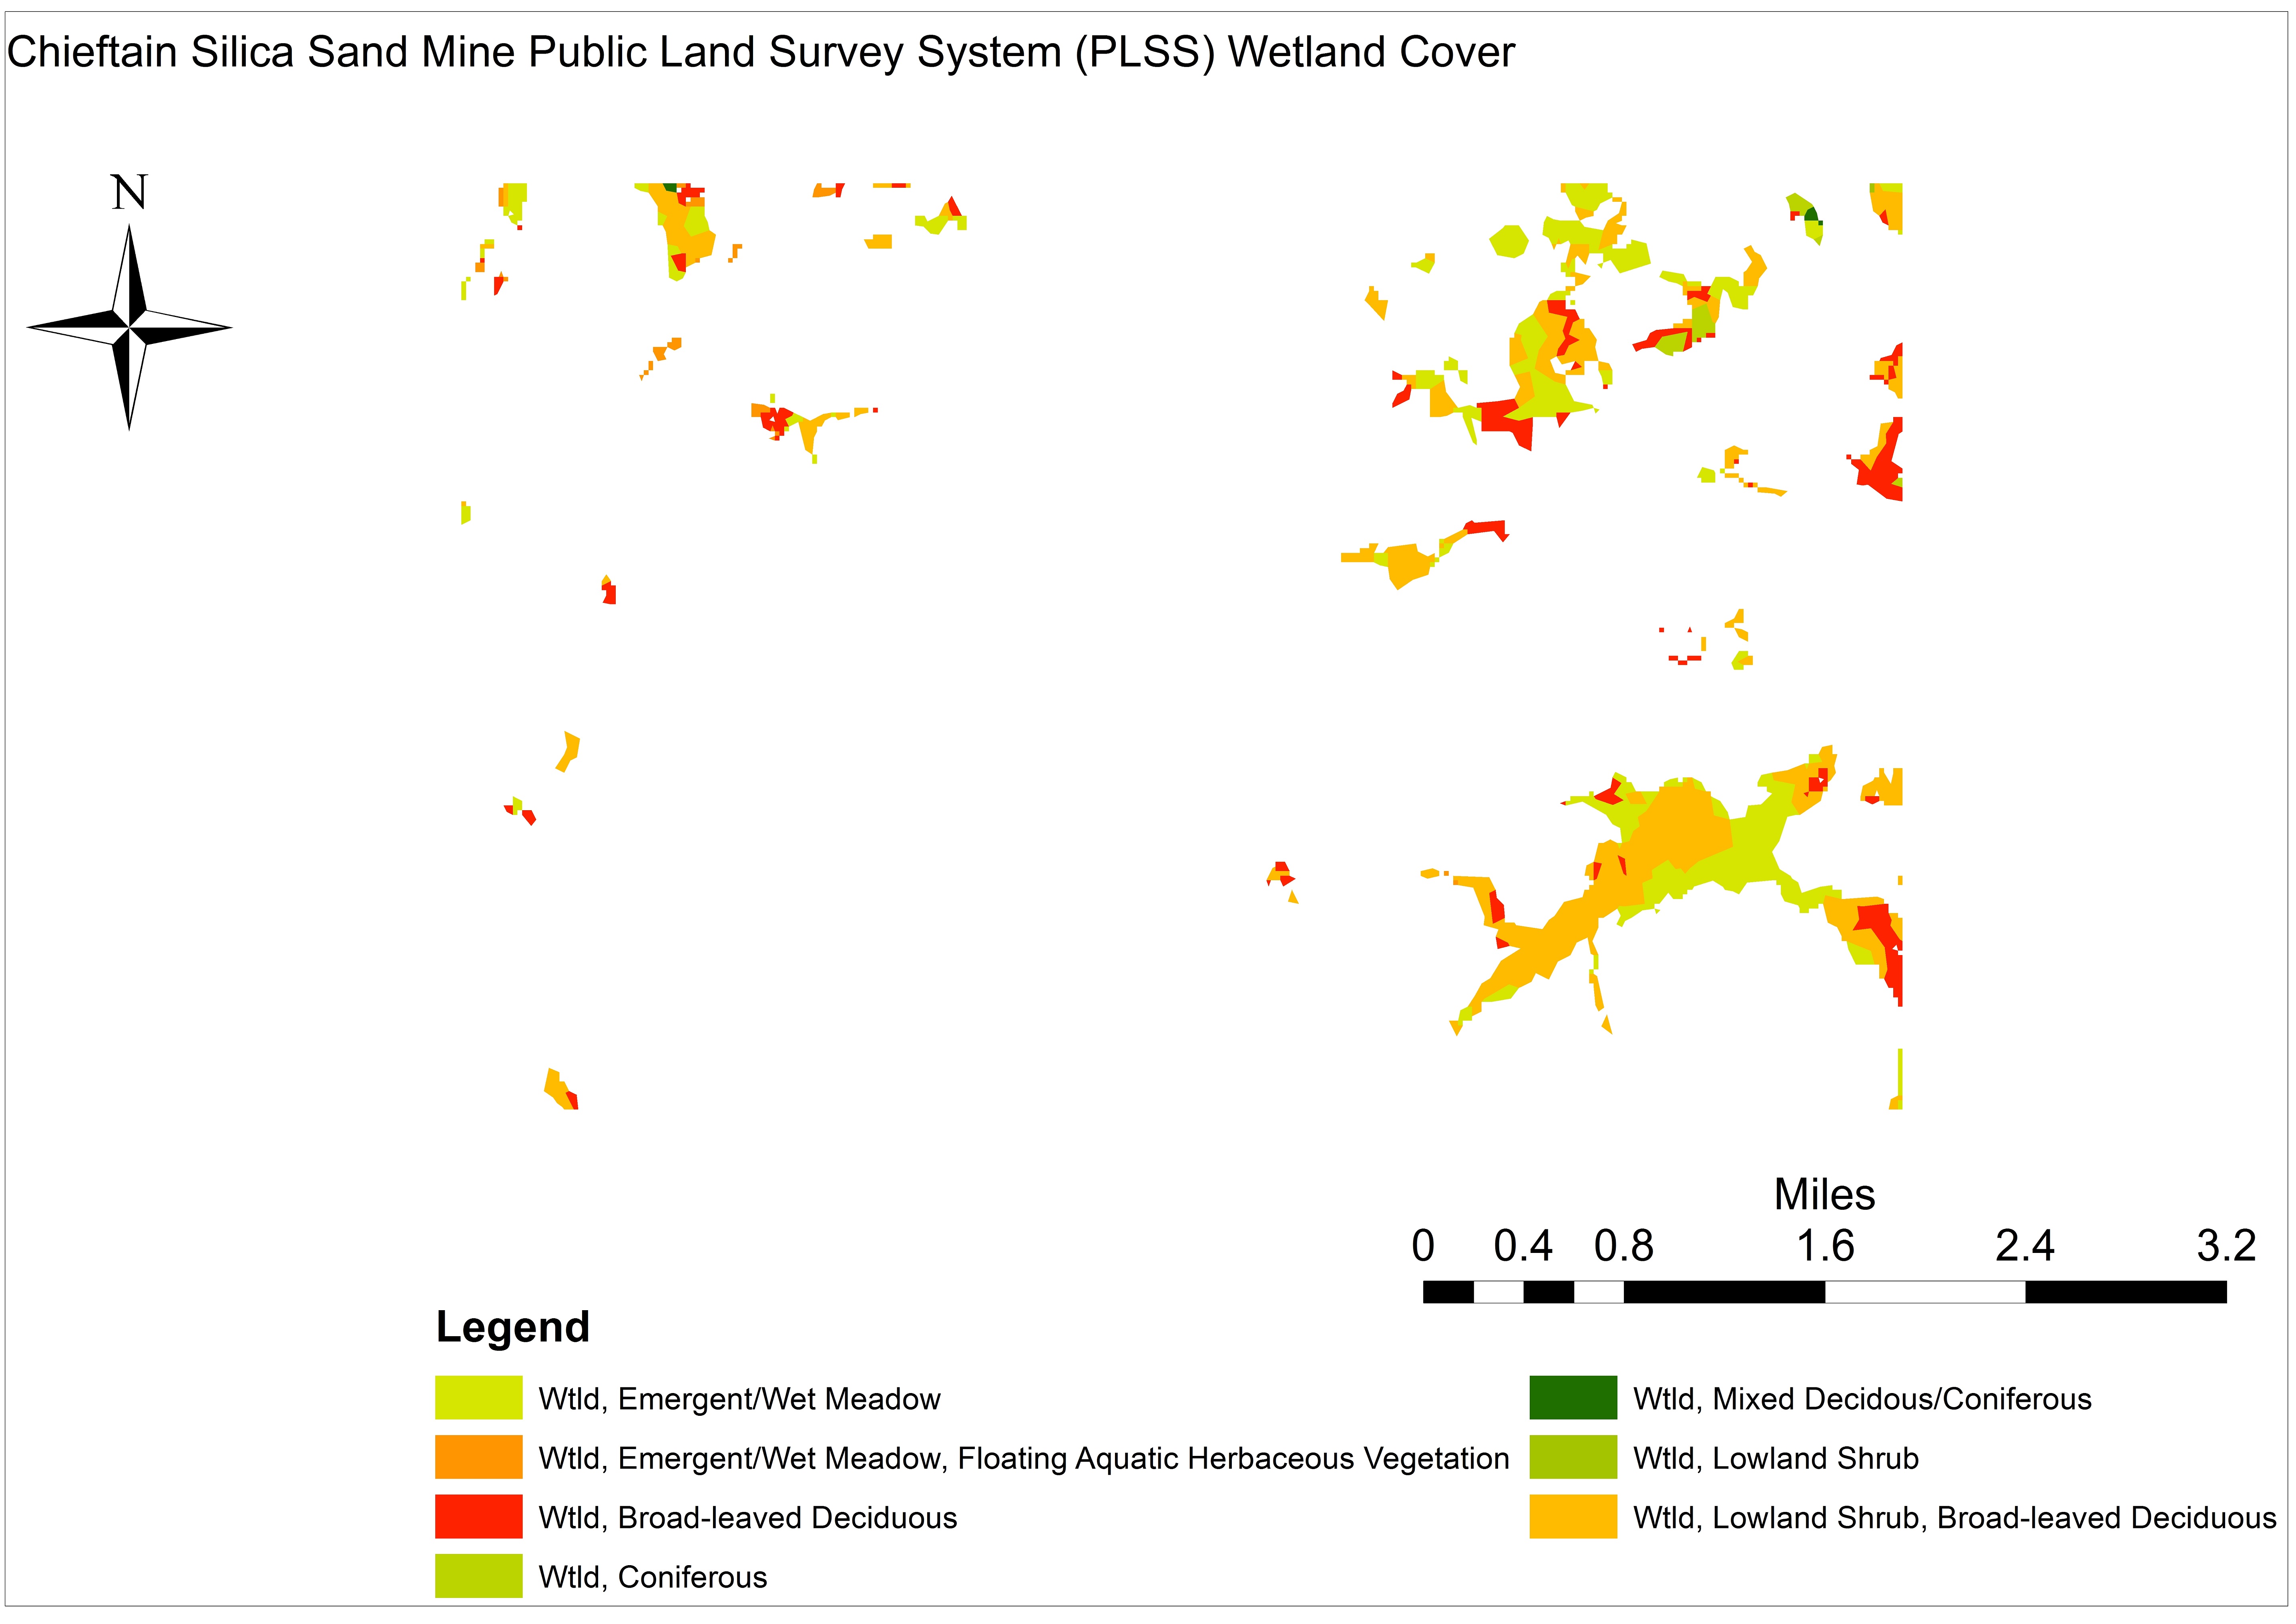
Figure 6. Chieftain silica sand mine proposal’s wetland cover across 5,671 acres in Barron County, WI.
Seven types of forested and shrub-dominated wetlands occupy 101 acres (1.8%) of Chieftain’s PLSS parcels, with an average size of four acres spread across 49 discrete polygons. Wetlands are clustered in three sections of the proposed mining area, with the largest continuous polygons being adjacent 160 acre “Wetland, Lowland Shrub, Broad-leaved Deciduous” and 88 acre “Wetland, Emergent/Wet Meadow” polygons along the area of interest’s eastern edge (See Figure 6 right).
Land Value
In an effort to quantify the value of this aggregation of parcels we calculated annual plant and soil productivity, as well as crop productivity, in terms of tons of carbon and nitrogen3 lost using established WI forest, crop, and freshwater productivity values.4-6
It is worth noting that the following estimates are conservative given that we were not able to determine average above/belowground ecosystem productivity values for the wetland and barren. Additionally, our estimates for crops and grasslands did not include belowground productivity estimates, which likely would increase the following estimates by 20-30%.
1. Forests
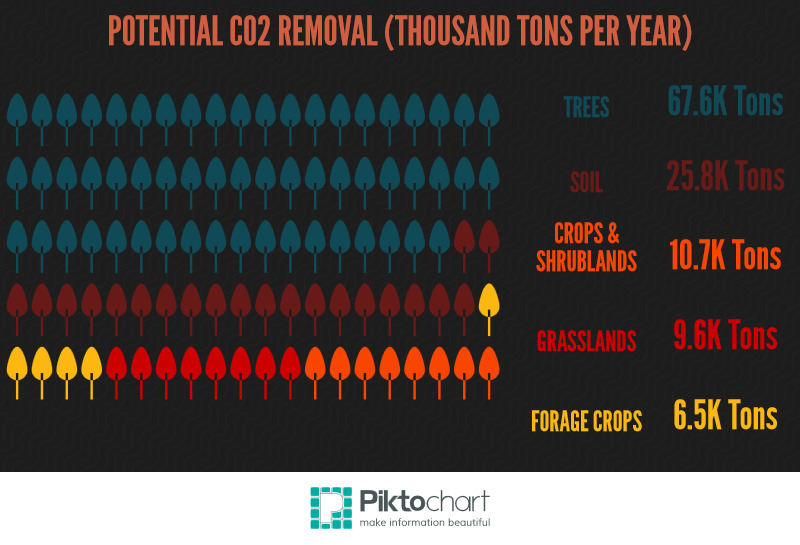
The aforementioned-forested polygons accrue 44,274-90,969 tons of aboveground CO2. This means that if we assume the average forest in this area is 65-85 years old, the Chieftain mine proposal would potentially remove 3.3-6.8 million tons of built up CO2 equivalents. This figure is equal to the per capita CO2 emissions of 202,800-416,700 WI residents. The renewable wood generated on this site has a current market value of $418,516 to $654,125.
If we assume that the price of CO2 is somewhere between $12 and $235 per ton the forested polygons within Chieftain’s proposal currently capture (remove from the atmosphere) $4-17 million worth of CO2 annually.
Additionally, this area generates 23,262-45,447 tons of CO2 via soil processes such as litter decomposition and root production (i.e., 1.8-3.4 million tons over the average 65-85 year lifespan of these forests). The annual value of these belowground processes in terms of soil fertility (i.e., soil organic matter, nitrogen, and phosphorus) is somewhere between $569,962 and $1,029,662 or $43-77 million over the 65-85 year period used in this analysis.
2. Forage Crops and Grasslands
The 1,018 acres of forage crops are currently generating 6,526 CO2 tons per year, which is equivalent to the per capita emissions of 400 WI residents (Note: This carbon has a current value in the range of $417,700-$848,200). The 992 acres of grasslands are capturing 6,600-12,600 tons of CO2 per year and if we assume the average grassland parcel in WI is 5-15 years of age these polygons have captured CO2 equivalent to the per capita emissions of 4,000-7,700 Wisconsinites. Together these two land-cover types capture $840,300-2,518,000 worth of CO2 annually. Again it is worth noting these values do not include any accounting soil processes, which are generally 20-30% of aboveground productivity.
3. Corn, Other Row Crops, Shrublands
The 860 acres of corn, miscellaneous row crops, and shrublands are currently generating 10,450-10,980 CO2 tons per year, which is equivalent to the per capita emissions of 640-670 WI residents. Using the same assumptions about time in grassland (i.e., average Conservation Reserve Program (CRP) tenure) and the 65-85 year assumption used for forests for shrublands we estimate these three land-cover types annually capture CO2 equivalent to the per capita emissions of 8,600-11,030 Wisconsinites. Together these three land-cover types capture $682,420-1,498,030 worth of CO2 annually.
The total average value of commodities produced on the 1,843 acres of cropland is $462 per acre or $851,272 annually.
4. Open Waters
This small fraction of the Chieftain proposal captures 134 tons worth of CO2 annually with a value of $8,590-17,650.
Total Quantifiable Monetary Value
In summary, the nine Chieftain frac sand mines if approved would use land that currently generates $8.77-16.63 million in ecosystem services and commodities per year. Historical and future land-use potential valuations are generally not accounted for in mineral lease agreements. This analysis demonstrates that such values are nontrivial and should at the very least be incorporated into lease agreements, given that post-mining reclamation strategies result in lands that are 40% less productive. If these lands are converted to sand mines, their annual values would drop to $5.0-9.5 million post-development.
Questions about the impact of such operations on LULC in the Mississippi Valley are becoming more and more frequent. For example, families such as the Schultz in Trempealeau County are signing permanent conservation easements. Doing so allows them to continue farming and allocates some acreage to the restoration of oak savanna and dry prairie, considered by the WI Department of Natural Resources (DNR) as “globally imperiled” and “globally rare,” respectively.
References & Footnotes
It is worth noting that Chieftain is taking a huge gamble with this proposal. It stands to reason that such risky ventures are necessary given that the company’s share price has plummeted to $00.15 per share since its IPO days of around $5.50-6.00. These gambles could either catapult Chieftain into the frac sand mining big leagues or relegate it to the bench, however.
We used carbon and nitrogen as their importance from a greenhouse gas (i.e., CO2, CH4, N2O), biogeochemical, and soil fertility perspective is well established.
Burrows, S.N., Gower, S.T., Norman, J.M., Diak, G., Mackay, D.S., Ahl, D.E., Clayton, M.K., 2003. Spatial variability of aboveground net primary production for a forested landscape in northern Wisconsin. Canadian Journal of Forest Research 33, 2007-2018.
Klopatek, J.M., Stearns, F.W., 1978. Primary Productivity of Emergent Macrophytes in a Wisconsin Freshwater Marsh Ecosystem. American Midland Naturalist 100, 320-332.
Scheiner, S.M., Jones, S., 2002. Diversity, productivity and scale in Wisconsin vegetation. Evolutionary Ecology Research 4, 1097-1117.
Part of the FracTracker Truck Counts Project By Mary Ellen Cassidy, Community Outreach Coordinator, FracTracker Alliance
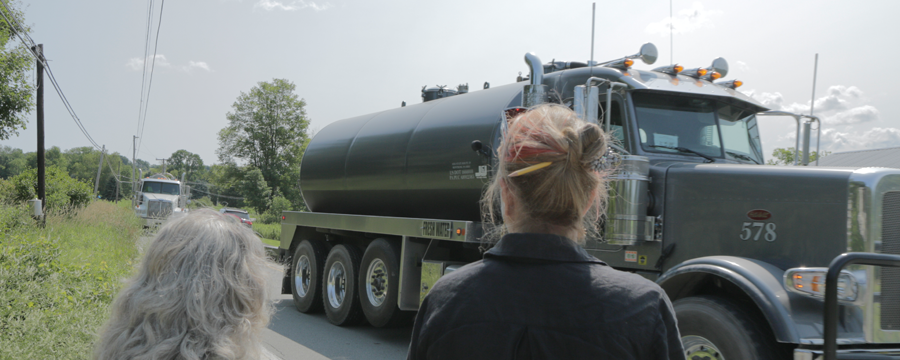
I was recently invited by a community member to visit his home. It sits in a valley that is surrounded by drilling pads, as well as compressors and processing stations. While walking down the road that passes directly in front of his home, several caravans of gas trucks roared past and continued far into the evening. Our discussion about the unexpected barrage of this new invasion of intense truck traffic was frequently interrupted by the noise of the diesel engines passing nearby. Along with the noise, truck headlights pierced through the windows of the home, and dust flew up from the nearby road onto his garden.
There are many stories like this about homes and families impacted by the increased truck traffic associated with fracking-related activities. FracTracker is currently working with some of these communities to document the intensity of gas and oil trucks travelling their roads. In response to these concerns we have a launched a pilot Truck Counts project to provide support, resources, and networking opportunities to communities struggling with high volume gas truck traffic.
Preliminary Results
Volunteers in PA, WV, OH and WI have already started to participate in the project, with some interesting results, photos, observations, and suggestions.
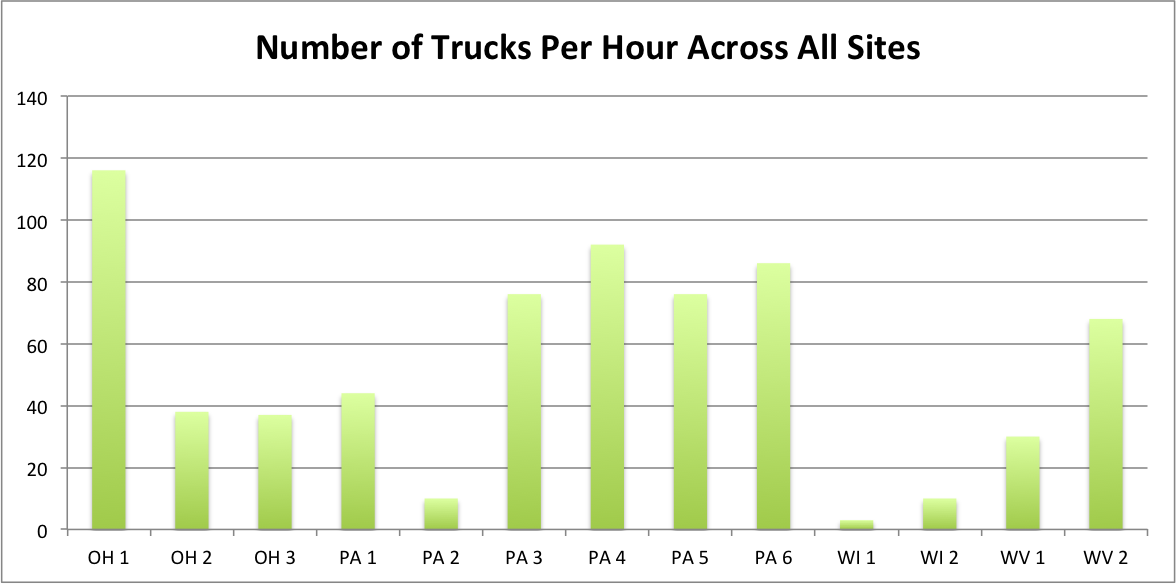
To-date, truck counts have varied significantly, as to be expected. Some of the sites where we chose to count passing trucks were very close to drilling activity, and some were more remote. While developing the counting protocol, we often included large equipment and tanker trucks, as well as gas company personnel vehicles (as indicated by white pickup trucks and company logos on the side). While the data vary, the spikes in truck counts do tell the story of a bigger and broader issue – the influx of heavy equipment during certain stages of drilling can be a significant burden on the local community. In total, we counted 676 trucks over 13 sites The average number of trucks that passed by per hour was 44, with a high of 116 an hour, and a low of 5.
About the Project
FracTracker Truck Counts partners with communities to: help identify issues of concern related to high volume gas truck traffic; collect data, photos, videos and narratives related to gas truck traffic; and analyze and share results through shared database and mapping options.
What motivates volunteers to join us in our Truck Counts program? Community concerns include dust, diesel exhaust, spills, accidents, along with other health and safety issues, as well as the cost and inconvenience of deteriorating road conditions resulting from the increased weights and numbers of vehicles. So, what do we already know about the extent of the damages caused by heavy truck traffic?
Public Safety
Several studies have found that shale gas development is strongly linked to increased traffic accidents and that the increases cannot be attributed only to more trucks and people on the road.
Unlike gas truck traffic issues from past oil and gas booms, this recent shale gas boom impacts traffic and public safety in many different ways. The hydraulic fracturing process requires 2,300 to 4,000 truck trips per well, where older drilling techniques needed one-third to one-half as many trips. Another difference is the speed of development that often far outpaces the capacity of communities to build better roads, bridges, install more traffic signals or hire extra traffic officers. Some experts explain increased truck traffic related accidents by pointing to regulatory loopholes such as federal rules that govern how long truckers can stay on the road being less stringent for drivers in the oil and gas industry. Others note that out of state drivers in charge of large heavy duty loads are not always accustomed to the regional weather patterns or the winding, narrow and hilly country roads that they travel.
An Associated Press analysis of traffic deaths in six drilling states shows that in some counties, fatalities have more than quadrupled since 2004 when most other American roads have become much safer in that period (even with growing populations). Marvin Odum, who runs Royal Dutch Shell’s exploration operations in the Americas, said that deadly crashes are “recognized as one of the key risk areas of the business”. Along with the community, gas truck drivers themselves are at risk. According to a study by the National Institute for Occupational Safety and Health, vehicle crashes are the single biggest cause of fatalities to oil and gas workers. The AP study finds that:
In North Dakota drilling counties, the population has soared 43% over the last decade, while traffic fatalities increased 350%. Roads in those counties were nearly twice as deadly per mile driven than the rest of the state
From 2009-2013-
Traffic fatalities in West Virginia’s most heavily drilled counties…rose 42%. Traffic deaths in the rest of the state declined 8%.
In 21 Texas counties where drilling has recently expanded, deaths/100,000 people are up an average of 18 % while for the rest of Texas, they are down by 20%.
Traffic fatalities in Pennsylvania drilling counties rose 4%, while in the rest of the state they fell 19 %.
New Mexico’s traffic fatalities fell 29%, except in drilling counties, where they only fell 5%.
A separate analysis by Environment America using data from the Upper Great Plans Institute finds that – “While the expanding oil industry in North Dakota has produced many benefits, the expansion has also resulted in an increase in traffic, especially heavy truck traffic. This traffic has contributed to a number of crashes, some of which have resulted in serious injuries and fatalities.” In the Bakken Shale oil region of North Dakota, the number of highway crashes increased by 68% between 2006 and 2010, with the share of crashes involving heavy trucks also increasing over that period.”1
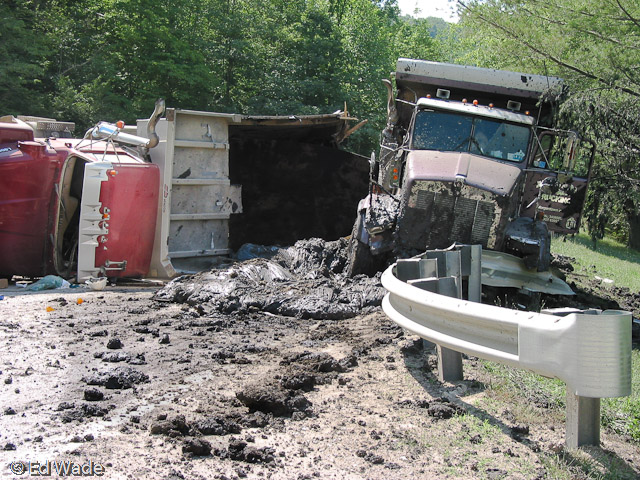
Truck accident and spill in WV. Wetzel County Action Group photo, copyright of Ed Wade, Jr.
Public health concerns do not end with traffic accidents and fatalities. An additional cost of heavy gas truck traffic is the strain it places on emergency service personnel. A 2011 survey by State Impact Pennsylvania in eight counties found that:
Emergency services in heavily drilled counties face a troubling paradox: Even though their population has fallen in recent years, 911 call activity has spiked — by as high as 46 percent, in one case.” Along with the demands placed on emergency responders from the number of increased calls, it also takes extra time to locate the accidents since many calls are coming from transient drivers who “don’t know which road or township they are in.
In Bradford County, a heavily drilled area, increased traffic has delayed the response times of emergency vehicles. According to an article in The Daily Review, firefighters and emergency response teams are delayed due to the increased number of accidents, gas trucks breaking down, and gas trucks running out of fuel (some companies only allow refueling once a night).
Road Deterioration and Regional Costs
Roadway degradation from truck traffic. Wetzel County Action Group photo, copyright of Ed Wade, Jr.
An additional cost often passed on to the impacted communities is infrastructure maintenance. In an article from Business Week, Lynne Irwin, director of Cornell University’s local roads program in Ithaca, New York, states, “Measures to ensure that roads are repaired don’t capture the full cost of damage, potentially leaving taxpayers with the bill.”
This Food and Water Watch Report calculated the financial burden imposed on rural counties by traffic accidents alone, estimating that if the heavy truck accident rate in fracked counties had matched those untouched by the boom, $28 million would have been saved.2
Garrett County is currently struggling with anticipating potential gas traffic and road costs. The Garrett County Shale Gas Advisory Committee uses recent studies from RESI ‘s New York and Pennsylvania data to project gas truck traffic for 6 wells/pad at 22,848 trips/pad and 91,392 total truck trips the first year with increasing numbers for the next 10 years. Like many counties, Garrett County also faces the issue that weights and road use are covered by State, not County code. There is a possibility, however, that the County could determine best “routes” for the trucks. (This is a prime example of the need and benefit for truck counts.)
Although truck companies and contractors pay permit fees, often they are either insufficient to cover costs or are not accessible to impacted counties. The Texas Tribune reports, “The Senate unanimously passed a joint resolution which would ask voters to approve spending $5.7 billion from the state’s Rainy Day Fund, including $2.9 billion for transportation debt. But little, if any, of that money is likely to go toward repairing roads in areas hit hardest by the drilling boom.”
Commenting on the argument that gas companies already pay their fair share for road damages they cause, George Neal posts calculations on the Damascus Citizens for Sustainability website that lead him to conclude that, although “the average truck pays around 27 times the fuel taxes an average car pays… according to the Texas Department of Transportation, they do 8,000 times the damage per mile driven and drive 8 times as far each year.”
The funds needed to fill the gap between the costs of road repairs and the amount actually paid by the oil and gas companies must come from somewhere. According to a draft report from the New York Department of Transportation looking at potential Marcellus Shale development costs, “The annual costs to undertake these transportation projects are estimated to range from $90 to $156 million for State roads and from $121-$222 million for local roads. There is no mechanism in place allowing State and local governments to absorb these additional transportation costs without major impacts to other programs and other municipalities in the State.”
Poor Air Quality
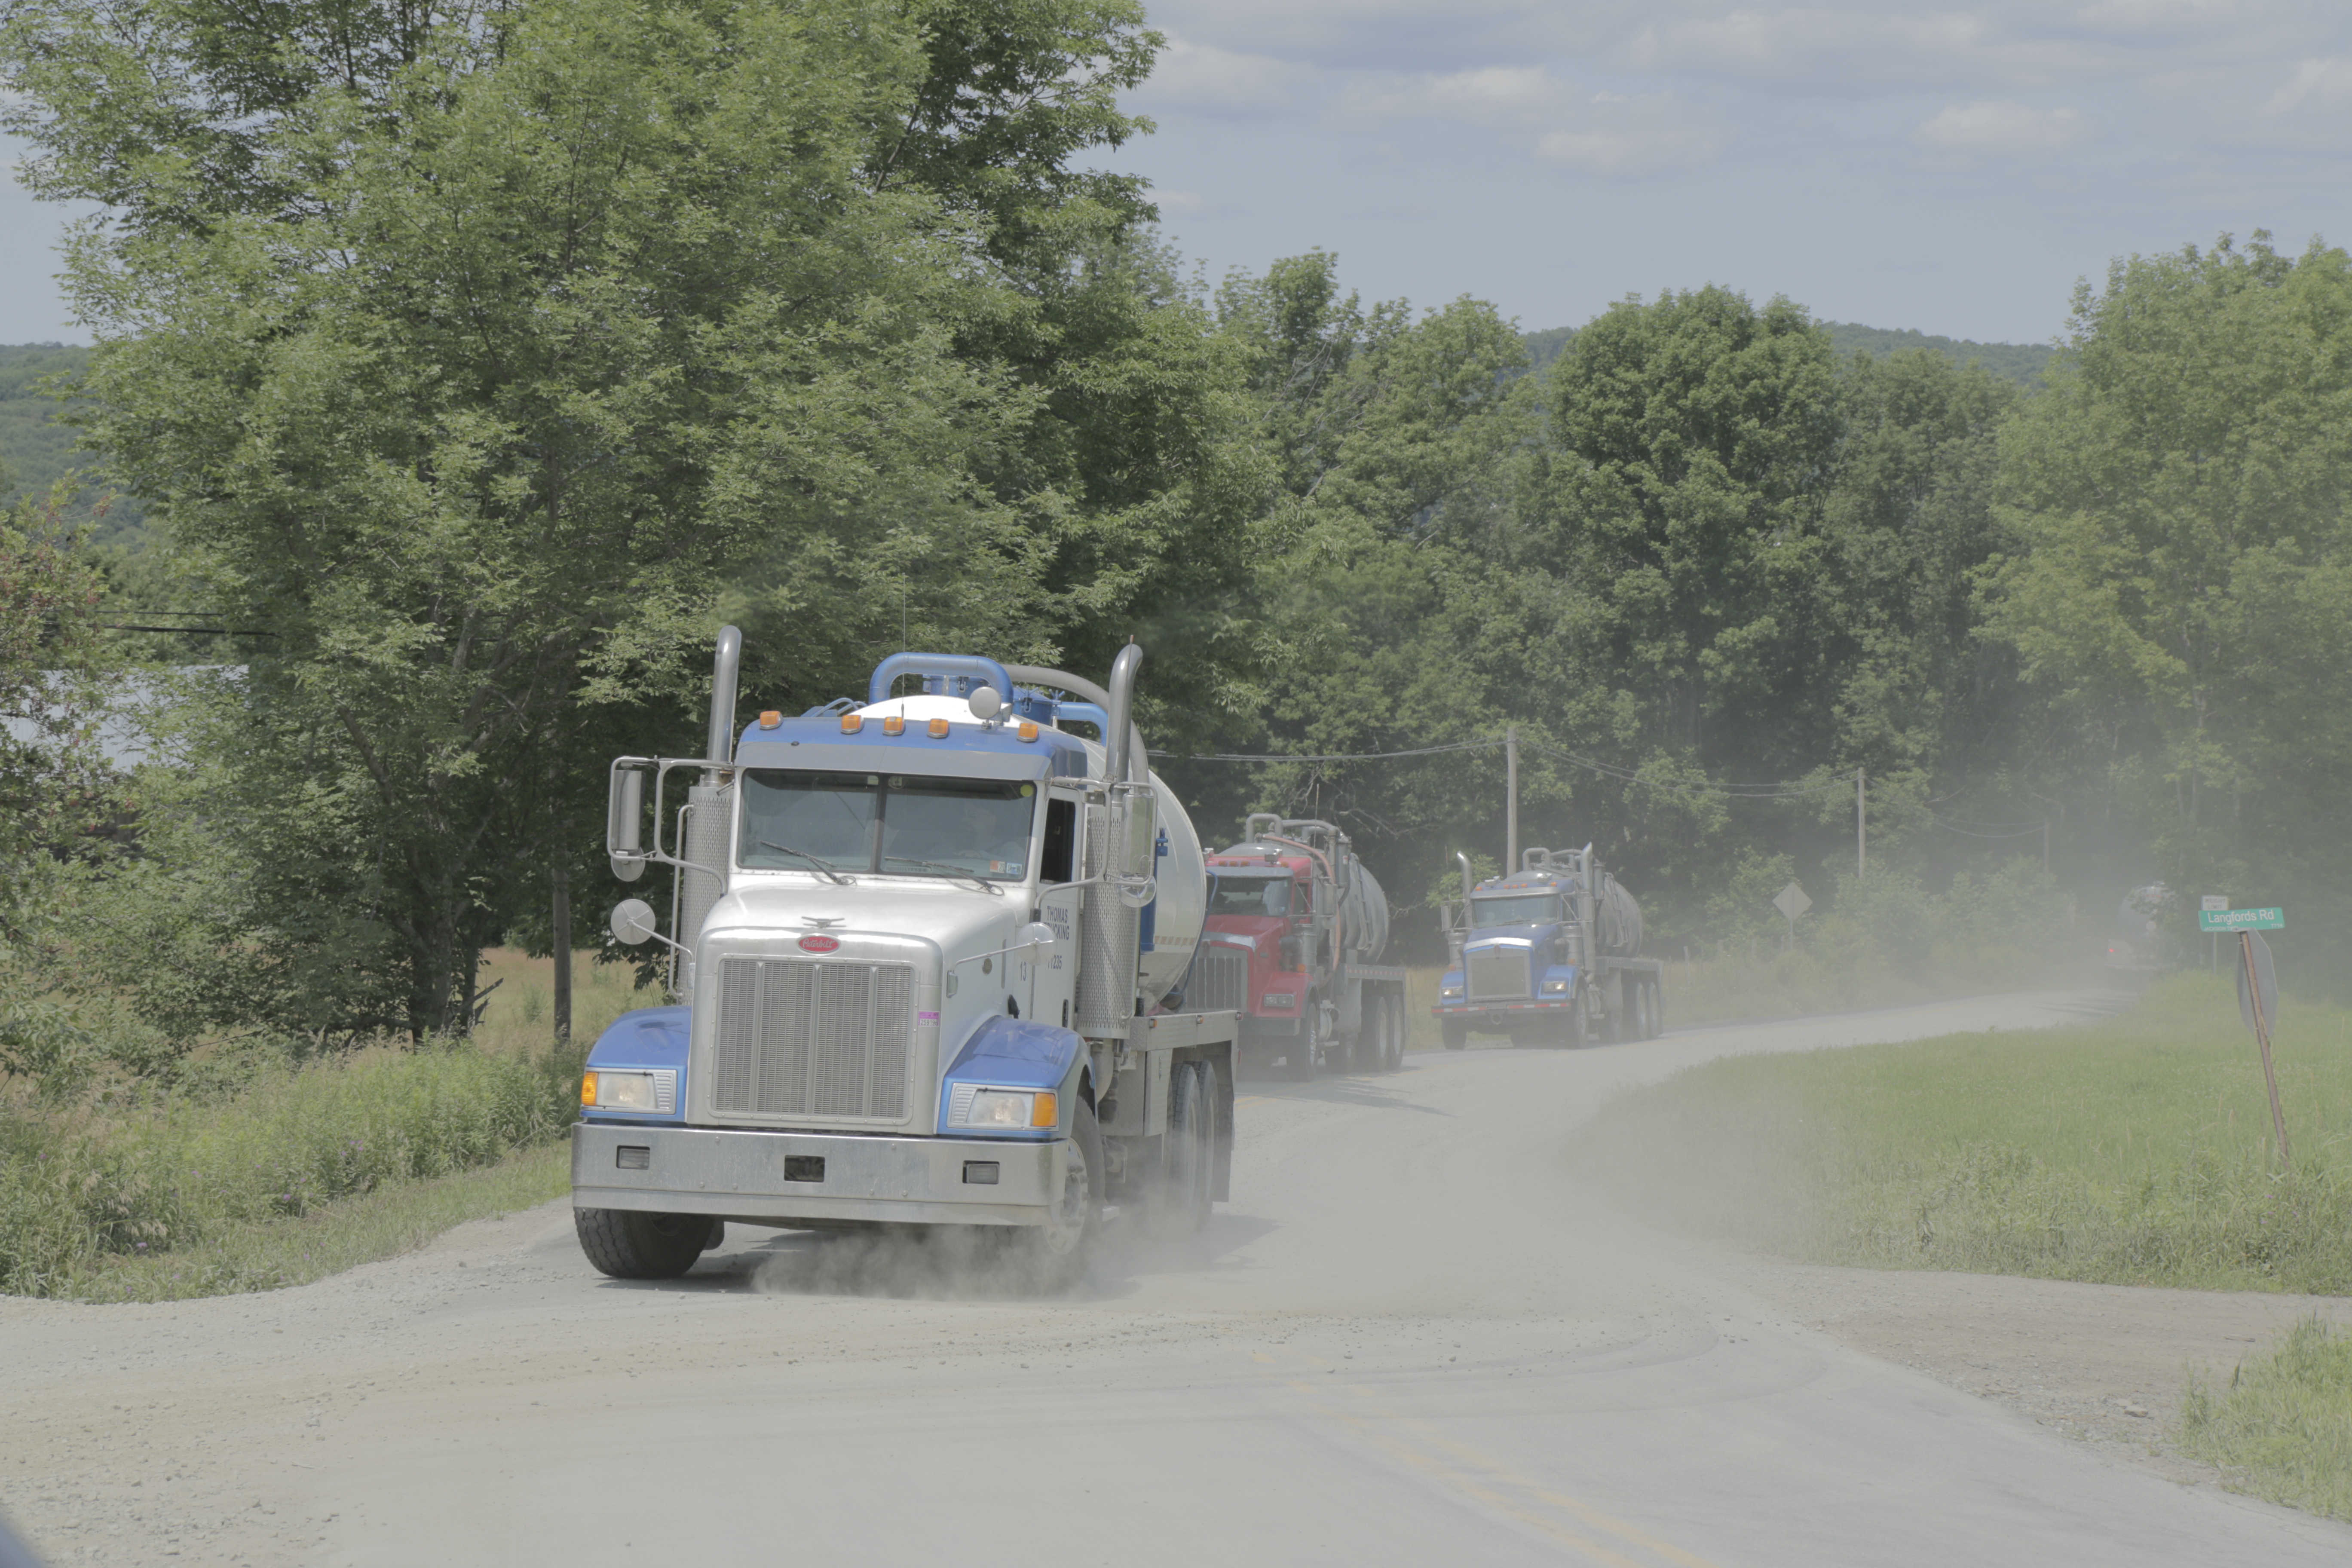
Caravan of trucks. Photo by Savanna Lenker, 2014.
Along with public safety and infrastructure costs, increased truck traffic associated with unconventional oil and gas extraction is found to be a major contributor to public health costs due to elevated ozone and particulate matter levels from increased emissions of heavy truck traffic and the refining and processing activities required.
In addition to ozone and particulate matter in the air, chemicals used for extraction and development also pose a serious risk. A recent study in the journal of Human and Ecological Health Assessment found that 37% of the chemicals used in drilling operations are volatile and could become airborne. Of those chemicals, more than 89% can cause damage to the eyes, skin, sensory, organs, respiratory and gastrointestinal tracts, or the liver, and 81% can cause harm to the brain and nervous system. Because these chemicals can vaporize, they can enter the body not only through inhalation, but also absorption through the skin.
The Union of Concerned Scientists note that air pollution from traffic may be worsened in North Dakota by the use of unpaved roads that incorporate gravel containing a fibrous mineral called erionite, which has properties similar to asbestos. Trucks driving over such gravel roads can release harmful dust plumes into the air, which could present health risks for workers and area residents
To address and solve these problems associated with heavy truck traffic, information is needed to assess both qualitatively and quantitatively the scope of the increased truck traffic and its impacts on communities. Collection and analysis of data, as well as community input, are needed to both understand the scope of the problem and to inform effective solutions.
Joining FracTracker’s Truck Counts
In response to community concerns about the impacts of increased truck traffic in their community, FracTracker has developed the Truck Count project to document the intensity of oil and gas traffic in your region, map heavy traffic locations, and offer networking opportunities for impacted communities.
Participation in FracTracker’s Truck Counts can provide grassroots organizations with a valuable opportunity to collect local data, engage volunteers, and educate stakeholders and the public. The data, pictures and narratives collected can be used to support concerned citizens’ efforts to reroute traffic from schools, playgrounds and other sensitive areas; to inform decision makers, public health researchers, and transportation agencies; to serve as a potential launching point for more detailed, targeted studies on public health and safety along with economic development analyses; to compare costs and benefits of oil and gas energy sources to the cost and benefits of energy conservation, efficiency and renewable energy.
Also, by sharing your community’s counts and stories on FracTracker.org, you serve other communities by increasing the awareness of the impacts of oil and gas truck traffic nationwide.
FracTracker’s Truck Counts provides the following resources to conduct the counts:
information and education on gas and oil truck identification,
data sheets for easy counting, and
tips for selecting safe and accessible counting locations in your community.
We look forward to working with you and supporting your community. If you are interested in working on this important crowdsourcing project with us, please contact:
In addition, a 2013 study from Resources for the Future found that shale gas development is linked to traffic accidents in Pennsylvania with a significant increase in the number of total accidents and accidents involving a heavy truck in counties with a relatively large degree of shale gas development as compared to counties with less (or no) development.
The 2013 Food and Water Watch Report finds similar correlations. Shale gas drilling was associated with higher incidents of traffic accidents in Pennsylvania. This trend was strongest in counties with the highest density of fracking wells. The decrease in the average annual number of total vehicle crashes was 39% larger in unfracked rural counties than in heavily fracked counties. (analysis based on data from US Census Bureau, PA DEP and PennDOT).
In a recent Karnes County, Texas analysis “Traffic accidents and fatalities have skyrocketed in the shale boom areas….with an increases of 1,000% in commercial motor vehicle accidents from 2008-2011.
According to a 2013 Texas Public Threat Safety Report, “In the three Eagle Ford Shale counties where drilling is most active, the number of crashes involving commercial vehicles rose 470 percent between 2009 and 2011. In the 17 counties that make up the Permian Basin, fatal car crashes involving commercial vehicles have nearly tripled from 14 in 2010 to 41 in 2012.
As a result of heavily using of publicly available infrastructure and services, fracking imposes both immediate and long-term costs on taxpayers. An Environment Texas study reveals that, “Trucks required to deliver water to a single fracking well cause as much damage to roads as 3.5 million car journeys, putting massive stress on roadways and bridges not constructed to handle such volumes of heavy traffic. Pennsylvania estimates that repairing roads affected by Marcellus Shale drilling would cost $265 million”.
Researchers from the RAND Corporation and Carnegie Mellon University looked at the design life and reconstruction cost of roadways in the Marcellus Shale formation in Pennsylvania. Their findings in Estimating the Consumptive Use Costs of Shale Natural Gas Extraction on Pennsylvania Roadways, note that local roads are generally designed to support passenger vehicles, not heavy trucks, and that “the useful life of a roadway is directly related to the frequency and weight of truck traffic using the roadway.” The study’s findings include:
“The estimated road-reconstruction costs associated with a single horizontal well range from $13,000 to $23,000. However, Pennsylvania often negotiates with drilling companies to rebuild smaller roads that are visibly damaged, so the researchers’ conservative estimate of uncompensated roadway damage is $5,000 and $10,000 per well.
While the per-well figure of $5,000-$10,000 appears small, the increasingly large number of wells being drilled means that substantial costs fall on the state: “Because there were more than 1,700 horizontal wells drilled [in Pennsylvania] in 2011, the statewide range of consumptive road costs for that year was between $8.5 and $39 million,” costs paid by state transportation authorities, and thus taxpayers.”
The feature photo at the top of the page was taken by Savanna Lenker, 2014.
https://www.fractracker.org/a5ej20sjfwe/wp-content/uploads/2014/09/TruckCounts.png400900FracTracker Alliancehttps://www.fractracker.org/a5ej20sjfwe/wp-content/uploads/2021/04/2021-FracTracker-logo-horizontal.pngFracTracker Alliance2014-09-11 15:18:072020-07-21 10:42:44Here They Come Again! The Impacts of Oil and Gas Truck Traffic
Pattern, Process, Quality, Quantity, and US Frac Sands By Ted Auch, OH Program Coordinator, FracTracker Alliance;
Daniel Berghoff, The Ohio State University; Elliott Kurtz, Intern, FracTracker Alliance
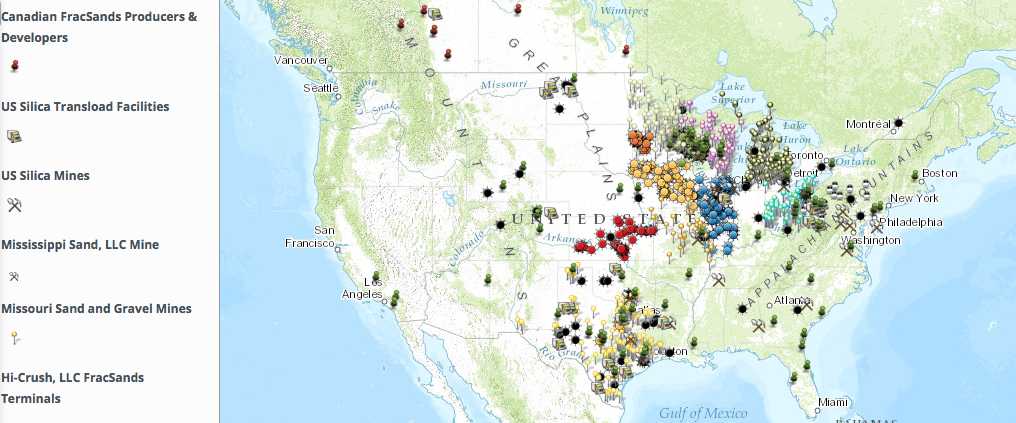
Part I, Frac Sands Locations and Silica Geology Map Description
Click on the arrows in the upper right hand corner of the map for a fullscreen view and to access the legend.
This is a map of silica sands/frac sands mines, drying facilities, and value added facilities in North America. The map includes addresses and facility polygons. We present production for only 24 of these facilities all of which are in Wisconsin. The remaining Wisconsin and other state facilities do not have production or acreage data associated with them pursuant to a lack of disclosure requirements at the state level and USGS’s confidentiality agreement with all firms. The sandstone/silica geology polygons presented herein – in certain instances – include a breakdown of each polygon’s land cover distribution across agriculture, urban/suburban, temperate deciduous forest, and conifer forests. At the present time we only have this type of delineation for the primary frac sands producing US state, Wisconsin, along with Ohio, with Minnesota soon to arrive. The identification of each polygon’s land cover gives a sense for the types of ecosystem services present and/or threatened from a macro perspective. During our tour of select West Central Wisconsin frac sand mines it became apparent that the mining industry was essentially picking off forested “bluffs” or drumlins because these are generally the areas where frac sand deposits are deepest and closest to the surface. In return landowners are returned these parcels with less dramatic slopes making them more amenable to grazing or crop production. Consequently understanding the current land cover of each sandstone polygon will give us a sense for how much forest, grasslands, or wetlands acreage could potentially be converted to traditional agricultural usage.
Industry data was provided by or sourced from the following organizations, individuals, or websites:
Illinois – Michael D. Falter, Supervisor of Operations, Illinois Department of Natural Resources, Office of Mines and Minerals, Mine Safety and Training Division, Blasting and Explosives Unit (217)782-9976
Minnesota – Proposed mines Johanna Rupprecht, Policy Organizer, Land Stewardship Project, Lewiston, MN, 507-523-3366, jrupprecht@landstewardshipproject.org; current mines Minnesota Public Radio intern Frank Bi; Minnesota Geological Survey.
Wisconsin – Jing Duan and Jay Tappan at the West Central Wisconsin Regional Planning Commission (WCWRPC).
Iowa – Pattison Silica Sand Frac sands complex courtesy of Ted Auch at FracTracker and Daniel Berghoff our OSU Intern
Texas – US Silica Kosse facility, remaining facilities geocoded from Manta. (Note: We are in the process of constructing polygons for these facilities and will have these within this map by later in 2013)
US Industry Participants – This is a collection of major/minor expanding and developing producers, recent/new North American frac sand producers, and North American frac sand developers. Much of these firms were identified via Industrial Minerals Editor Mike O’Driscoll’s via Frac Sand Frenzy presentation (PDF) at Silica Arabia, March 12-14, 2012, pages 45-47. Links to data sources are below. See here (PDF) for detailed descriptions of 34 US and 4 Canadian firms:
Canada Industry Participants – This is a collection of major/minor expanding and developing producers, recent/new North American frac sand producers, and North American frac sand developers. Much of these firms were identified via Industrial Minerals Editor Mike O’Driscoll’s via Frac Sand Frenzy presentation (PDF) at Silica Arabia, March 12-14, 2012, pages 45-47. Links to data sources are below:
US Silica – Data was extracted from company’s locations tab (http://www.ussilica.com/locations). US Silica facility types are as follows by address and type here (PDF). See detailed US Silica Address and Type description here):
Methodology
Land Cover Data Methodology:
State Level Primary and Secondary Silica Sand Geology – polygons extracted from USGS Mineral Resources > Online Spatial Data > Geology. Primary and secondary polygons are dissolved by Unit Age.Land cover in km2 and as a % of the entire polygon are presented using the following:
“Select By Attributes” tool in ArcMAP
_geol_poly_dd
“ROCKTYPE1” = Primary; “ROCKTYPE1” = Secondary
Using the following protocol we have begun to code each Silica Sand Geology polygon for land cover in terms of km^2 and % of polygons. The protocol fractionates polygons into forest, crop, pasture, urban, and wetlands:Used zonal statistics, which is in the spatial analyst toolbox in ArcGIS.
Before recoding the raster, it may be easier to manage after clipping it to a smaller extent such as the state you are interested in. Simply use Arc’s Clip tool to do this. I also found that QGIS has a fast, easy, clipping tool called Clipper. Once the raster is a bit more manageable, use the legend for the dataset that is on the above webpage to recode the raster into a set of rasters for each land cover type you’re interested in. Use Arc’s Reclassify to set all the values you want to 1 and all other values to 0. This process can also be done in QGIS which I found to be easier and faster. For QGIS, use Raster Calculator and create an expression that connects all the rasters of interest with “OR.” The syntax should be something along the lines of: ([name of raster @ band1] = first forest value) OR ([name of raster @ band1] = second forest value) and so on for all your values.
Use the zonal statistics tool in Arc (Zonal Statistics as Table) to get the sum (it is important that is the sum) of the new binary raster for each polygon for each shapefile you’re using. The tool used should export a table of values.
Add the table that the zonal statistics tool outputs and then join it to the shapefile you used to generate it.
Repeat steps 3 and 4 for the other raster layers you generated with reclassify.
Export the shapefile with the joined data.
Put the shapefile back in Arc and open the attribute table.
Add a new column.
Use field calculator to calculate this column as 900 times the sum you got from your first zonal statistics run (because the data are in 30mX30m resolution, this will give you a good approximation of the square meters of land cover affected).
Repeat steps 8 and 9 for your other zonal statistics results.
Repeat step 2 for other raster classes you are interested in (developed, cultivated, wetland, etc.).
Repeat steps 3-10 for the other shapefiles you are using.
https://www.fractracker.org/a5ej20sjfwe/wp-content/uploads/2013/12/Screen-Shot-2013-12-03-at-12.51.06-PM.png6041016Ted Auch, PhDhttps://www.fractracker.org/a5ej20sjfwe/wp-content/uploads/2021/04/2021-FracTracker-logo-horizontal.pngTed Auch, PhD2013-12-02 13:58:362020-07-21 10:41:37Frac Sands Mines and Related Facilities
This post has been archived. It is provided here for informational purposes only.
By Brook Lenker and Ted Auch, FracTracker Alliance
Thirty miles northwest of Eau Claire, Wisconsin the land rolls gently. Wooded hills back orderly farms straight from the world of Norman Rockwell but painted red and gold by October’s cool brush. It seems like agrarian perfection, but the harmony is interrupted by the pits and mounds of a newcomer to America’s Dairyland – sand extraction to support hydraulic fracturing for the oil and natural gas industry.
“Mine, Baby, Mine” reads a bumper sticker on a pickup outside the Baron drying plant of Superior Silica Sands – a frac sand company headquartered in Fort Worth, Texas but with significant activities located in Wisconsin. Ted Auch, Ohio Program Coordinator for FracTracker, and I are on a daylong sand mining tour organized by the West Central Wisconsin Regional Planning Commission (WCWRPC). This, the second Superior drying plant we visited, processes up to 2.4 million tons of sand per year (enough sand to complete 800 typical horizontal gas or oil wells). This is among the largest facilities of its kind in the world.
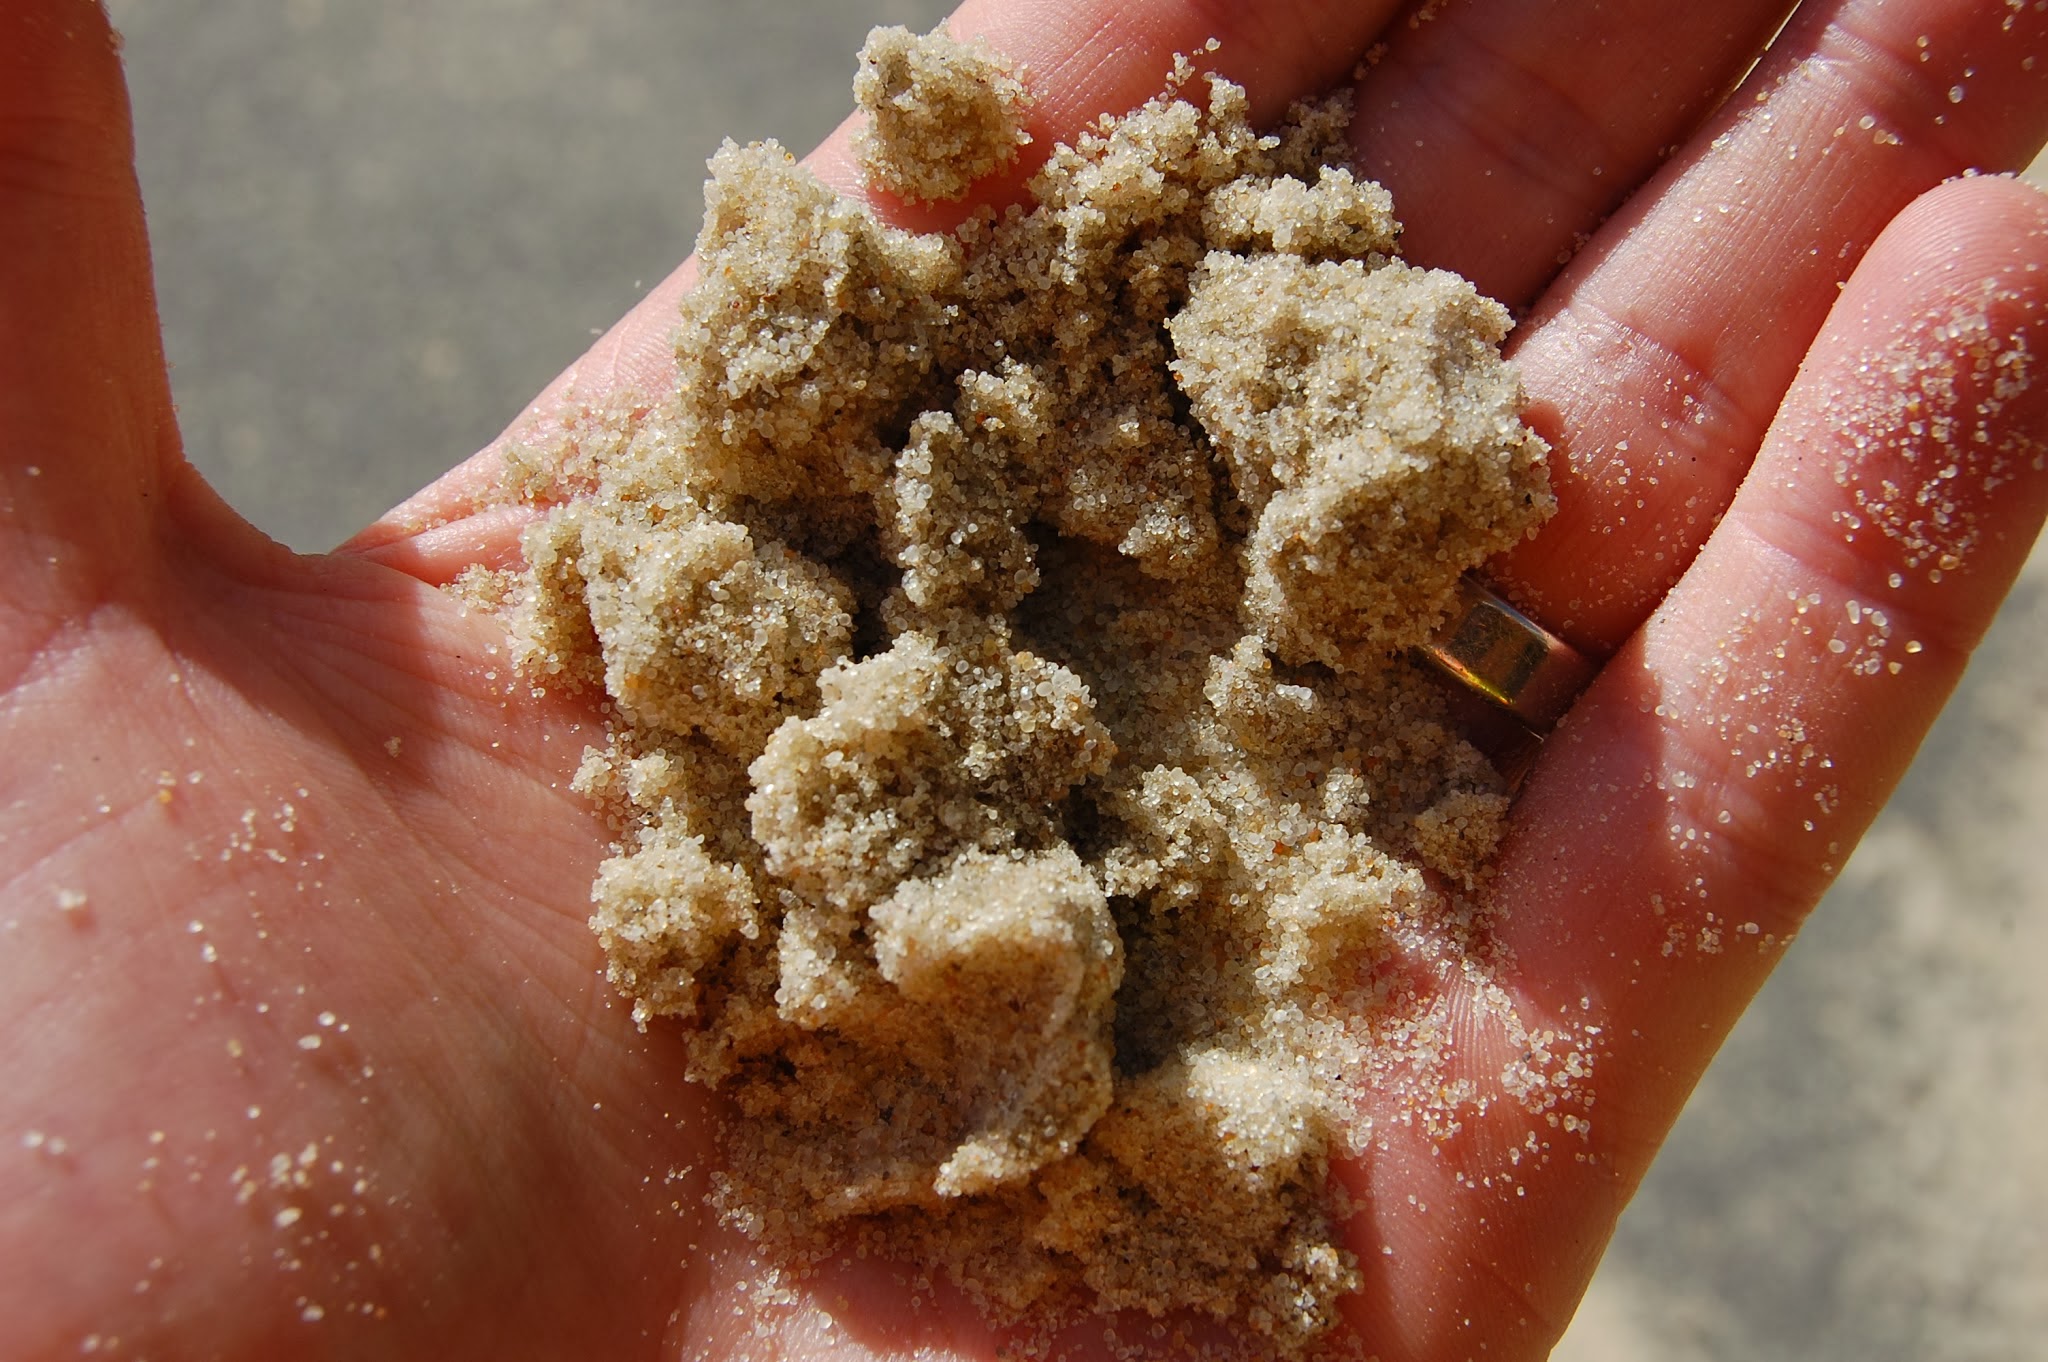
What is frac sand?
Frac sands (99% silicon dioxide – SiO2) are meant to “prop” open the rock after fracturing is complete, termed “proppants.” Aside from water, these sands represent the second largest constituent pumped into a typical well to hydraulically fracture the shale. Usage of frac sand as a proppant is increasing due to the rising costs associated with synthetic substitutes like ceramic and related resin-coated materials. Ideally, such sand must be uniformly fine and spherical, crush-resistant, acid soluble, mature, and clay/silt-free. The northern Great Lakes Basin represents the primary stock for high quality frac sand in the world – causing many industry analysts to label the region Sand Arabia.
And where does it come from?
Most of Superior’s total production (4.2 million tons per year) comes from mines in New Auburn and Clinton, Wisconsin – in the middle of the St. Peter (Ottawa) Sandstone. This formation underlies parts of Iowa, Wisconsin, Minnesota, Illinois and Missouri. Known for its uniform and rounded grains – the region has recently surpassed the Hickory (Brady) formation in Texas, which contains sands that are far more angular, blocky and coarse.
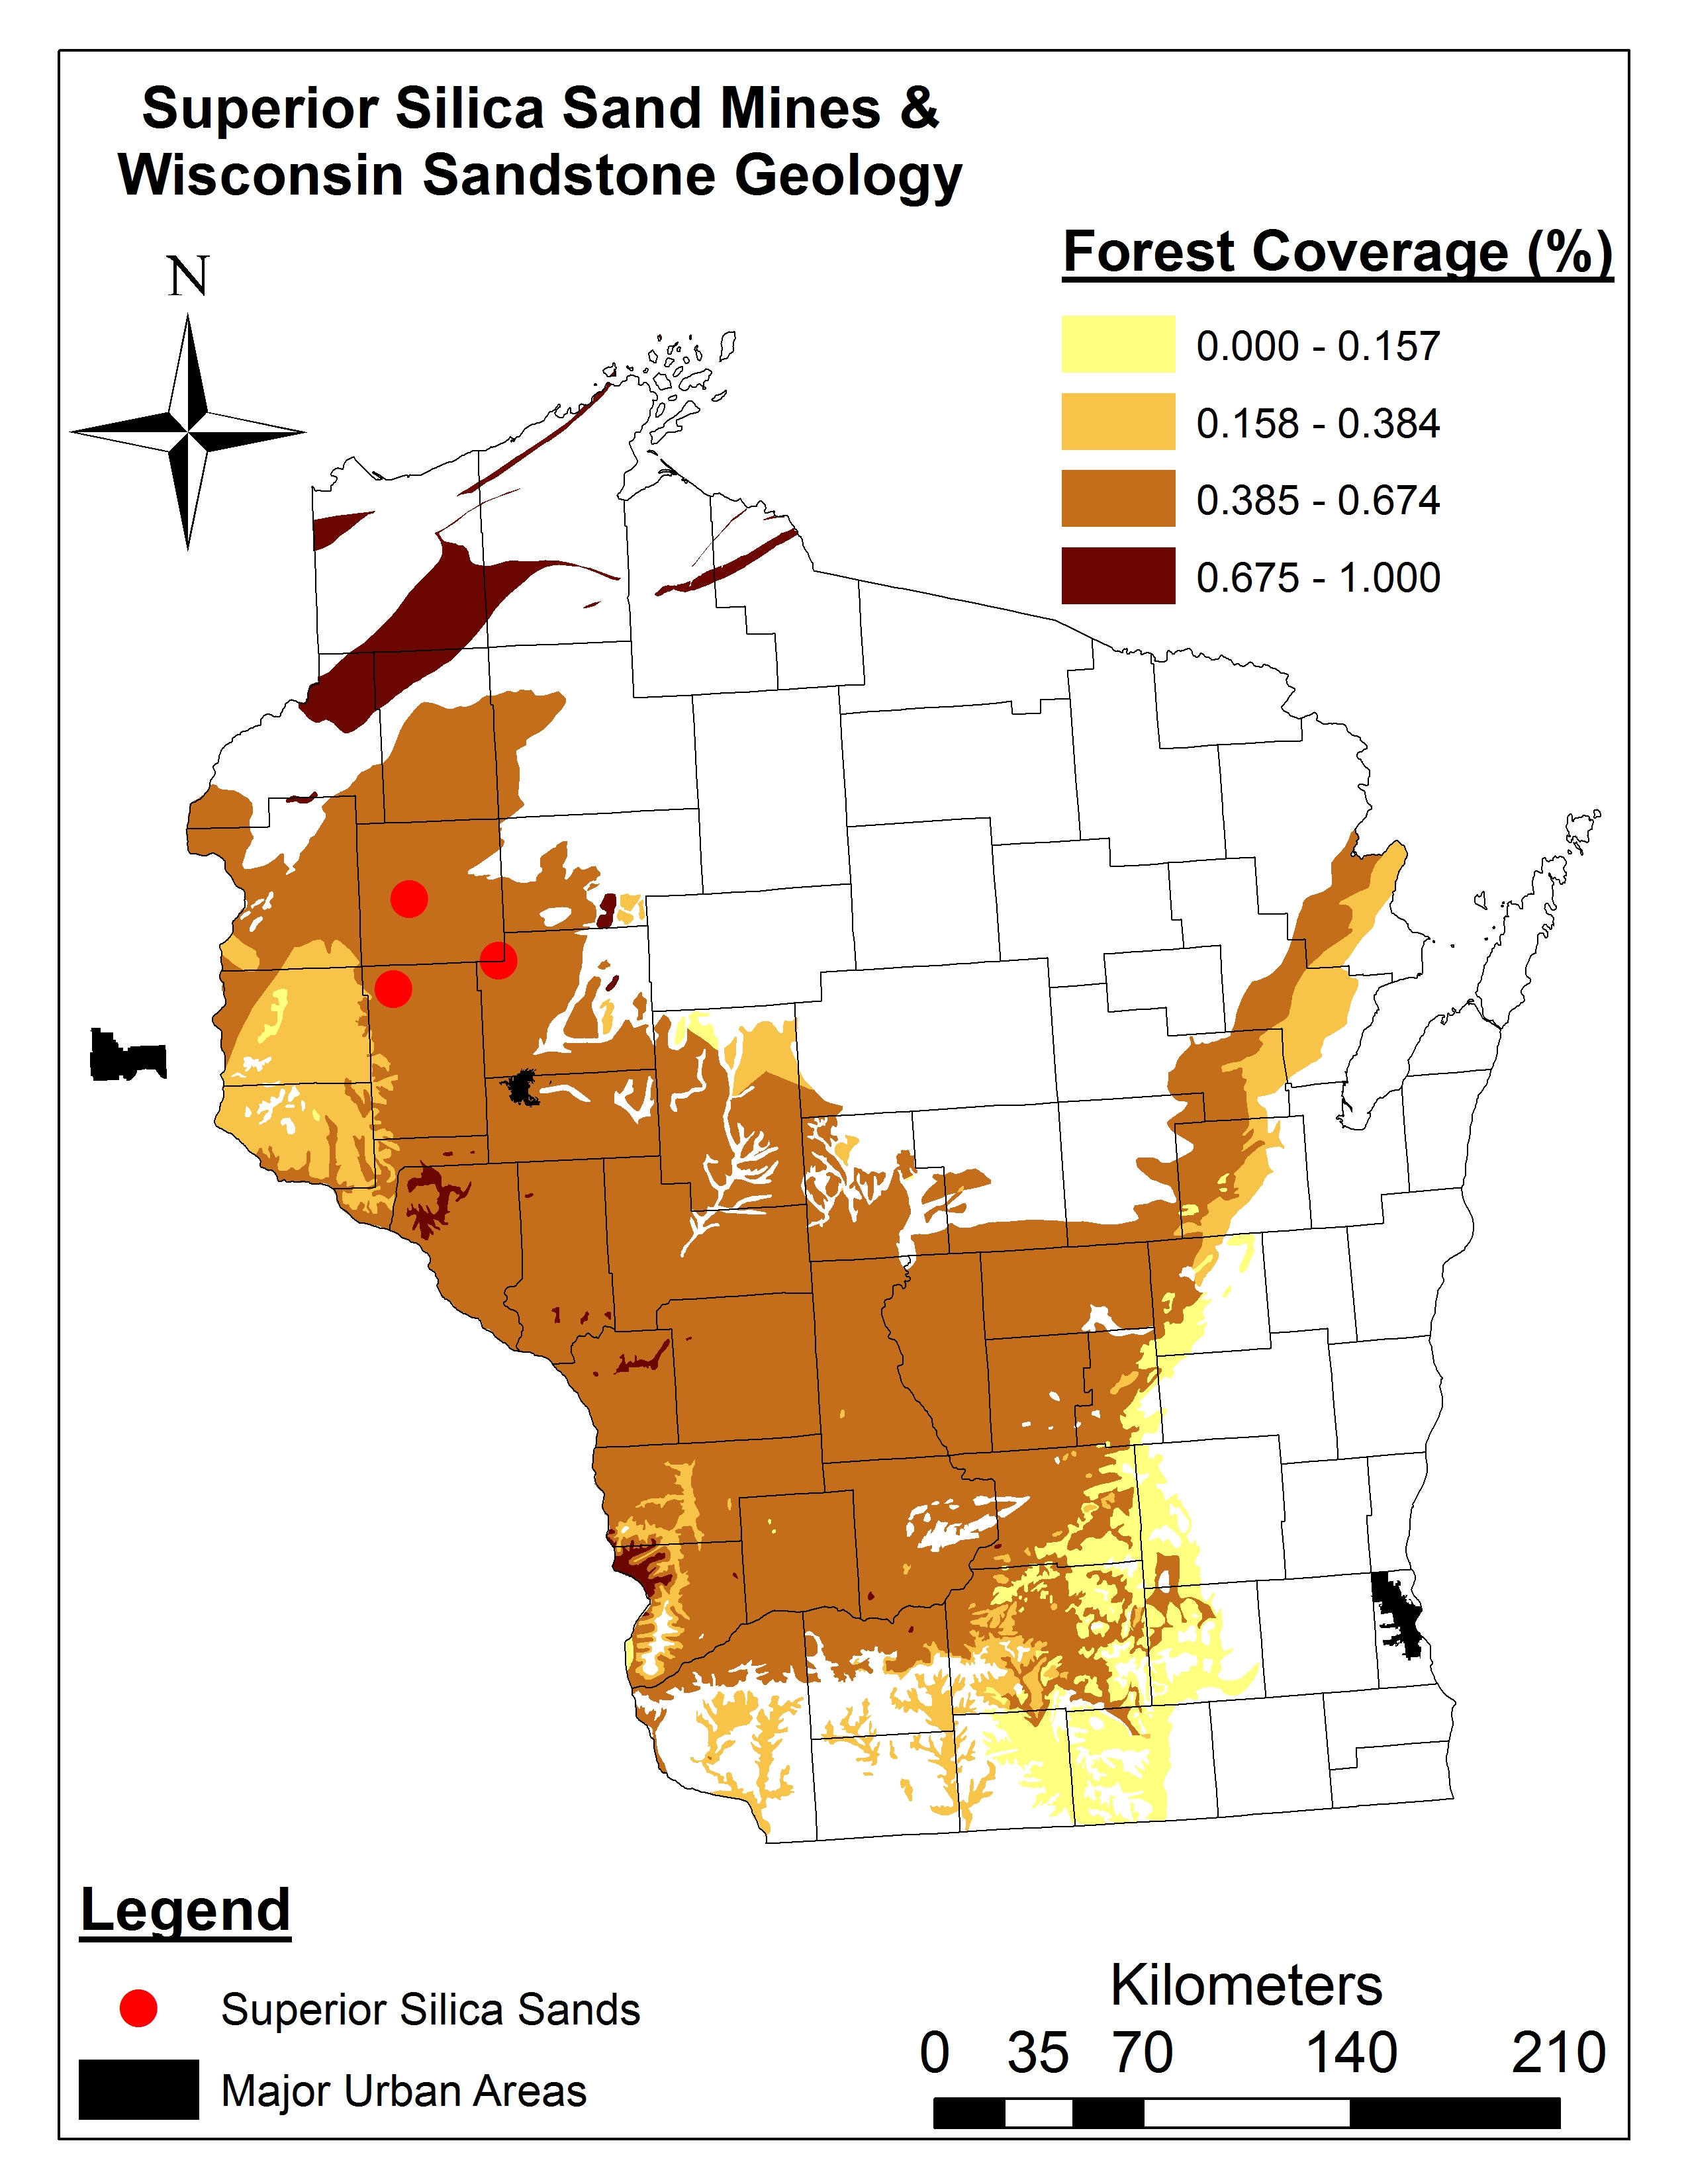
To get an idea of the landscape where these sand mining operations are occurring in Wisconsin, see Figure 1 below.
Wisconsin Sandstone Geology Forest
Coverage (%)
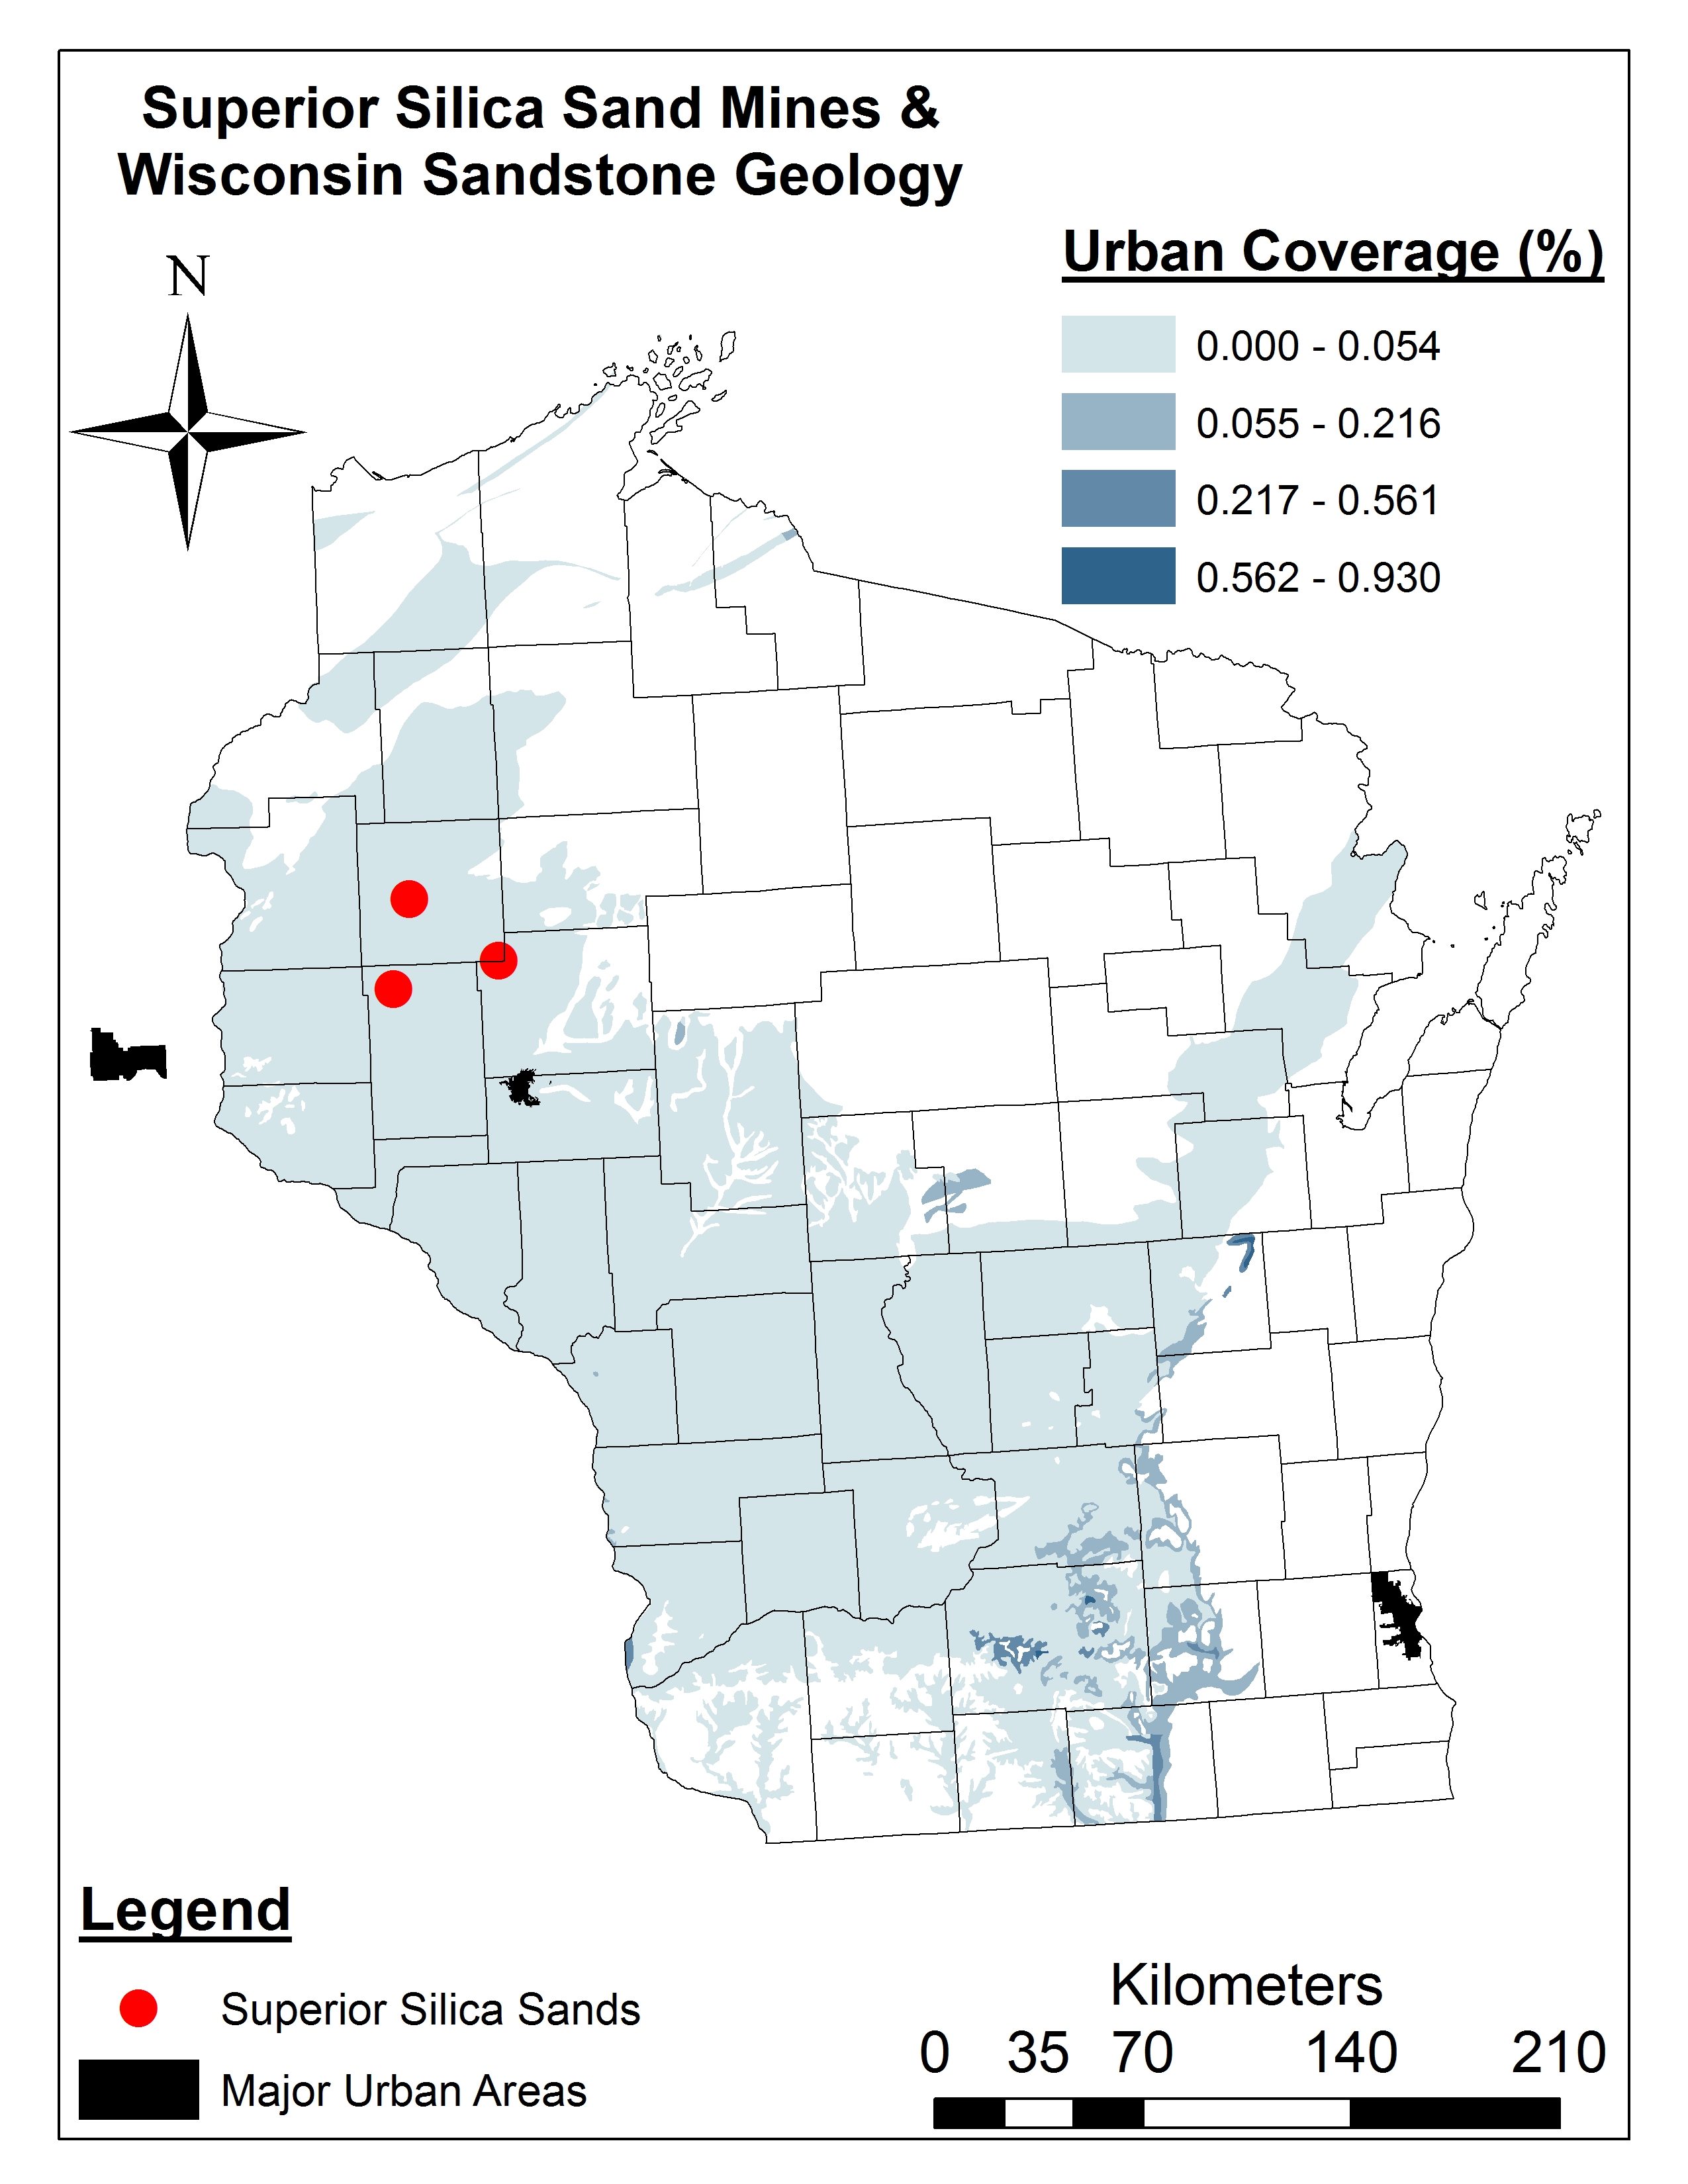
Wisconsin Sandstone Geology Urban Area Coverage (%)
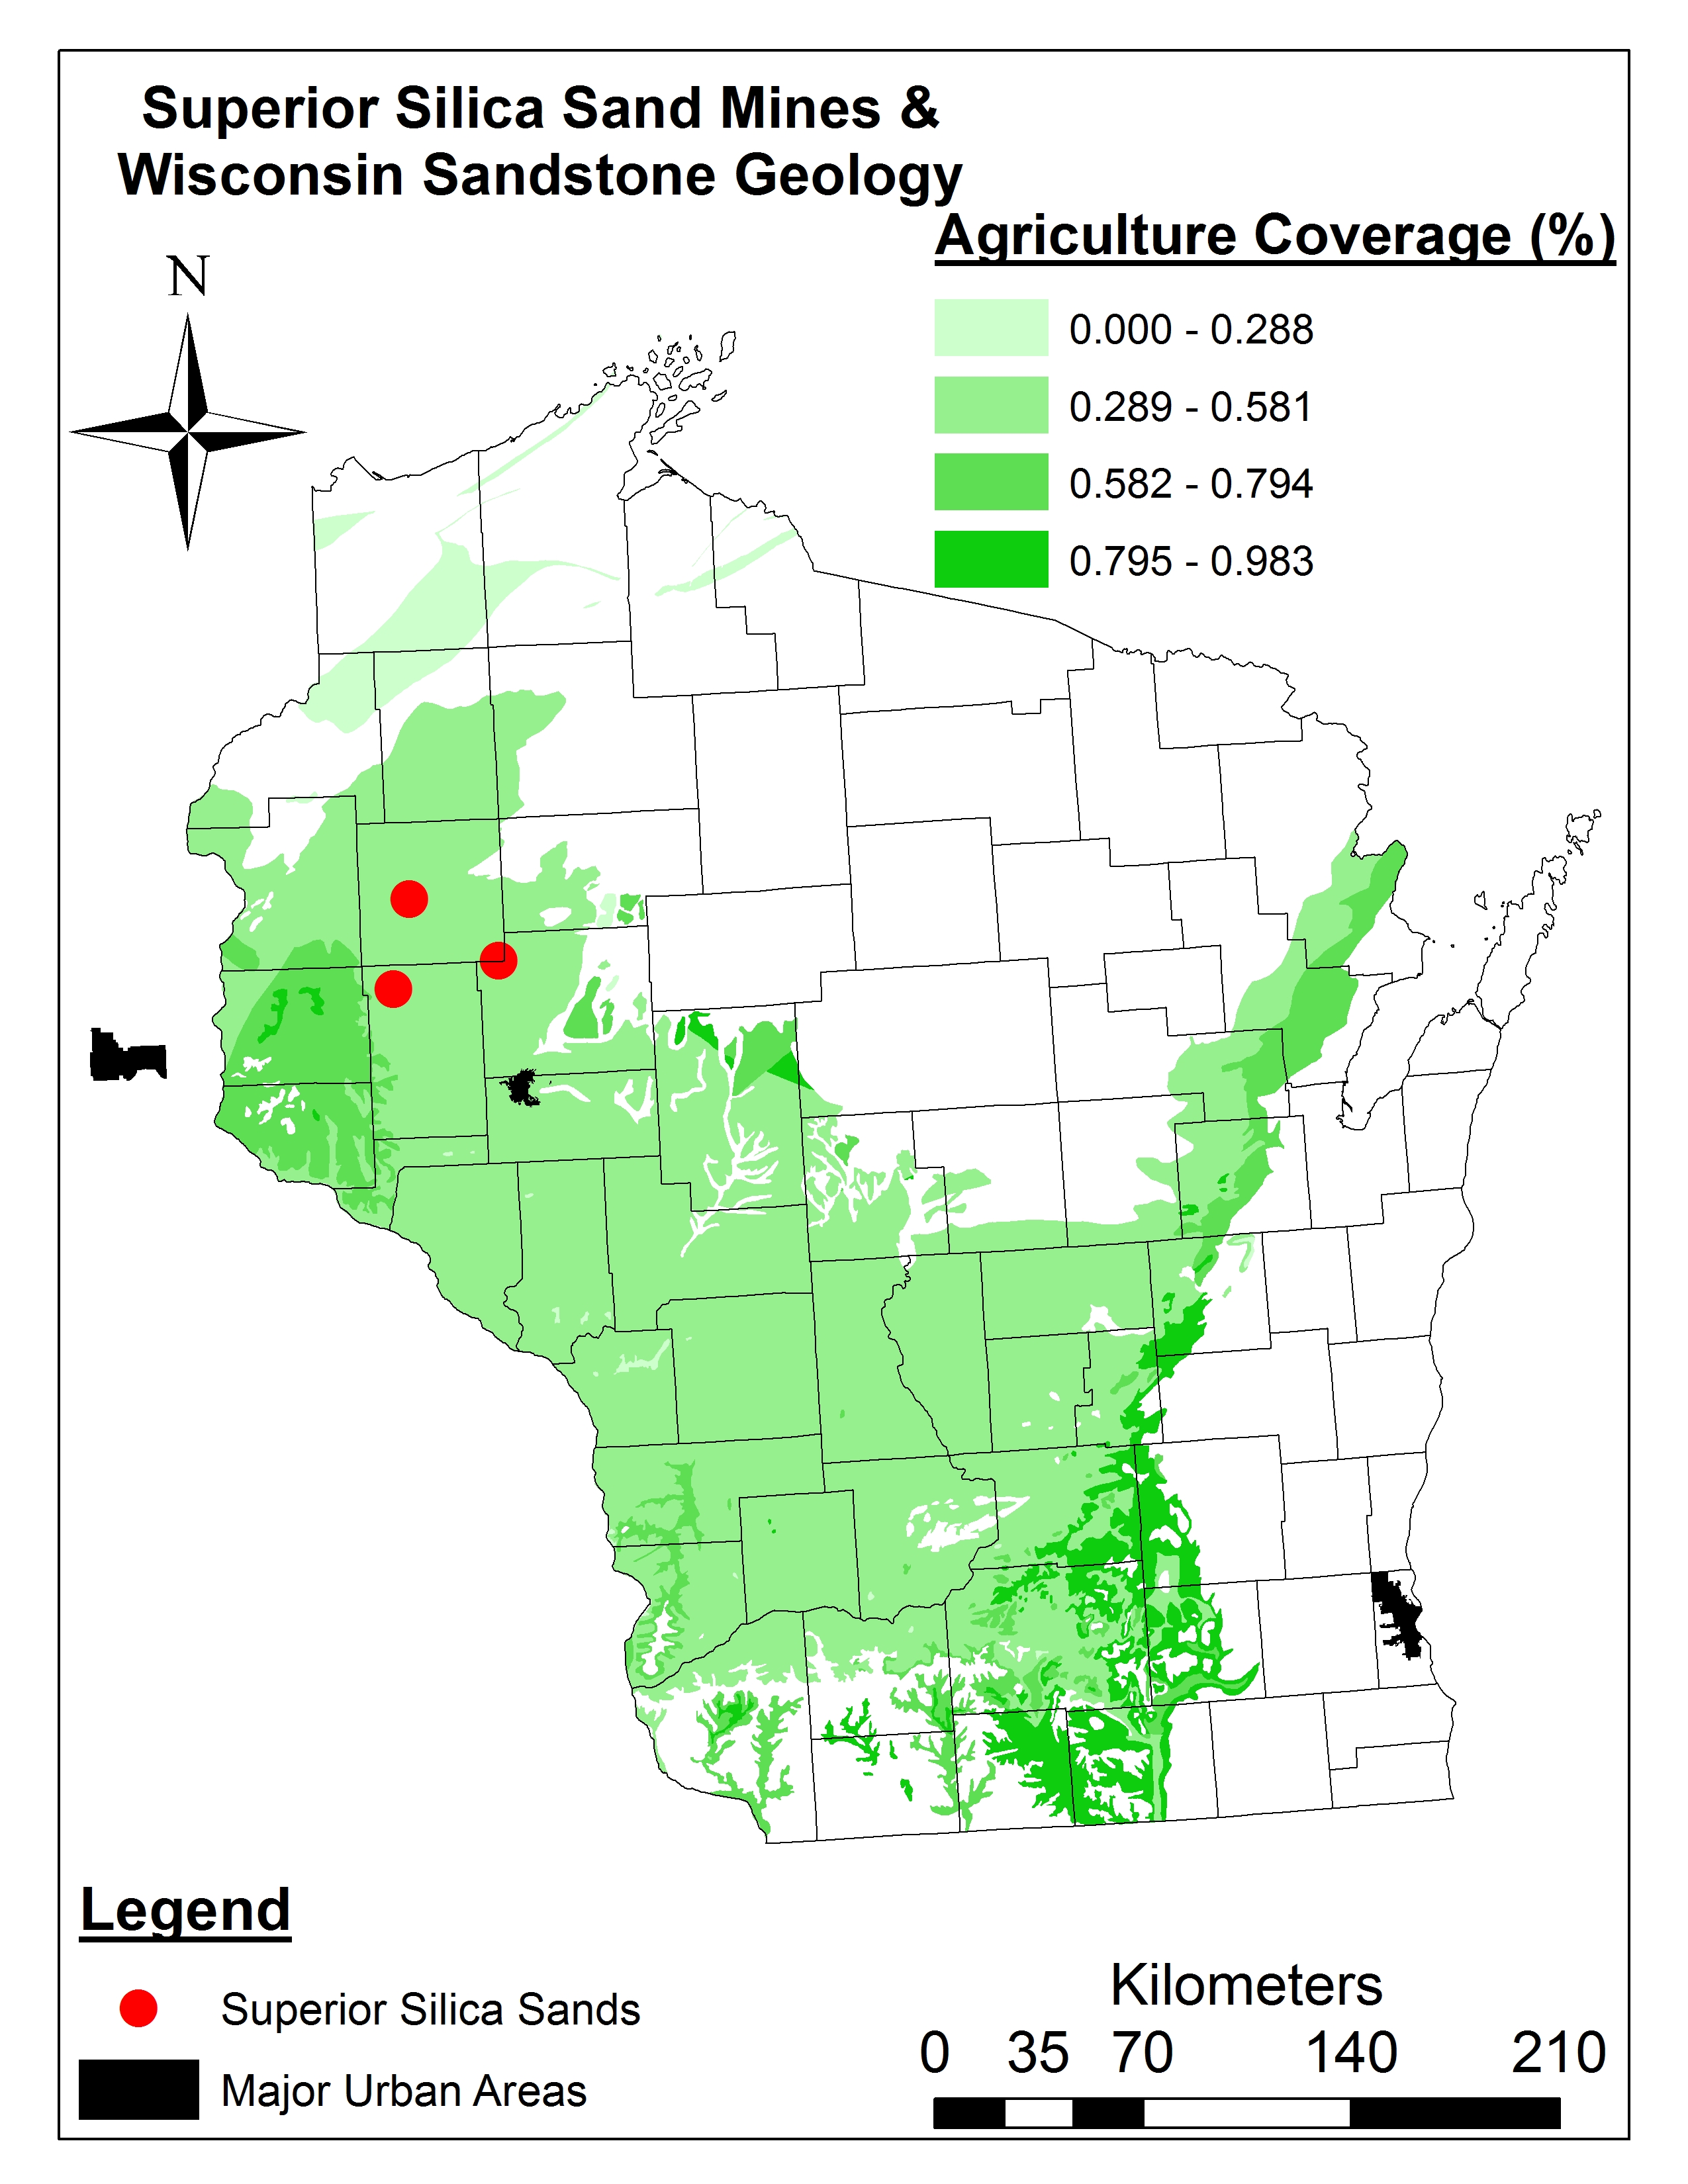
Figure 1. Land cover types (%) and the location of the mines we visited during our recent frac sands tour of West Central Wisconsin (Note: 1.0 = 100%)
“Thank God for Superior Silica Sands,” said Jim Walker, Director of Operations. He wasn’t directly touting his employer’s virtues, but rather sharing a quote from a landowner pleased with the income derived from leasing their farm for the sand beneath. According to Walker, Superior has over 100,000 acres of mining leases in Wisconsin – enough to support their company’s anticipated needs for the next 30 years. Based on frac sand mine permitting data provided to us by the planning commission, this 100,000 acreage translates to 939,700,000 tons of frac sand (enough for 313,233 horizontal wells). Overall, Wisconsin’s frac sand mines are currently producing 185-211 million tons of frac sand from 128 facilities.
Superior is one of more than six sand companies working in the area. One state resident recently emailed me complaining that “we are being inundated with industrial sand mining.” Her perspective is one of concern, but we are told of farmers who are eager to lease their land for potentially hundreds of thousands of dollars in annual payments. Superior prides itself on hiring from the community. The jobs pay well, nearly twice the regional average, according to the planning commission. Healthcare benefits and a 401k are included. At quick glance, it is an economic boom to a rural region, but will it last? Superior has a 10-year contract to supply sand to Schlumberger, a giant in hydraulic fracturing services. Sand prices – affected by competition and overproduction – are dropping, however.
Sand Mining Risks
Environmental impacts may be the biggest cause for worry. Some mining operations can cover more than 450 acres and often involve the destruction of forests. This may happen piecemeal, perhaps 20 acres at a time, but forest habitat and the associated functions (e.g. carbon storage and accrual) are nevertheless diminished. The land is remediated1, but the landowner makes the decisions as to how this occurs. They might choose to plant prairie grasses or trees, but a common preference is more cropland – the latter option enabled by a post-mining reduction in topography. Adaptable wildlife like deer may take the changes in stride, but forest-dependent species and vulnerable plant communities will likely suffer. Water quality and quantity issues have also been highlighted by Wisconsin Watch, Minneapolis Star Tribune, and Minnesota Public Radio.
Public health impacts are perhaps less clear. Superior officials explain that only the finest sand sizes are a legitimate inhalation hazard, and those are atypical to the frac sand industry. A 2012 OSHA hazard alert, however, listed respirable crystalline silica as a significant workplace hazard on unconventional oil and gas well pads, just behind the risk for physical injuries and hydrogen sulfide exposure. At least at Superior, they rigorously monitor the air quality onsite and outside their boundaries. Employees are even monitored for what they breathe. Superior shows data underscoring its outstanding safety and regulatory compliance record. I observe no noticeable blowing of sand or dust on site. While I am on the ground touring, however, Ted enjoys a bird’s eye view courtesy of LightHawk. From the plane, he witnesses aerial movement of material off of other sand mines.
Emissions from increased truck traffic may also present an air quality concern. Dump trucks ply the back roads like worker ants delivering load after heavy load from the mines to the drying plants. The general increase in activity in these forgotten areas may be a lifesaver for some, and a worry for others. Trains with scores of covered, sand-packed cars rumble down the tracks bound for distant shale basins. Texas awaits the trains departing Superior’s Baron plant. Meanwhile, communities express concern about increasing speeds and the safety of crossings.
A Complicated Perspective
For me, the day’s enlightening dialogue and experiences underscore the rough, expanding tendrils of unconventional oil and gas development. They reach far and have complex, often abrasive effects. Here, in the land of Leopold, the father of the Land Ethic, I can’t help but wonder: What would Aldo say about the transformation of his beloved countryside?
[1] Reclamation success, permitting, bond release, inspection and enforcement, and land restrictions were put into law by the Carter administration and introduced by Arizona Republican Morris Udall as defined by the Surface Mining Control and Reclamation Act of 1977, which also created the Office of Surface Mining.
https://www.fractracker.org/a5ej20sjfwe/wp-content/uploads/2016/09/SandMining-Feature.jpg400900FracTracker Alliancehttps://www.fractracker.org/a5ej20sjfwe/wp-content/uploads/2021/04/2021-FracTracker-logo-horizontal.pngFracTracker Alliance2013-11-01 11:37:172020-07-21 10:41:36Sifting Through Sand Mining
FracTracker’s mapping section is constantly being updated with new content, both by adding content to existing maps, as well as adding maps of new themes or geographies. For example, two new maps have been added in the past week, including a map of frac sand mining operations in Wisconsin and hydraulically fractured wells in California. Let’s take a quick look at each one:
Wisconsin Silica Frac Sand Mining Operations. This map is zoomable and clickable, but to gain full access to our tools, click on the expanding arrows icon at the top right corner of the map.
This map is based on a dataset from the Wisconsin Department of Natural Resources that was provided upon request. It includes mines that are operational, have been permitted, or where permits have been applied for. There are three basic types of facilities, including mining (pick and shovel icon), processing (industrial facility icon), and shipping (train icon), with one facility left as unspecified. Click each map icon for more information on the given facility.
California Shale Viewer. This map is zoomable and clickable, but to gain full access to our tools, click on the expanding arrows icon at the top right corner of the map.
California has over 217,000 wells in their database, of which 545 are listed as having been hydraulically fractured. This map also contains county and sub-county boundaries from the US Census Bureau, and large and small watershed boundaries from the USDA Geopatial Data Gateway The sub-county boundaries can be accessed by zooming in, and the watershed boundaries can be turned on by clicking the expanding arrows in the top right of the embedded map, clicking on the “Layers” toolbar, and activating those layers. Once again, users will need to zoom in to access the finer resolution data.
Other recent data updates include the addition of karst and karst-like geography to the United States and Pennsylvania maps. These formations indicate the likely presence of natural caves, tubes, and fissures that could potentially contribute to unwanted subterranean migrations.
Are there any certain types of data that you would like to see mapped? Leave a comment to let us know, and we’ll see what we can do!
https://www.fractracker.org/a5ej20sjfwe/wp-content/uploads/2021/04/2021-FracTracker-logo-horizontal.png00Matt Kelso, BAhttps://www.fractracker.org/a5ej20sjfwe/wp-content/uploads/2021/04/2021-FracTracker-logo-horizontal.pngMatt Kelso, BA2012-12-11 16:11:552020-07-21 10:40:38Additional FracMapper Content in WI, CA