This page has been archived. It is provided for historical reference only.
[image removed]
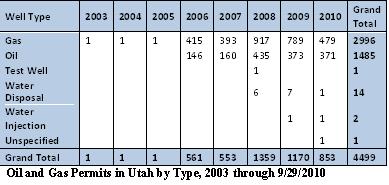
Utah Oil and Gas Wells.
Click on the map for more information.
I pursued oil and gas data from Utah due to the accessibility of the relevant information, and because a map of major shale gas plays indicate several formations of interest in the state, notably the Hermosa and Mancos Formations. However, I learned from Utah’sOil and Gas Permitting Manager and Petroleum Geologist Brad Hill that while there has been discussion of extracting gas from shale formations, currently none of the wells in the state are producing shale gas. On the other hand, he did indicate that most of the wells in the state had been stimulated to some degree with hydraulic fracturing.
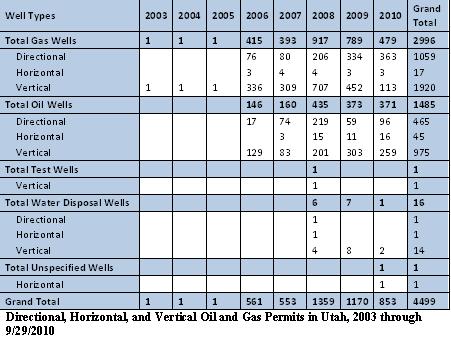
The state is relatively new to the oil and gas industry. Although only one well from 2008 is listed as a test well, it seems fair to conclude that at the very least, the three total wells from 2003 through 2005 should fall in that category as well, even if they are classified as gas wells.
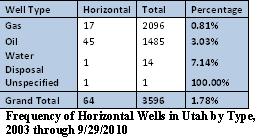
Horizontal Wells
For a state where most of the wells are hydraulically fractured, there are very few horizontal wells. It is also noteworthy that most of the wells that are drilled horizontally are oil wells, not gas. While 3% of oil wells are permitted to drill horizontally, the same is true for only 0.8% of gas wells. The reason for this is not clear at this time.
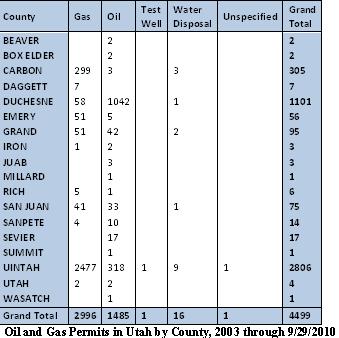
Geographic Information
Geographically, Uintah County is by far the most active portion of the state for natural gas permits, while Duchesne County is similarly dominant for oil drilling activity. Together, Carbon County and Uintah County account for about 93% of the gas permits, while Duchesne County and Uintah County combine for 92% of the oil wells.
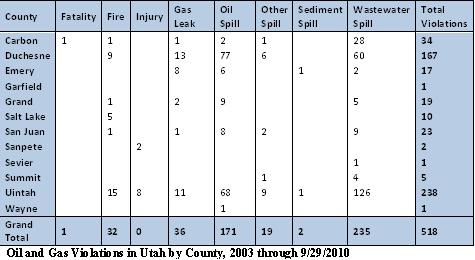
Violation Information
Violation data from the Utah Division of Oil, Gas, and Mining is not posted online, so I submitted a request, and received the data promptly. That dataset includes comments as to what happened to cause the violation, as well as mitigation efforts to date. For the moment, however, we are most interested in an overview of the data. I have therefore condensed the violations into eight categories for ease of use.
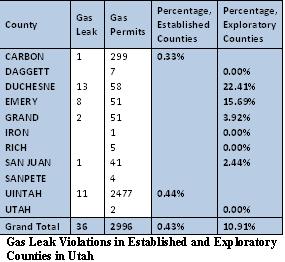
Statewide, there is a gas leak for just over 1% of the permits issued, and for Uintah County, where the vast majority of the gas operations are, that figure is just 0.4%. But in Emery County, there is a gas leak violation for 16% of the permits issued, and Duchesne County that figure is 22%.
The reason for this disparity is not provided, however the numbers do seem to suggest that violations of this type are more frequent where the gas drilling operations are relatively sparse. I mentioned that Carbon and Uintah Counties together account for 93% of the gas operations in Utah. If we consider those two counties to have an established gas industry with the rest of the state being exploratory in nature, we see a dramatic difference in the frequency of gas leak incidents.
>This post was updated on 11-8-2010.