
Movement of Pennsylvania’s non Marcellus Waste 2010
One of the biggest concerns about the Marcellus Shale industry in Pennsylvania is how to deal with all of the waste products that are created in the drilling, stimulation, and production of the wells. There are also more than 40,000 oil and gas wells from other formations in the Commonwealth that reported waste production to the Pennsylvania Department of Environmental Protection (DEP) last year. Whether this waste ultimately found itself into publicly owned treatment works, industrial waste treatment facilities, injection wells, or spread on roadways, it almost always has to be shipped to a different location, sometimes hundreds of miles away.
For more information on specific facilities that accepted non Marcellus waste in 2010, click on one of the maps below, then use our information tool (“i” icon) and click on any map icon.
Brine

Yellow dots indicate wells that reported brine production, and red squares are receiving facilities. The green lines are the paths that the waste takes, as the crow flies. Darker lines indicate larger quantities of brine, which are measured in barrels. For more information on specific features, please click the map for a zoomable, dynamic view.
Statewide, almost 4.5 million barrels of brine was produced by non Marcellus Shale wells in 2010, which was transported over 900,000 miles as the crow flies(1) from the various wells to the facility locations, with an average one way trip of about 30 miles.
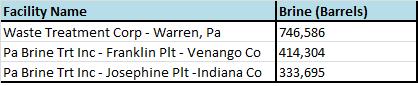
Facilities accepting the most brine from non Marcellus wells in PA in 2010
Drill Cuttings
Only one operator reported drill cutting waste from a total of three wells. All of this type of waste went to the same facility. Geographic coordinates were not included for the receiving facility in the data, so mapping and distance measurements were not performed for this analysis. Suffice it to say, however, that the amounts discussed are relatively small compared to brine and other types of waste.

Facility accepting drill cutting waste from non Marcellus wells in PA in 2010
Drilling Fluid
The color scheme for this map similar to that of brine, above, but in this view, yellow dots indicate wells producing drilling fluid waste.
More than 300,000 barrels of drilling fluid was produced last year from non Marcellus Shale wells in Pennsylvania. That waste traveled over 18,500 miles as the crow flies en route to its receiving facilities.

Facilities accepting the most drilling fluid from non Marcellus wells in PA in 2010
Frac Fluid
The color scheme for this map similar to that of brine, above, but in this view, yellow dots indicate wells producing frac fluid waste.
While the term “frac fluid” is often used to refer to the chemical additives that are used along with water and sand to hydraulically fracture a well, in terms of the waste report, it refers to the flowback water. This type of waste contains the other type of frac fluid, but at significantly reduced quantities.
Last year, non Marcellus Shale wells reported producing over 499,000 barrels of frac fluid waste, which traveled almost 82,000 linear miles to receiving facilities, with the average one way trip being about 40 miles in length.
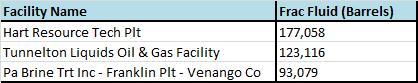
Facilities accepting the most frac fluid waste from non Marcellus wells ion PA in 2010
- Please note, for each distance analysis, only wells from the waste production report which included decimal degree data for both the wells and receiving facilities were included. Therefore, the distances are being understated. For example, only about 29,500 of the more than 40,500 non Marcellus wells that produced brine last year are included in this figure, or about 73 percent.
Hi Matt,
Great maps! I’m investigating Marcellus waste in PA. Do you happen to know how many gallons are in the “barrel” used to quantify waste fluids?
I’ve been using your maps for a year now and would like to interview you for The Public Herald, an online investigative news and culture source. Who is the guy making all of this data easy to digest for the rest of us? Would you be willing to indulge us about yourself and give an overview of FrackTracker?
Sincerely,
Melissa Troutman
Managing Editor
PublicHerald.org
Aaron,
You could always click on the image, and make a new visualization based on that one, and then add demographic data. I know that there is at least demographic data on FracTracker from the 2000 census…I don’t believe the 2010 census data that’s up there has income/race data, but it might be worth checking on.
The point of doing the transport lines as I did was merely for the visual, cumulative effect that the waste needs to transported, sometimes appreciable distances. In that regard, “messy and confusing” is just what I was trying to convey. There are other GIS route analysis tools available that would allow you to predict traffic on individual roads, but that would be a different exercise altogether.
It’d be neat to see income/race of these areas.
Also – is there a better way to display transfers on a map? Drawing lots of lines is messy and confusing. Perhaps aggregating the lines (grouping them) and then only showing all the details when you zoom in. Just an idea!