Does Thickness of Shale Predict Production?
I was recently contacted by a resident of New York State who was concerned about Marcellus Shale gas drilling moving into his area. He found a report by geologists Dr. Gary Lash from SUNY – Fredoinia and Dr. Terry Engelder from Penn State that showed the shale layer thinning substantially as it heads north across the Pennsylvania-New York border.
What’s more, this report breaks up the Marcellus Shale into several substrata, including the Union Springs shale and the Oatka Creek shale, which are separated by a thin and intermittent layer of limestone.
On a cursory level, the thickest parts of the Union Springs substratum of the Marcellus Shale seemed to correspond with the highest production areas in Bradford and Susquehanna Counties. Even though there was another high production area in Southwestern Pennsylvania in a relatively thin portion of the Union Springs (and Marcellus Shale in general), it seemed like a reasonable hypothesis to explore. Does the thickness of the shale layer effectively predict the production values from wells in those areas?

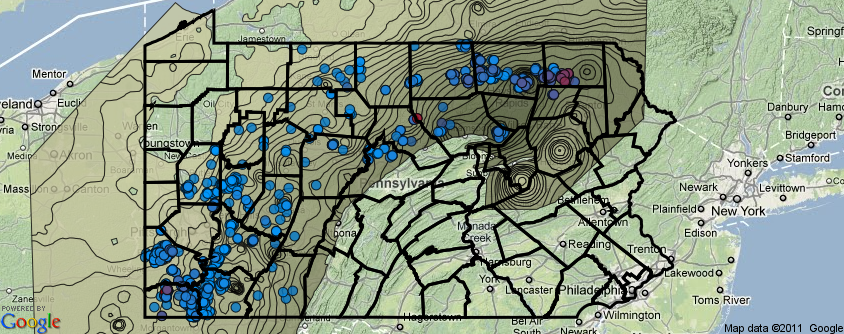
Thickness of the Union Springs substratum of the Marcellus Shale and daily production values. As the shale layer gets thicker, it is represented by darker brown bands, while production values range from blue (lowest production) to red (highest production). For more information and a dynamic view, click the image to visit our DataTool.
Karen Edelstein, FracTracker’s New York Liason, digitized the Union Springs thickness map from the Lash-Engelder report, and then I was able to correlate the production values of all Marcellus Shale wells to the average thickness of each category. For the purpose of this exercise, only wells reporting positive (non-zero) production values between July and December 2011 were included. To account for wells in production for only part of that period, I calculated the average daily production in thousands of cubic feet (Mcf) per day.

Thickness of the Union Springs substratum of the Marcellus Shale in feet versus average daily production in thousands of cubic feet (Mcf) per day.
Overall, the correlation isn’t very strong. While the trend line does show moderate increases in production as the Union Springs shale layer thickens, the low R-squared shows that there is a good bit of randomness involved. Part of this was expected, due to the large number of productive wells in Southwestern Pennsylvania, where the formation is quite thin. This would be the notable bump in the plot chart above between 20 and 60 feet of thickness.
Thickness of the Union Springs substratum of the Marcellus Shale and average daily production values. Click the image for more information and a dynamic view.
However, there is another factor that contributes to the poor correlation. As I mentioned above, the trendline does indicate that on average, wells in the thicker formations produce more gas than those in thinner formations, but there are also a large number of duds from the most robust parts of the Union Springs. That is to say, there are a lot of blue dots in the dark brown regions of the map below.
It is likely that if the whole thickness of the Marcellus Shale were considered, the results would have been even worse. In fact, some of the thickest parts of the whole Marcellus, at least according to Lash and Engelder, are in Pike County, which drillers have left alone so far.
So we have not cracked the nut of predicting which areas will yield the highest production returns, but at least we have good company in that regard. Despite the huge amount of data that the oil and gas companies possess, the results that they report to the Pennsylvania Department of Environmental Protection show that they still don’t really know what they’ll find at the bottom of a hole until they drill it.
Although there is clearly more to gas yields than thickness of the shale, it was an interesting exercise, and if the industry ever does figure it out, it will be a multi-billion dollar discovery–keep in mind that each of the thousands of wells planned cost at least $5 million to drill. Here’s hoping that they do figure it out someday, and not just because of the economics. If drilling wildcat wells can be minimized, then many of the significant adverse effects of the industry would also be mitigated as well, at least in areas where production values were estimated to be low.
Does this study look at the choke on the wells whether intentional or because they cannot get the gas out of the area. Cabot, who has been drilling in Dimock I would suspect that these well are in thick areas and are on compression stations which should lower the wellhead choke. Other wells by Talisman are new and are flowing directly into collector lines with no compression. I have not been able to get data on wellhead pressure. I would think that comparing production without knowing the conditions of extraction doesn’t mean much. Talisman wells in NE Bradford have been said to be exceptional by the driller and fracker, but not showing great production at this time.
This article only takes into account thickness of the shale, and based on estimated values, at that. Certainly, I agree that the more data that are available the better, but sometimes, the desired data for an analysis are not available. I do think there is some point in comparing production values; ultimately that is how the operators are going to decide how and where to leverage their investments.
As always, it is worth keeping in mind that all production values are self-reported by well operators.
I would love to see the results of this study done using production in mcfe. Since much of the hydrocarbon production in SW Pa is in liquids, including them in the analysis would be helpful. The conversion is just an estimate, but I think that it’s mcf of gas + (barrels of liquids)/8 = mcfe. The liquids extracted by the cryo plants are not published, but you could use the state’s production numbers for condensates and oil.
If you took the liquids into account, it would be even more evidence that the thickness of the shale layer is not the sole determination of the hydrocarbon content.
The author is vastly under skilled to study this. One variable doesn’t cut it. SW PA has double the carbon richness as NE PA.
PLUS the lines drawn are ISOPATH map guesses, based on very few data points .
Typical in this era, people without knowledge = running in the dark.
Markus
I’m surprised that you read this and didn’t come to the conclusion that the author agrees with what you have to say: one variable does not cut it.
Interesting, if flawed analysis. Since Washington County wet gas is an anomaly compared to Bradford. etc. dry gas, the proper way to do this is by well density – meaning map the total area of different isopachs – using increments of say 50 feet – and calculate the productive well density as a function of thickness. What you would find, if you removed SE wet gas anomalies, is that well density is in fact correlated to thickness. Since the density calculation would take into account areas where the Marcellus is thin and there are few/ no productive wells.
James, you are welcome to conduct such an analysis, but I feel like it runs the risk of mashing the data into the mold you want it to fit into. You call the SE PA region an anomaly, and yet it is much more than that–it is where the Marcellus Shale activity got started.
If we were talking about one well out of thousands, then sure, it is anomalous, but we are looking at hundreds of wells. And you are also altogether ignoring a large number of wells with relatively low production output in the thickest regions. That also has a negative influence on the thickness/production correlation.