Nothing rings out the old year quite like a nice data table. So here, for your viewing pleasure, is a list of drilled unconventional wells in Pennsylvania, sorted both by county and year:
Drilled Unconventional Wells in PA: 2005 to 2012
This table is perhaps the most succinct way to summarize the eight years of unconventional drilling activity in Pennsylvania on a county by county basis, and in that regard, it stands as a useful reference. But at FracTracker, we are always trying to ask, “What does it mean? So here are a few points to take away from this table:
The last two columns show the changes from 2011 to 2012 in terms of raw count and percent change, respectively. Those counties showing a year to year reduction are highlighted with red text in these columns.
The number of unconventional wells drilled statewide in 2012 is the smallest total since 2009, and is down 31 percent from 2011 totals.
Some counties, such as Allegheny and Armstrong, are experiencing an expansion of activity from the industry, while others, such as Tioga and Bradford, are declining sharply.
Of course, we also like to look for spatial patterns at FracTracker. The results are not random:
Percent change of number of unconventional wells drilled by Pennsylvania county from 2011 to 2012. To access full controls, click the expanding arrows icon at the top right corner of the map.
Although reported oil and condensate production values are modest for unconventional wells in the state, the cluster of green counties (which show more wells drilled in 2012 than 2011) in southwestern PA occur in the area where the Marcellus Shale is considered to be wet gas. Counties in the northeastern portion of the state typically produce more natural gas than in other places, but it is generally dry gas. Clearly, the heavier hydrocarbons of the southwestern counties are more of interest for drillers in a year in which gas reserves have been well above average all year long.
https://www.fractracker.org/a5ej20sjfwe/wp-content/uploads/2025/09/2025-Wordmark-Logo.png00Matt Kelso, BAhttps://www.fractracker.org/a5ej20sjfwe/wp-content/uploads/2025/09/2025-Wordmark-Logo.pngMatt Kelso, BA2012-12-31 16:07:442020-07-21 10:40:38Drilled Unconventional Wells in PA by County and Year
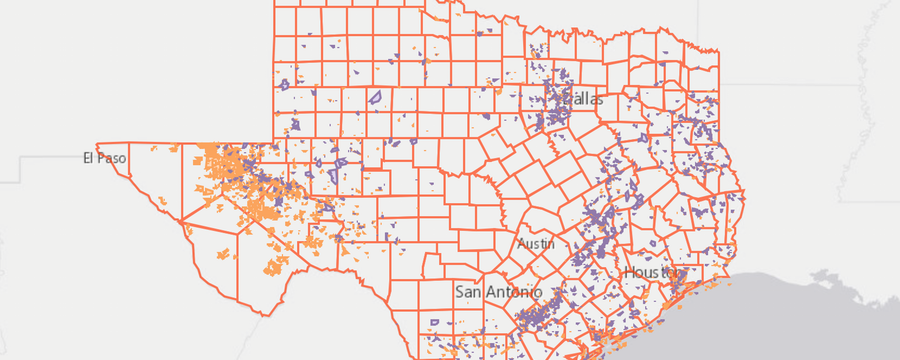
In the wacky world of oil and gas data, you never know what unexpected treasures there are to be found. For that matter, you never know what standard data will remain out of reach. Such is the story of the new Texas Lease and Pooling Agreements entry to FracMapper.
Texas Lease and Pooling Agreements. This map is zoomable and you can click on the map icons for more information. For full access to the FracMapper controls, click the expanding arrows icon in the top right corner.
In many states, even though lease data is technically publicly available, in practice, it is nearly impossible to obtain in a systematic fashion. Imagine searching through stacks of property files at county office buildings to see if there happens to be any mineral rights attached to a plot of land; this is the reason that lease data is so often not available in the way that oil and gas well data usually is. But in Texas, it’s easy: just go the the Texas General Land Office (GLO) website and download it. Not only that, but they have pooling agreement mapping data freely available as well.
On the other hand, the oil and gas well data is not up to the transparency and accessibility standards of other states. Although the agency that regulates that data, the Railroad Commission (RRC) of Texas, has a bevy of search tools available, notably missing from the results are the location data. As it turns out, the Lone Star State actually charges for that data, and a pretty penny too. Luckily, the RRC does provide a one county sample of the sort of data that one might get if they spent thousands of dollars on their data. This has allowed FracTracker to determine that the data purchase is decidedly not worthwhile. The oil and gas wells don’t even have complete well API numbers, let alone spud or permit issue dates.
Hopefully someday, the RRC will follow the data transparency model of the GLO, and not the other way around. A state funded by such a robust severance tax ought to be able to figure out a way to get this data out there for free.
https://www.fractracker.org/a5ej20sjfwe/wp-content/uploads/2012/12/TexasFeature.png400900Matt Kelso, BAhttps://www.fractracker.org/a5ej20sjfwe/wp-content/uploads/2025/09/2025-Wordmark-Logo.pngMatt Kelso, BA2012-12-26 17:26:562020-07-21 10:40:38Texas Lease and Pooling Data Available
FracTracker’s mapping section is constantly being updated with new content, both by adding content to existing maps, as well as adding maps of new themes or geographies. For example, two new maps have been added in the past week, including a map of frac sand mining operations in Wisconsin and hydraulically fractured wells in California. Let’s take a quick look at each one:
Wisconsin Silica Frac Sand Mining Operations. This map is zoomable and clickable, but to gain full access to our tools, click on the expanding arrows icon at the top right corner of the map.
This map is based on a dataset from the Wisconsin Department of Natural Resources that was provided upon request. It includes mines that are operational, have been permitted, or where permits have been applied for. There are three basic types of facilities, including mining (pick and shovel icon), processing (industrial facility icon), and shipping (train icon), with one facility left as unspecified. Click each map icon for more information on the given facility.
California Shale Viewer. This map is zoomable and clickable, but to gain full access to our tools, click on the expanding arrows icon at the top right corner of the map.
California has over 217,000 wells in their database, of which 545 are listed as having been hydraulically fractured. This map also contains county and sub-county boundaries from the US Census Bureau, and large and small watershed boundaries from the USDA Geopatial Data Gateway The sub-county boundaries can be accessed by zooming in, and the watershed boundaries can be turned on by clicking the expanding arrows in the top right of the embedded map, clicking on the “Layers” toolbar, and activating those layers. Once again, users will need to zoom in to access the finer resolution data.
Other recent data updates include the addition of karst and karst-like geography to the United States and Pennsylvania maps. These formations indicate the likely presence of natural caves, tubes, and fissures that could potentially contribute to unwanted subterranean migrations.
Are there any certain types of data that you would like to see mapped? Leave a comment to let us know, and we’ll see what we can do!
https://www.fractracker.org/a5ej20sjfwe/wp-content/uploads/2025/09/2025-Wordmark-Logo.png00Matt Kelso, BAhttps://www.fractracker.org/a5ej20sjfwe/wp-content/uploads/2025/09/2025-Wordmark-Logo.pngMatt Kelso, BA2012-12-11 16:11:552020-07-21 10:40:38Additional FracMapper Content in WI, CA
Many people may have seen or are familiar with Gas Rush Stories, a series of short documentaries about natural gas drilling in Pennsylvania. According to the website, these stories are important to tell because “whether we live near a drilling site or downstream, whether we receive royalties or paychecks from a gas company, we are all impacted by this gas drilling in ways good and bad.” But how many of you know how Gas Rush Stories came to be? How many actually know the woman behind the curtain, Kirsi Jansa? If you have ever coordinated an event or been a speaker at one like I have, you have most certainly run into a wonderfully impassioned Finn standing behind her video equipment. Here is her Gas Rush Story…
A few weeks ago I sat down with Kirsi to get a better understanding of her work. Originally, I thought she was an extreme advocate against natural gas drilling, but like many other people with that perception, I was way off. Looking back, I don’t even know where I developed that idea about this energetic and passionate journalist. Kirsi has been covering environmental and public health issues for some time. A couple of years ago, she saw the need to develop a forum for people to share their experiences of this new industrial development in the northeastern United States. She sold the pilot idea as a project to the Finnish Broadcasting Company. The project eventually evolved into a series of documentaries on shale gas that presented various facets of the issue. She continues the project to this day and is looking for additional funding to develop an extension of the series called Rethinking Energy Stories.
It’s all who you know – and who you can access
Unfortunately, as those of us who work in this field know, the climate that surrounds unconventional natural gas drilling is tense at best. Kirsi has found it very difficult to access people with the true know-how. She says that the culture in the U.S. does not support bridging the gaps between industry, regulators, academia, and the public. (If you follow U.S. politics you will see this behavior mirrored in the inability or unwillingness of many politicians to work across party lines.) As a result of this barrier, many of her initial short videos showcase the negative aspects of drilling – partly because that is who agreed to speak publicly about it at the time and partly because that is where she saw the gaps in information being presented. Trouble accessing industry and regulatory experts only intensified when her stories were slammed as “advocacy-ridden.” Kirsi believes that her personal opinion on whether drilling should continue is irrelevant to the experiences being presented. “Even though I have concerns and critical questions, I want to you tell your story,” she relayed to me during our frank conversation. Through sheer persistence and fortitude, Kirsi later was able to cover other perspectives and issues such as frac fluid recycling with Reserved Environmental Services (RES), water management with engineering professor, Dr. Radisav Vidic, and even a short documentary in Germany.
In Need of a Transparent Dialogue
Kirsi feels that the lack of transparency inhibits true participation in the public dialogue regarding the nature of unconventional natural gas drilling. People need unbiased sources of information that allow them to develop their own opinions organically. The problem is that there seems to be no neutral party in this game, since all of us involved live and work in this economy. Unconventional natural gas extraction may offer many benefits (economic boosts, domestic energy production) but also many drawbacks (environmental spills and pollution, health risks). Through her stories, Kirsi hopes to highlight the need for us to listen to each other in order to develop a broader, more comprehensive picture of such a complicated issue.
https://www.fractracker.org/a5ej20sjfwe/wp-content/uploads/2012/12/interviewer.jpg195195FracTracker Alliancehttps://www.fractracker.org/a5ej20sjfwe/wp-content/uploads/2025/09/2025-Wordmark-Logo.pngFracTracker Alliance2012-12-04 17:24:542020-07-21 10:40:38A Tale of Two “Gas Rush Stories”
Among the many provisions under Act 13, Pennsylvania oil and gas operators now must join several other states by disclosing some generalized information about chemical additives to wells that undergo hydraulic fracturing to a national registry called FracFocus.org. On their main page, FracFocus describes their role in the following manner:
In a single year, FracFocus has made a national impact from the Beltway to the Bakken. During this time, more than 200 energy-producing companies have registered over 15,000 well sites through FracFocus.
This success is the result of nationally recognized organizations working with the oil and natural gas industry to provide public transparency. Learn more and see highlights from the first year of FracFocus.
However, there are strong differences of opinion on what transparency really means. Does it entail specific data about a well, general information about all the wells, or both? The chemical registry is focused on specifics about individual wells, and although the data is easily accessible for them, they don’t offer data downloads for users interested in a wider scope. Whether this amounts to data transparency has everything to do with the lens that one looks through.
Let’s say, for example, that you already know a bit about a given well. As a random example, let’s use API# 37-131-20104, a well operated by Chesapeake in Wyoming County, PA. When we conduct a search, we are given the opportunity to download a PDF where we can learn a great deal about the well that is not available from the Pennsylvania Department of Environmental Protection (PADEP) data download section. We learn, for example, that the well was fractured on May 8, 2012 using over 1.3 million gallons of water, as well as the maximum amounts used of chemical additives the hydraulic fracturing fluid, and why they were added to the mix.
Objectively, that is a large step forward in transparency, as this information was not available before. But what if your questions about the industry are broader? You may want to know, for example, if some operators are putting diesel fuel into the hydraulic fracturing fluid, or whether some anti-bacterial agents are more prominent in certain geographies than others. You might want to do a comparison on which companies claim data to be proprietary, relative to the industry as a whole, or whether there is any correlation between particularly noxious chemical additives and well production. To answer questions like these, you just need a summary of the data that FracFocus already offers. But unfortunately, FracFocus will not provide this aggregated data.
To help address questions such as these, SkyTruth.org has extracted the data from the PDF documents using a combination of automated and manual techniques, and have made the results available to FracTracker and the general public. The result is a major step forward in data transparency; even before the chemical data have been picked through and combed over, there are still several new types of data that the general public didn’t have access to before.
SkyTruth’s efforts have allowed us to map FracFocus data. Click on the map above to explore.
The data include over 26,000 records from FracFocus since January 1, 2011 from twenty different states around the country. Now it is possible for people other than industry insiders to learn about variables not provided by the various states, including depth of target formation, fracturing dates, amounts of water used. There is also a separate dataset including all listed chemicals at each well, which comes in at well over 800,000 records for the 21 months of the report.
Of course, users must remain mindful that this is not, in fact, a completely comprehensive dataset. While several states have recently required disclosure of the chemical additives, in remains a voluntary disclosure in other locations. Some of the chemicals are listed in the abstract, but marked as proprietary, which naturally limits our understanding of what was put into the well. And as with other large datasets of this sort, it is likely that there are a significant number of omissions and errors.
At FracTracker, we’d like to extend our gratitude to both FracFocus for collecting the data and making it public, and to SkyTruth, for aggregating it and making it more usable. In our view, both of these steps are critical for true data transparency. This transparency, in turn, is indispensable for making an enhanced understanding of the oil and gas industry possible.
https://www.fractracker.org/a5ej20sjfwe/wp-content/uploads/2025/09/2025-Wordmark-Logo.png00Matt Kelso, BAhttps://www.fractracker.org/a5ej20sjfwe/wp-content/uploads/2025/09/2025-Wordmark-Logo.pngMatt Kelso, BA2012-11-14 11:36:122020-07-21 10:40:37SkyTruth Aggregates FracFocus Data
Additional Pennsylvania content has been added to FracTracker’s mapping utility, FracMapper. In addition to the Shale Gas Viewer, which contains a lot of basic information about unconventional gas extraction in the Commonwealth, users can now also find information on the latest production and waste reports, which range from January 1, 2012 to June 30, 2012 in both cases. All three maps can be found together on the Pennsylvania Maps page.
Let’s take a look at each of the new maps:
Production
The production map(1) contains separate layers for each of the three kinds of production reported in Pennsylvania: gas (measured in thousands of cubic feet, or Mcf); condensate (measured in barrels); and oil (measured in barrels). I have also made county-level maps containing aggregated data by county for each of the three products, including total production, number of wells that contributed to the production (which may differ from “drilled wells”), and the average production of those wells. So for example, there were two unconventional wells that produced oil in Butler County, for a total of 7,488.34 barrels, which is an average of 3,744.17 per producing well.
Pennsylvania unconventional production map. Click the expanding arrow icon in the top right to gain access to additional functionality.
Waste
There are three layers in this map, all of which are based on the most recent unconventional waste report. First, there is a generalized layer, which shows the location of the wells producing waste, but does not have any specific content. This layer exists to improve map performance at the statewide level. If you zoom in past 1:500,000 (a view showing several counties), then the generalized layer disappears, and the data become available by clicking on any of the wells that reported waste production. Finally, there is a layer of facilities that received the waste. If you click on one of the industrial icons, it will bring up the aggregated waste that was received by that facility, and included information on how that waste was disposed of (i.e., injection wells or landfills). To see the list of disposal methods and their abbreviations, please click on the expanding arrows in the top right of the map below, then the “About” icon on the toolbar.
Pennsylvania unconventional waste production map. Click the expanding arrow icon in the top right to gain access to additional functionality.
As a mapmaker, I am vexed by some rendering issues with this map that have not yet been fully resolved. For each of the three county layers, all counties reporting zero production are supposed to draw transparently, and one of the largest producing counties of gas, Bradford, is supposed to be opaque. While this map remains stylistically unsatisfactory, the data remain accurate. Here is a screen shot of what the map is supposed to look like when showing gas data:
Hopefully, this issue will be resolved shortly.
https://www.fractracker.org/a5ej20sjfwe/wp-content/uploads/2025/09/2025-Wordmark-Logo.png00Matt Kelso, BAhttps://www.fractracker.org/a5ej20sjfwe/wp-content/uploads/2025/09/2025-Wordmark-Logo.pngMatt Kelso, BA2012-11-12 14:16:552020-07-21 10:40:37PA Waste and Production Maps Available on FT’s FracMapper
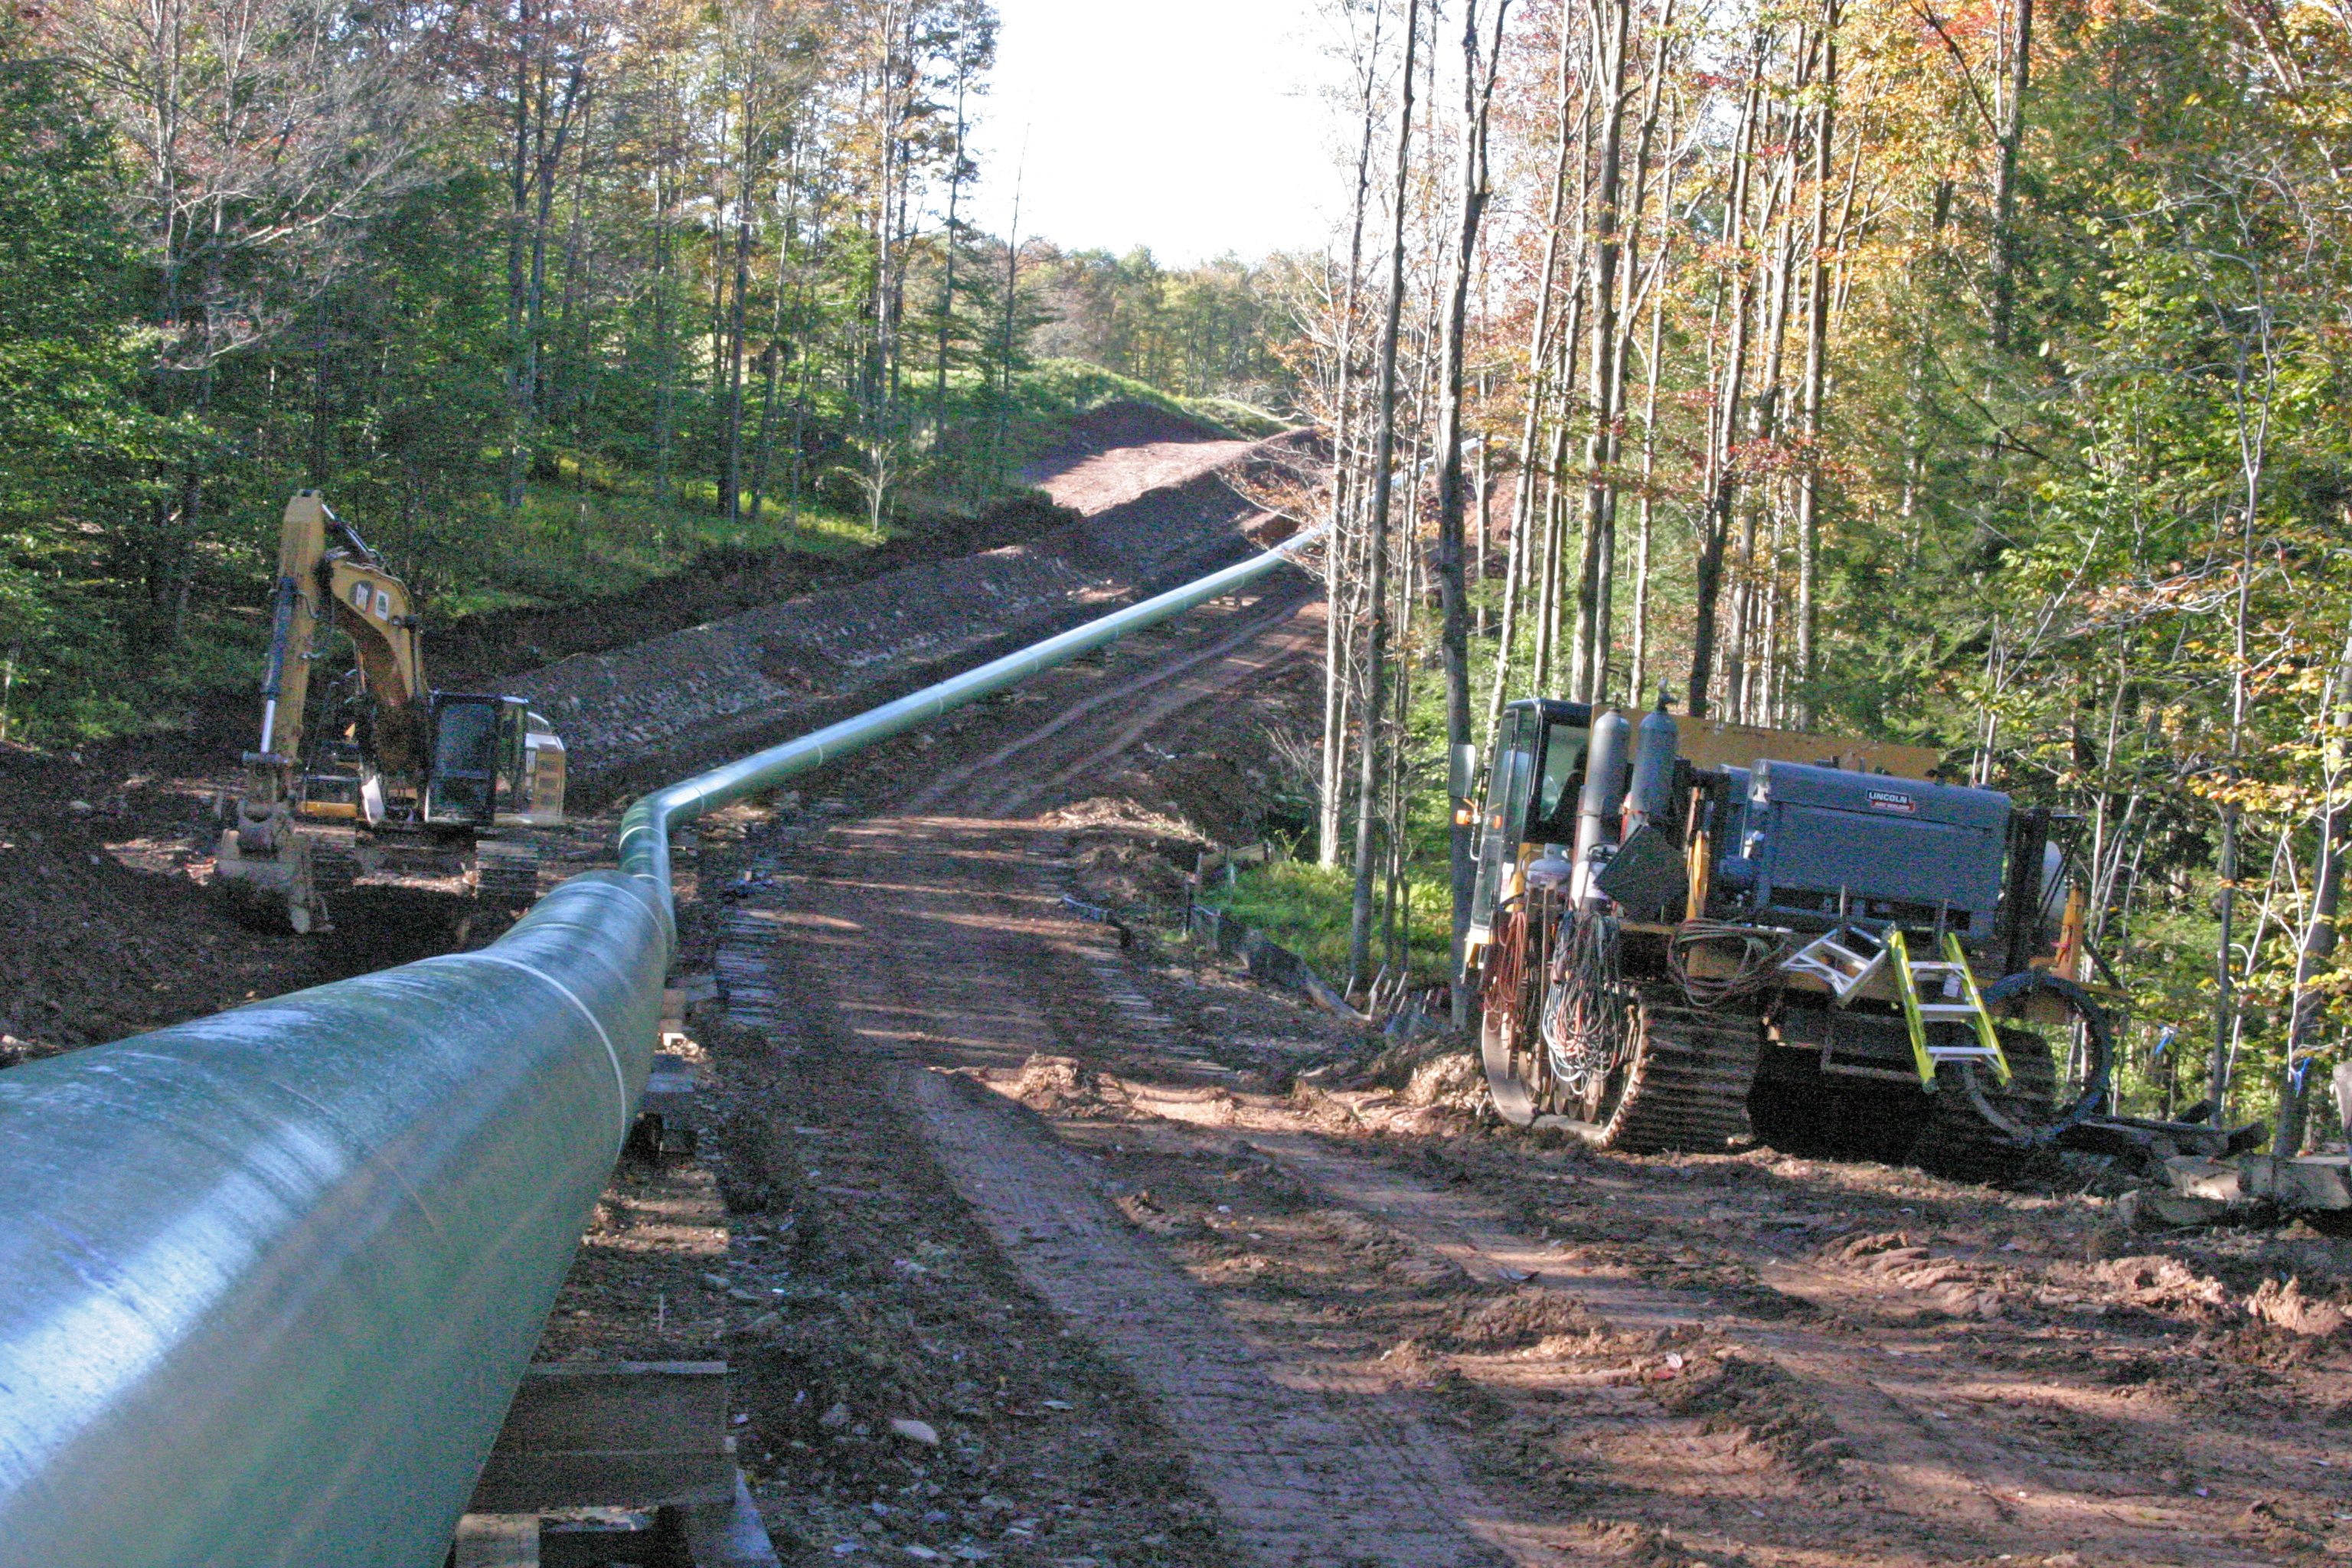
As summer transitioned into fall, and as winter knocks on our doorsteps in PA, I would like to take some time to summarize the preliminary feedback coming in through our pilot Trail Logbook Project. The project, for those of you who aren’t familiar, is a collaboration between Keystone Trails Association (KTA) and FracTracker Alliance. With the expansion of unconventional natural gas extraction into our state forests, we wanted to understand the experiences of people who are using those areas for recreation – and to document the change in those experiences as drilling continues. Most of the results of the project so far indicate that drilling is having a small, but notable effect on the traditionally tranquil experiences of hikers, bikers, and the like across the Commonwealth. The most common complaints are those of noise and degradation of scenery (see complete list ofLogbook reports below, or trail alerts on KTA’s website). Some people who entered information into the Logbook have noted that gas-drilling opponents have actually contributed to the degradation of the local scenery with graffiti and protest signs.
Given the number of hikers and other outdoor enthusiasts that frequent the Commonwealth every year, we need more people to report back to us in order to make a comprehensive and accurate statement about the overall impacts that drilling may be having on some of PA’s most beautiful natural resources. Perhaps there are no more issues to report, or perhaps people just don’t know who to tell. Regardless, we hope to expand our efforts to promote the project, which includes working with trail organizations in other states where shale gas activities may conflict with trail use.
On a side note, the lack of awareness about the Logbook and the state of drilling in popular recreation areas are key reasons why we are hosting a series of media tours this fall. The first was held on October 25th in Loyalsock State Forest due to the conerns of environmental concervation groups and residents about the communication barriers in existence between DCNR, the natural gas industry, and the public. If you are interested in participating in one of the next two tours, learn more here.
The full list of Logbook complaints to-date and the main areas impacted by unconventional natural gas extraction activity according to those reports are listed below:
Complaints from Logbook
Visual Degradation of Scenery
Anti-gas drilling graffiti
Flagging tape indicating seismic testing or road widening littered the area, called into question the “leave no trace” character of the trail
Intense construction activity and clearings for pipelines
Noise Pollution
Constant noise from compressor station
Helicopters
Construction and well pad noise
Safety
Seismic Testing: One hiker found 2 red wires with labels “Danger Explosives” portruding up from the ground
Seismic Testing: Equipment left right on the trail
Convenience
Trail relocation (4 miles)
Flagging tape caused confusion regarding the direction of trail
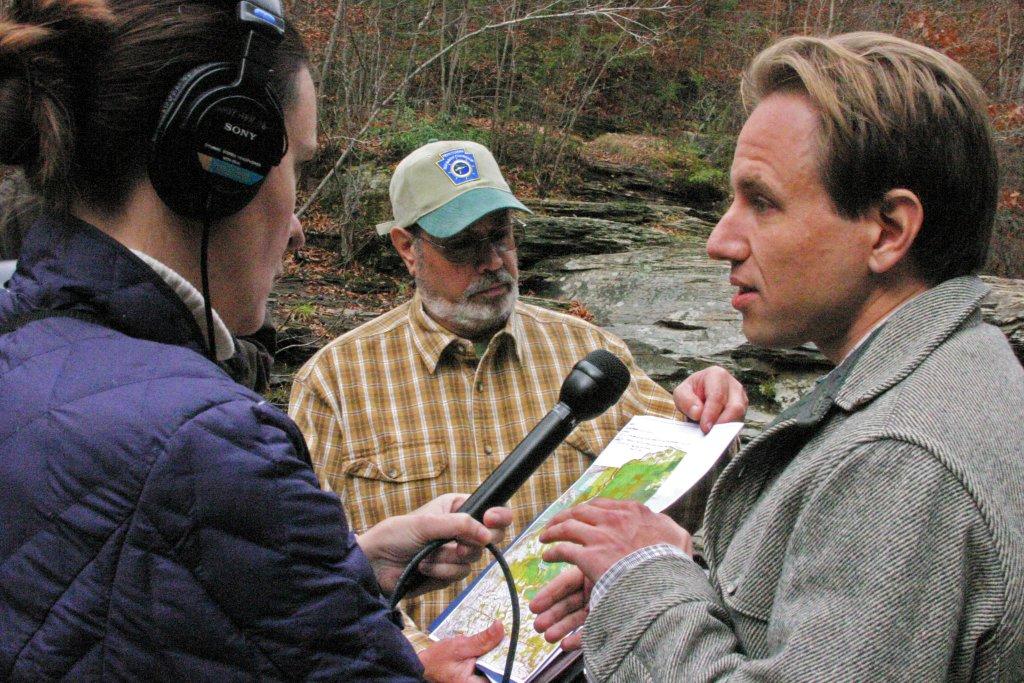
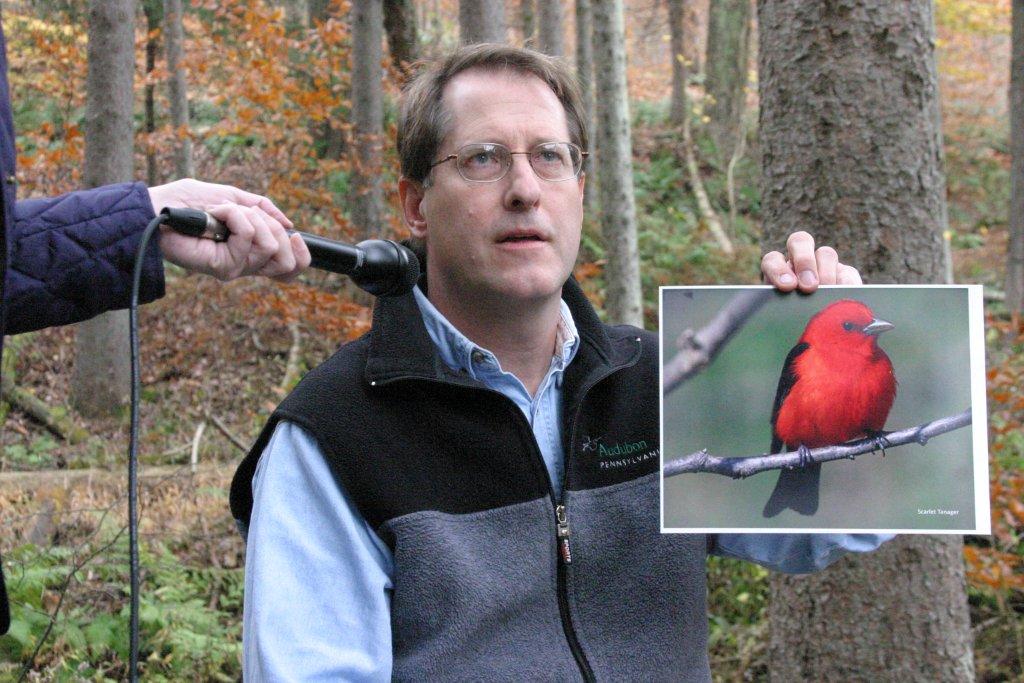
Event Notice: FracTracker Alliance would like to invite members of the media to participate in one of our media tours scheduled for the fall of 2012 in northeastern Pennsylvania. These tours are made possible through the support of the Foundation for Pennsylvania Watersheds and the William Penn Foundation.
As part of our mission to educate and inform the public about shale gas issues, these tours are designed to highlight specific lesser-known impacts of the drilling industry and familiarize reporters and journalists about the work of FracTracker Alliance and our website’s mapping and data capabilities.
The first tour occurred on Thursday, October 25th and addressed forest and wildlife considerations in Loyalsock State Forest. This event included a driving tour with guest speakers: Ephraim Zimmerman (Western PA Conservancy), Paul Zeph (Audubon), Dick Martin (PA Forest Coalition), Curt Ashenfelter (Keystone Trails Association) and Mark Szybist (PennFuture). A follow up to that media tour will be posted on FracTracker soon, but in the meantime check out the photos below:
Note these dates and topics for the next two fall tours:
Friday, November 16 – New perspectives on water quality impacts
Thursday, November 29 – Challenges to agriculture
There is a $10 fee (check made payable to the Community Foundation for the Alleghenies) if you would like us to provide you with a bagged lunch for future tours. Otherwise the events are free, including transportation by van during the tour, but registration is required. Please email Samantha Malone to save your seat on the next trip: malone@fractracker.org.
Additionally, starting in November 2012, we will be distributing a bi-weekly e-newsletter specifically designed for the media featuring grassroots stories, maps, and data that may be of use in writing your own articles. Sign up to receive the e-newsletter below:
https://www.fractracker.org/a5ej20sjfwe/wp-content/uploads/2025/09/2025-Wordmark-Logo.png00FracTracker Alliancehttps://www.fractracker.org/a5ej20sjfwe/wp-content/uploads/2025/09/2025-Wordmark-Logo.pngFracTracker Alliance2012-10-31 16:44:022020-07-21 10:40:37Fall Media Tours
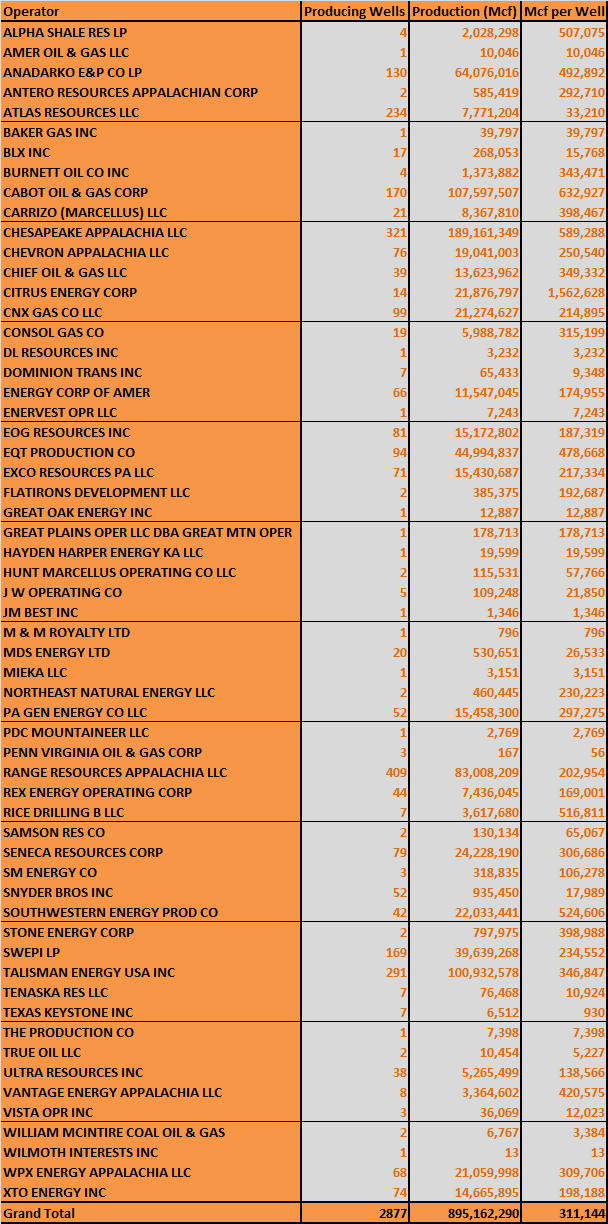
A visitor to our site recently asked about the amount of shale gas produced in Pennsylvania by operator. The following table contains data from the first six months of 2012, summarized by operator. It includes the number of wells showing gas production, the total sum of gas produced, and the average production of each operator’s producing wells. The dataset was downloaded on October 30, 2012, which is important to note, as it is sometimes updated without notice.
The results vary tremendously. There could be numerous reasons for this, including the age and location of the wells. This table does not take into consideration condensate or oil production, however those categories are rare in Pennsylvania’s Marcellus Shale and other unconventional wells.
https://www.fractracker.org/a5ej20sjfwe/wp-content/uploads/2025/09/2025-Wordmark-Logo.png00Matt Kelso, BAhttps://www.fractracker.org/a5ej20sjfwe/wp-content/uploads/2025/09/2025-Wordmark-Logo.pngMatt Kelso, BA2012-10-30 22:00:092020-07-21 10:40:37Production Data by Operator for PA’s Unconventional Wells
The Pennsylvania Department of Environmental Protection (PADEP) maintains datasets that are updated nightly for permits, drilled wells, and violations. It seems like it should be a fairly simple task to find totals and trends in this data, but this isn’t always as straight-forward as one might hope.
For example, on the permits data that I downloaded from PADEP on October 22, 2012, there were 13,847 entries, but only 10,512 unique wells as defined by their eight digit API number. This part is explainable, since additional permits are required for alterations to existing wells, but then there is the PADEP workload report, which counts 11,819 permits issued through October 12, 2012–a number that is obviously altogether different.
The drilled wells dataset used to be similarly afflicted, but the data now seem to be cured of that malady. However, the drilled wells had another issue: In January of this year, the Post-Gazette reported that there were hundreds of wells on the production dataset that were not on the drilled wells list, which is problematic because we’ve not yet figured out how to get the gas out of the ground without drilling a well first. At any rate, there is some reason to believe that this issue has been addressed–at least in part–as there are now records of more historical drilled unconventional wells than there used to be.
Which takes us to violations. The obstacle here is that there are often numerous issues that are encountered on an inspection, and the data show that PADEP hasn’t always been consistent in how it has handled that fact. While it does seem clear that PADEP counts violations by the number of discrete violation ID numbers that have been issued, sometimes those numbers have been used to apply to more than one issue found at a well. In addition, sometimes a single violation seems to apply to more than one well (perhaps at the same wellpad), and then sometimes there are enforcement actions that go along with violations, which generates a new line of data in the report. The net result is that the violations data that I downloaded on October 26, 2012 had 4,696 rows of data, which contained 4,064 violation ID numbers. Unlike permits and drilled wells, the workload report (see above) does not tally violations for multiple years, so that comparison is not available.
Given all of this, we can now see why questions such as, “How many unconventional gas permits have been issued in Pennsylvania?” are less straight-forward than one would hope. It also creates a challenge when trying to analyze the data that is based on such questions, while minimizing skew.
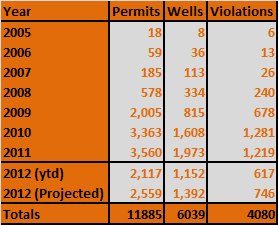
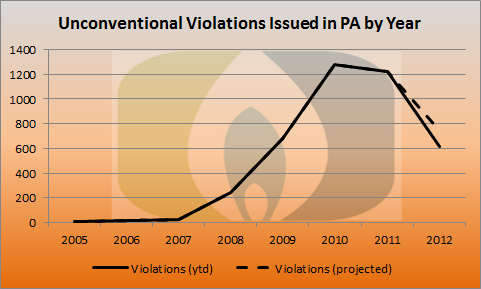
In order to look at long-term trends we need a consistent approach, so I developed a simple strategy to tackle these questions: use the summary information provided by PADEP from the dataset queries. Results may therefore not reflect what I think to be an optimal representation of events on the ground, but they are totals produced by PADEP that have been obtained in a uniform manner. For each year, I searched for all unconventional records between New Year’s Day and New Year’s Eve, except for 2012 of course, where I used today’s date. Here are those results:
Unconventional gas activity in Pennsylvania, with 2012 year to date totals and projections
The projected totals, for those who are curious, are based on the fact that October 29th is the 302nd day of the year, and multiplying the year to date totals by the inverse of the percentage of time elapsed in the year (365/302). The projected total for each category is down substantially from 2011 totals. Let’s take a closer look at each one:
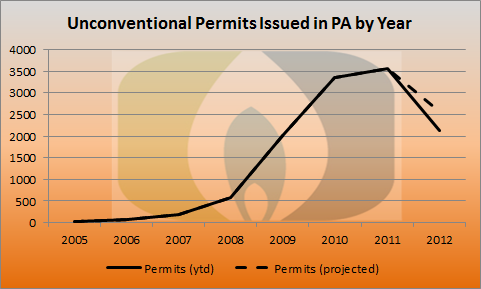
Permits issued by year
At the current rate, there will be 1001 fewer permits for unconventional oil and gas wells issued in 2012 as the year before, a reduction of 28%. This was widely predicted due to the low price of natural gas earlier in the year. That price has now rebounded back to $3.81. It remains to be seen whether permit counts rebound as well.
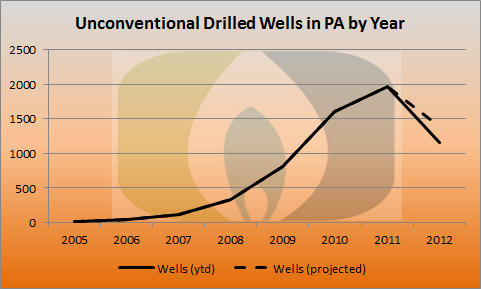
Drilled wells per year
This graph looks pretty similar to the permits, with the exception that all of the total values are lower. 2012 is on pace to have 581 fewer wells drilled statewide than 2011, a 29% reduction, presumably for much the same reason as permits.
Violations issued per year
The number of violations peaked in 2010, so there may be some reason for the reduction other than the fact the industry itself is in a phase of contraction. Pennsylvania is on pace for 473 fewer violations that last year, which is a 39% drop. What these numbers cannot tell us is why. Is it a result of better performance in the field or less rigorous inspection by an administration with long-standing ties to the industry, or both?
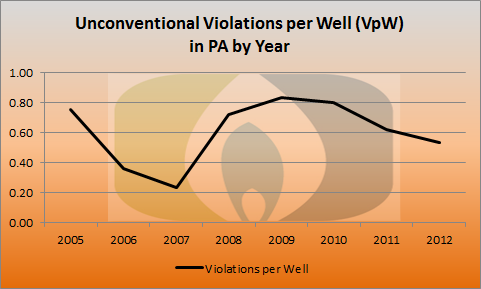
Violations per drilled well, by year
Since 2010, I’ve taken periodic looks at the number of violations issued divided by the number of wells drilled. It is a somewhat simplistic but effective way to conduct a cost-benefit analysis of impact by various operators, geographies, or in this case, time. The 2012 rate of 0.54 violations per drilled well is down 13% from last year, and 36% from the peak in 2009. This chart also has a huge dip in the years 2006 and 2007, at a time when the number of wells being drilled was small but growing rapidly.
https://www.fractracker.org/a5ej20sjfwe/wp-content/uploads/2025/09/2025-Wordmark-Logo.png00Matt Kelso, BAhttps://www.fractracker.org/a5ej20sjfwe/wp-content/uploads/2025/09/2025-Wordmark-Logo.pngMatt Kelso, BA2012-10-29 17:29:442020-07-21 10:40:37Trends in PA Data for Unconventional Wells