Trends in PA Data for Unconventional Wells
The Pennsylvania Department of Environmental Protection (PADEP) maintains datasets that are updated nightly for permits, drilled wells, and violations. It seems like it should be a fairly simple task to find totals and trends in this data, but this isn’t always as straight-forward as one might hope.
For example, on the permits data that I downloaded from PADEP on October 22, 2012, there were 13,847 entries, but only 10,512 unique wells as defined by their eight digit API number. This part is explainable, since additional permits are required for alterations to existing wells, but then there is the PADEP workload report, which counts 11,819 permits issued through October 12, 2012–a number that is obviously altogether different.
The drilled wells dataset used to be similarly afflicted, but the data now seem to be cured of that malady. However, the drilled wells had another issue: In January of this year, the Post-Gazette reported that there were hundreds of wells on the production dataset that were not on the drilled wells list, which is problematic because we’ve not yet figured out how to get the gas out of the ground without drilling a well first. At any rate, there is some reason to believe that this issue has been addressed–at least in part–as there are now records of more historical drilled unconventional wells than there used to be.
Which takes us to violations. The obstacle here is that there are often numerous issues that are encountered on an inspection, and the data show that PADEP hasn’t always been consistent in how it has handled that fact. While it does seem clear that PADEP counts violations by the number of discrete violation ID numbers that have been issued, sometimes those numbers have been used to apply to more than one issue found at a well. In addition, sometimes a single violation seems to apply to more than one well (perhaps at the same wellpad), and then sometimes there are enforcement actions that go along with violations, which generates a new line of data in the report. The net result is that the violations data that I downloaded on October 26, 2012 had 4,696 rows of data, which contained 4,064 violation ID numbers. Unlike permits and drilled wells, the workload report (see above) does not tally violations for multiple years, so that comparison is not available.
Given all of this, we can now see why questions such as, “How many unconventional gas permits have been issued in Pennsylvania?” are less straight-forward than one would hope. It also creates a challenge when trying to analyze the data that is based on such questions, while minimizing skew.
In order to look at long-term trends we need a consistent approach, so I developed a simple strategy to tackle these questions: use the summary information provided by PADEP from the dataset queries. Results may therefore not reflect what I think to be an optimal representation of events on the ground, but they are totals produced by PADEP that have been obtained in a uniform manner. For each year, I searched for all unconventional records between New Year’s Day and New Year’s Eve, except for 2012 of course, where I used today’s date. Here are those results:
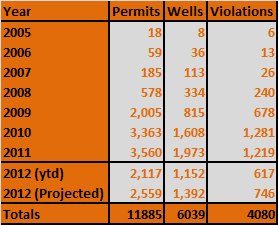
Unconventional gas activity in Pennsylvania, with 2012 year to date totals and projections
The projected totals, for those who are curious, are based on the fact that October 29th is the 302nd day of the year, and multiplying the year to date totals by the inverse of the percentage of time elapsed in the year (365/302). The projected total for each category is down substantially from 2011 totals. Let’s take a closer look at each one:
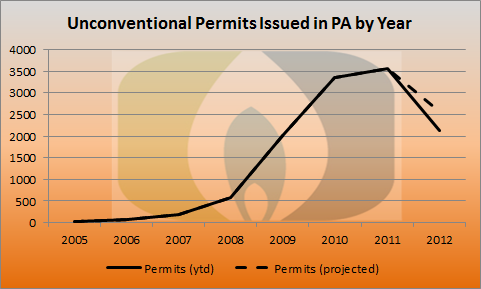
Permits issued by year
At the current rate, there will be 1001 fewer permits for unconventional oil and gas wells issued in 2012 as the year before, a reduction of 28%. This was widely predicted due to the low price of natural gas earlier in the year. That price has now rebounded back to $3.81. It remains to be seen whether permit counts rebound as well.
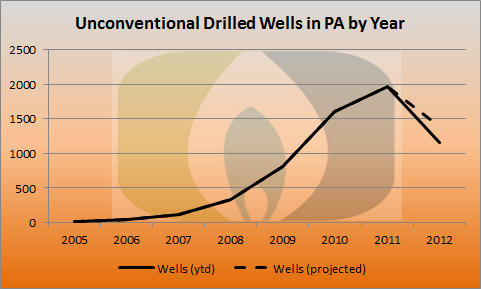
Drilled wells per year
This graph looks pretty similar to the permits, with the exception that all of the total values are lower. 2012 is on pace to have 581 fewer wells drilled statewide than 2011, a 29% reduction, presumably for much the same reason as permits.
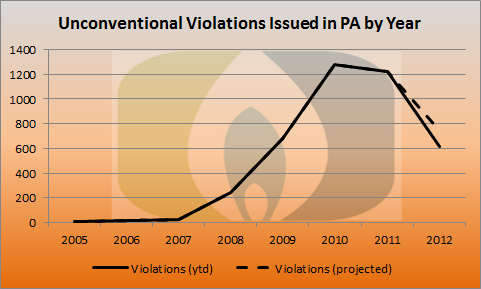
Violations issued per year
The number of violations peaked in 2010, so there may be some reason for the reduction other than the fact the industry itself is in a phase of contraction. Pennsylvania is on pace for 473 fewer violations that last year, which is a 39% drop. What these numbers cannot tell us is why. Is it a result of better performance in the field or less rigorous inspection by an administration with long-standing ties to the industry, or both?
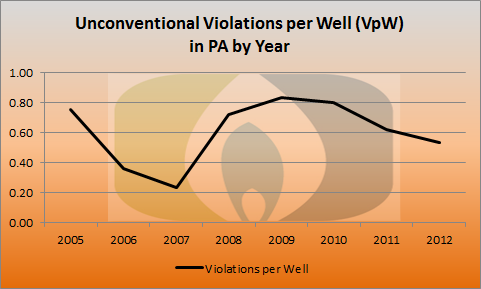
Violations per drilled well, by year
Since 2010, I’ve taken periodic looks at the number of violations issued divided by the number of wells drilled. It is a somewhat simplistic but effective way to conduct a cost-benefit analysis of impact by various operators, geographies, or in this case, time. The 2012 rate of 0.54 violations per drilled well is down 13% from last year, and 36% from the peak in 2009. This chart also has a huge dip in the years 2006 and 2007, at a time when the number of wells being drilled was small but growing rapidly.
Matt – I couldn’t agree more w/the previous post. Thanks so much!
Your work and the information you are providing is great, thank you.