Exploring North Dakota’s Bakken Formation on FracMapper
A new North Dakota map is now available on FracTracker. It joins content from New York, Ohio, Pennsylvania, and West Virginia in our efforts to make data concerning mineral extraction from shale more accessible and understandable.
In this embedded view of the North Dakota map, users can pan and zoom. For full featured control, click the expanding arrows icon (top right of map) to access the map directly.
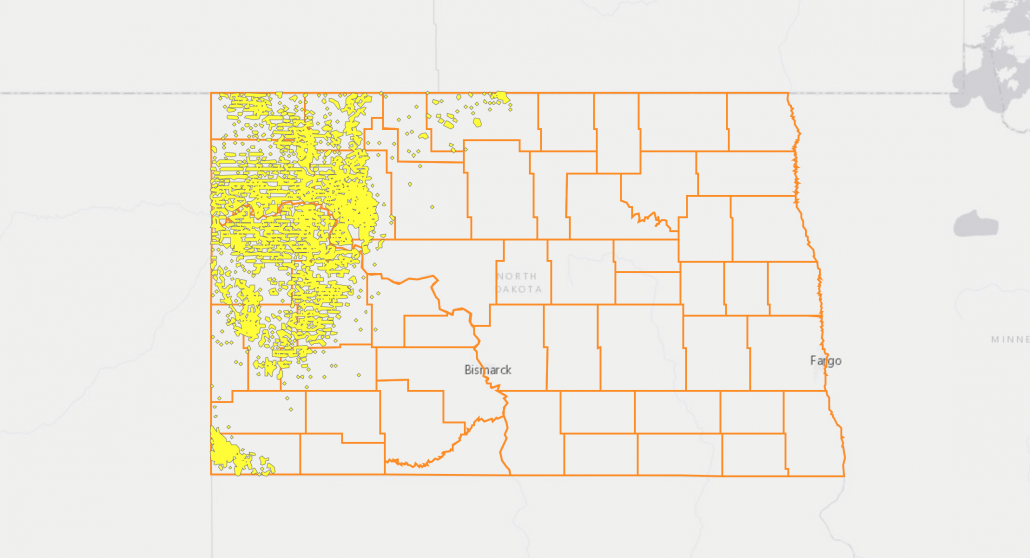
The area drawn in yellow in the western portion of the state is a generalized layer of activity for the Bakken formation. It was created to help with map performance and accuracy at scales ranging from statewide to 1:750,000, or about the size of a county. Once you zoom in beyond that level, the generalized layer goes away, and some interesting content becomes available.
A screen capture of the North Dakota map
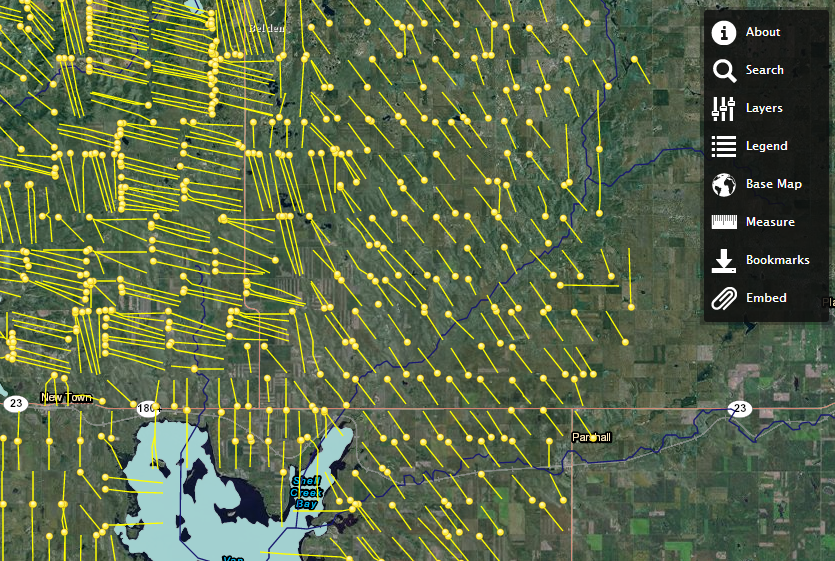
In the screen capture above, I zoomed in past 1:750,000, so the producing wells are visible, as well as a layer of horizontal laterals that are associated with the wells, a feature that few states make available. The location was chosen at random from the Bakken region, however, if you would like to see a similar view, click the “Search” tool and then type “New Town, ND” into the text box. I have also changed the basemap to show a satellite image by selecting “Imagery with Labels” from the base map selector.
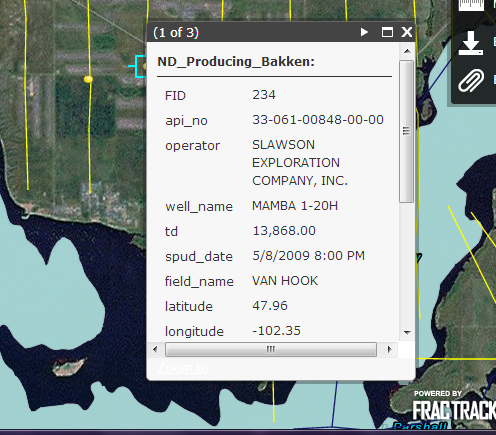
Close up of “Mamba 1-20H” well
Each feature, or item on the map, has different data associated with it. I’ve clicked on a well at random to bring up the data pop up box. Because the data is controlled at the state level, there are often substantial differences in the types of data that are available. In North Dakota, we can see the cumulative total of oil, gas, and waste water production by scrolling through these pop up boxes. Units of measure are not provided, but they are assumed to be barrels for oil and waste water, and thousands of cubic feet (Mcf) for gas.
At the very top of that box, there is a gray bar with the text “(1 of 3)”. This means that multiple features are selected. Viewers can scroll through them by clicking the arrow icon on the gray bar. Viewers can reduce the number of selected items by zooming in and making layers inactive. To change the layers, just click on “Layers” in the main toolbar, and click the checkboxes next to each layer to select or de-select the various available choices. Please recall that some layers are scale dependent, so they are not available at all times.
For more information about the Bakken formation and the layers available on the map, please click the “About” icon on the main toolbar.
Are you planning on including the Montana side of things as well? That would be very helpful!