A Year in the Life of Ohio’s Utica Play
|
The Ohio Utica play has taken off in the last calendar year, jumping from 160 permitted wells as of March 2012 to 453 since then. This equates to 1.24 permitted wells per day. (Note: The state’s less exploited Marcellus shale had 13 permitted wells a year ago with an increase of 7 since then.) A year ago Ohio was home to 50 “drilled” wells and is now home to an additional 80 “drilled” wells (Figure 1). Meanwhile 0.65% and 1.14% of permitted wells are what Ohio Department of Natural Resources (ODNR) calls “Inactive” or “Not Drilled” with the latter being relatively similar a year ago vs. today with 3 and 4 “Not Drilled” wells, respectively. According to the latest ODNR data 54 Utica wells were permitted as of 4/1/2012 vs. 342 since then. Plugged wells constitute 1.63% of all Ohio Utica wells although the industry appears to be increasing efficiency with respect to plugging having experienced 7 “Plugged” wells as of 4/1/2012 and only 3 since. Conversely, wells that are “Producing” have declined from 25.63% (41 “Producing” wells) of all permitted wells to 1.32% (6 “Producing” wells) of all permitted wells since then with the latest reported producing well being a Mountaineer Keystone well in Windham Township, Portage County. The permitting process has continued along its exponential path since permitting began September 28, 2010 (Figure 2). The gross average number of permitted Ohio Utica wells per month in the last five months is 39 with a total of 195 permitted since November 2012. The quarterly permit average has increased by an order of magnitude of 4.2 permits per month between September 2010 and 2011 to 39 per month since September 2012. In recent months Washington county was added to the list of Ohio counties home to Utica hydraulic fracturing permits, while Carroll remains the state with the most Utica permits followed by Harrison, Columbiana, Guernsey, and Jefferson/Noble with the average number of Utica well permits across the 22 counties home to at least one permit being 28 per county with six counties above and sixteen below this mean (Figure 3). In the last year the four counties that have entered the Utica conversation are Trumbull, neighboring Holmes and Wayne, and Washington, with 4, 3, 1, and 1 Utica permit as of April 1st, respectively. Meanwhile five other counties have seen no increase in Utica permits including Muskingum, Knox, Ashland, Geauga, and Medina. Conversely Belmont County has seen a 21-fold increase in Utica well permits followed distantly by Harrison, Guernsey, Noble, and Coshocton counties all of which have experienced ≥5-fold increases. The average number of people per Utica well across the aforementioned 22 counties is 31,808, while the average number of wells per square mile is 0.066. The range is quite broad for both variables ranging from 0.0018 wells per square mile in Wayne – home to the Wayne National Forest – to 0.59 wells per square mile in Carroll County, with the one recent Washington County well placing it 13th out of 22 counties. The inverse is the case for people per well with Medina County, home to the highest number of people relative to Utica well permits with 172,332 people per well (vs. 124-563 people per well in Carroll, Harrison, Noble, and Monroe counties). Since last we conducted this type of analysis in late January the valuation of Ohio’s major Utica players has actually increased by 11.7%. This is a particularly complex situation considering that Atlas Noble the owner of 6 Utica wells has actually gone private for a variety of reasons and Chesapeake Energy has ousted its CEO Aubrey McClendon due to “philosophical differences and a pending SEC investigation. Meanwhile, Wall Street-types: … expect well results to vary greatly, given 2012 drilling activity across many fringe areas of the play. We believe weak results from other operators are likely to validate that Gulfport remains the most exposed operator. Source Additionally, the repeated delay in 2012 production numbers scheduled for the 1st of April is creating layer upon layer of uncertainty leaving everyone guessing and relying on 2011 production numbers. This leaves public sentiment worried about the unsustainability, uncoordinated, and unbalanced nature of both Ohio’s regulatory framework and highly Utica exposed and/or leveraged balance sheets. Meanwhile Wall Street analysts are contemplating whether market forces, expectations, reality, or collusion is to blame. Our current model of potential Utica production in the form of barrels of oil equivalent speaks to small and discrete highly productive zones in Belmont, Noble, Guernsey, Morgan, and Muskingum counties, rather than the originally estimated zones of highest production in Carroll and Columbiana. An additional hotspot appears to be located in Fairfield, Perry, and Hocking counties. However, due to insufficient data quantity, quality, and methodology, and transparency from ODNR and industry, the opportunities to conduct such exercises are still accompanied by substantial uncertainty in the form of high signal-to-noise resulting from scant and unreliable data. The hope, herein and on Wall Street, is that ODNR and industry will begin to make their production data available in real-time. This is an especially important consideration given that the aforementioned regulatory environment here in Ohio – as well as the relatively generous severance taxing system[1] – has reached a point that even industry/supply-side think tanks like The Fraser Institute in Canada have determined “the extent of investment barriers (based on All-Inclusive Composite Index values)” are as good as they are ever going to get; Ohio trails only Mississippi in a global investment barrier ranking of 146 countries, US states, and Canadian provinces. Furthermore, in one year the conditions for doing largely hydrocarbon-related business in Ohio improved so much between 2010 and 2011 that Ohio jumped up the league tables from 12th to 2nd, according to the institute’s 2011 “Global Petroleum Survey.” This loosening of regulations, combined with decreasing data quality and availability, is the primary concern of The FracTracker Alliance in Ohio. |
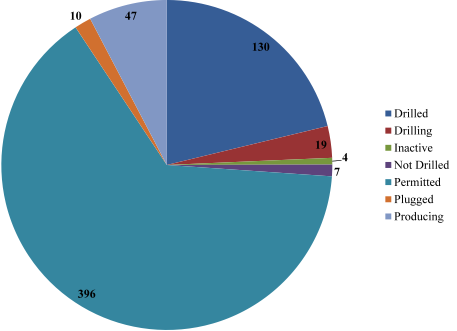 Figure 1: Utica Permit activity by status to April 1, 2013  Figure 2. Cumulative and Per Month Utica Permits to September 2010 through March 2013  Figure 3. Utica Permit Count by County from September 28, 2010 to April 1, 2013  Figure 4. Utica Permits Per Square Mile and People Per Well by County from September 28, 2010 to April 1, 2013 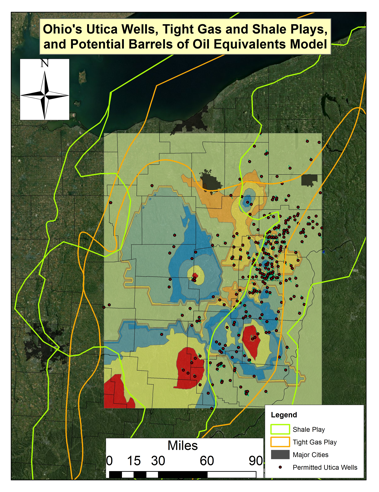 Figure 5. A map of the current Ohio Shale and Tight Gas Plays, hydraulic fracturing permits in Ohio as of 4/1/2013, and a generalized model of potential production from with light green representing 20 Barrels of Oil Equivalent (BOE) and red approximately 10,000 BOE |
Table 1. Distribution of Ohio Utica Shale wells across companies (#, %), Date of First Permit (DFP), and the valuation of the publicly funded companies at their DFP at the close of business 4/9/2013.
|
Company Valuation |
||||||
|
Company |
# |
% |
DFP† |
Share Price DFP |
Share Price 4/9/2013 |
% Change |
|
Anadarko• |
12 |
0.019 |
09/07/2011 |
69.88 |
86.70 |
1.241 |
|
Antero |
21 |
0.034 |
03/23/2012 |
|||
|
Atlas Noble†† |
6 |
0.010 |
09/24/2012 |
31.14 |
||
|
Carrizo |
2 |
0.003 |
07/26/2012 |
24.02 |
26.26 |
1.093 |
|
Chesapeake Energy• |
389 |
0.626 |
12/23/2010 |
25.61 |
19.99 |
0.781 |
|
Chevron Appalachia |
2 |
0.003 |
07/31/2012 |
109.58 |
118.71 |
1.083 |
|
Consol Energy• |
25 |
0.040 |
06/17/2011 |
45.86 |
33.85 |
0.738 |
|
Devon Energy |
13 |
0.021 |
11/02/2011 |
65.46 |
55.28 |
0.844 |
|
Eclipse Resources |
1 |
0.002 |
12/21/2012 |
— |
— |
|
|
Enervest• |
16 |
0.026 |
06/30/2011 |
9.37 |
8.79 |
0.938 |
|
EQT |
3 |
0.005 |
09/13/2012 |
57.76 |
69.59 |
1.205 |
|
Gulfport Energy• |
46 |
0.074 |
02/28/2012 |
35.49 |
48.09 |
1.355 |
|
Halcon |
2 |
0.003 |
11/02/2012 |
5.003 |
7.69 |
1.537 |
|
Hall Drilling |
1 |
0.002 |
09/17/2012 |
|||
|
Hess Ohio |
24 |
0.039 |
09/28/2010 |
53.63 |
73.50 |
1.371 |
|
HG Energy |
16 |
0.026 |
09/14/2011 |
— |
— |
— |
|
Hilcorp Energy |
3 |
0.005 |
12/14/2012 |
— |
— |
— |
|
Mountaineer Keystone |
7 |
0.011 |
07/13/2012 |
— |
— |
— |
|
PDC Energy• |
9 |
0.014 |
05/25/2012 |
25.67 |
47.59 |
1.854 |
|
R E Gas Development• |
13 |
0.021 |
03/19/2012 |
— |
— |
— |
|
Sierra Resources |
3 |
0.005 |
07/02/2012 |
— |
— |
— |
|
SWEPI |
1 |
0.002 |
06/20/2012 |
— |
— |
— |
|
XTO Energy |
5 |
0.008 |
04/09/2012 |
0.28 |
0.01 |
0.036 |
|
BP |
1 |
0.002 |
03/20/2013 |
|||
|
613 |
1.083 |
|||||
† DFP = Date of First Permit; “—“ not a publicly traded company
†† Atlas Noble has since gone private
• Corporations that have reported production numbers as of this post: 1) Anadarko – 3, 2) Chesapeake – 14, 3) Consol Energy – 1, 4) Enervest and PDC Energy – 2, 5) Gulfport – 10, R E Gas Development – 4.
[1] Ernst & Young in a 2011 report found that Ohio’s hydrocarbon taxing rates were the most favorable of the eight states they investigated with a total state and local tax of 1.8% vs. 10.9-11.0% in neighboring West Virginia and Oklahoma, respectively. The average across the seven other states was 9.2% or 5.12 times that of The Buckeye State.