PA Releases Unconventional Production and Waste Data
The Pennsylvania Department of Environmental Protection (DEP) releases unconventional oil and gas production and waste data twice a year. It is important to note that both datasets are self-reported from the industry, and there are usually a few operators who miss the reporting deadline. For that reason, FracTracker usually waits a week or so to capture the results of the fashionably late. However, after looking at the data, it is likely that there are still operators that have not yet reported.
Production
Production is perhaps the most important metric of the oil and gas industry. After all, if there were no production, there would be no point in drilling in the first place. Royalty payments for property owners are based on production values from the wells. More than that though, it can be an indication of hot spots, and to some degree, which operators are better at getting the product out of the ground than the rest of the field.
Location
Unconventional formations–especially the Marcellus Shale and Utica Shale–underlie about two-thirds of Pennsylvania. However, that does not mean that if an operator drilling a hole in Clarion County can expect the same result as well in Sullivan County, for example. Production is unevenly distributed throughout the state:
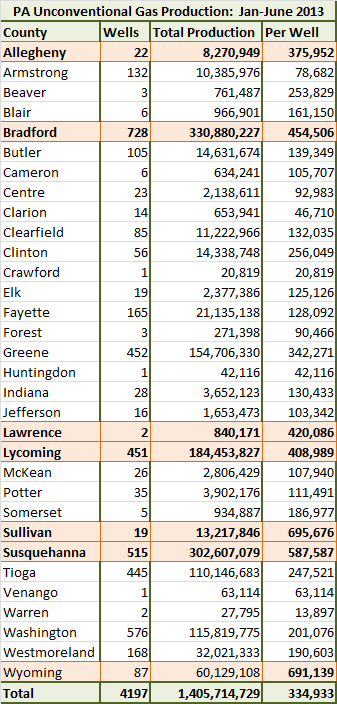
Unconventional gas production in Pennsylvania from January to June 2013. All production values are in thousands of cubic feet (Mcf). Counties with above average production per well are highlighted in orange.
With 1.4 trillion cubic feet of gas production in half a year from unconventional wells, Pennsylvania has become a major leader in production. For a quick comparison to other regions of the country, see the Energy Information Administration, (although the EIA has apparently not felt inspired to update their data in a while).
It should be noted that there is also oil and condensate production from unconventional wells in Pennsylvania, although that really amounts to a drop in the barrel, so to speak. Unlike the Bakken, where gas is seen as a byproduct that is routinely flared because there is no infrastructure ready to accept it, the Marcellus and Utica in Pennsylvania are really all about the gas. Some of the gas from the western part of the state is considered wet, with heavier hydrocarbons like ethane and propane mixed with the methane, but in terms of this report, there is no distinction between wet gas and dry gas, or pure methane. Eight out of 17 wells producing oil and 430 out of 505 wells producing condensate are located in Washington County.
Operators
The reason that production values are more telling for geographies than for operators is that most operators in Pennsylvania are limited to select portions of the state, where their leasing strategies were focused. Therefore, certain companies occupy the regions that yield higher production, while others are left trying to extract from less productive areas. So looking at production by operator does not necessarily reflect their skill at extraction, but it does does give a general impression of how much one of their wells is likely to produce, which could be useful for people trying to negotiate leases, among other considerations.
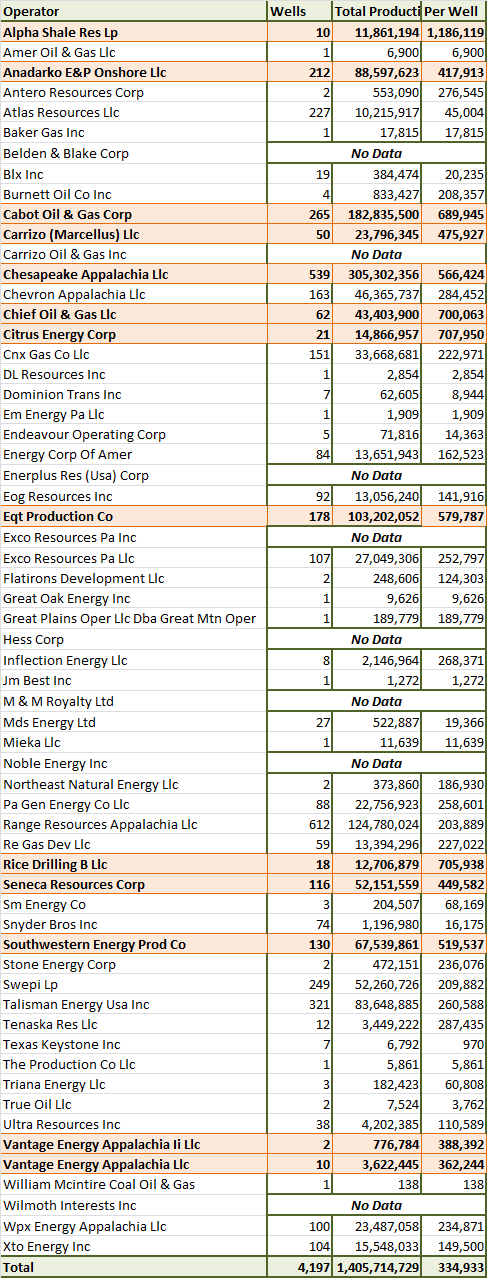
Unconventional gas production by operator in Pennsylvania from January to June 2013. All production values are in thousands of cubic feet (Mcf). Operators with above average production are highlighted in orange.
Note that eight operators on the list have no data. Presumably, there are the operators that have not yet reported their data to the DEP, although it is possible that some of them could be defunct. Obviously, any missing data here would also be missing from the county totals. Alpha Shale is the clear leader in terms of production per well, with about 1.2 million Mcf per well. Citrus, Rice, and Chief occupy the next teir, with each exceeding an average of 700,000 Mcf. All four are relatively minor operators, however, with fewer than 100 wells reporting production. In terms of total production, Chesapeake blows the competition out of the water, with roughly the same production as the next two producers (Cabot and Range) combined.
Waste
Along with all of the profitable gas being produced in Pennsylvania comes all of the various waste products that are created in the process. Before jumping into the numbers, I’d like to point out that it is likely that operators who have not reported production also have not reported their contribution to the waste. In its current form, the waste report has 12,604 lines of data from 4,991 different unconventional wells. Here is a summary of the waste produced by type from unconventional formations in Pennsylvania:
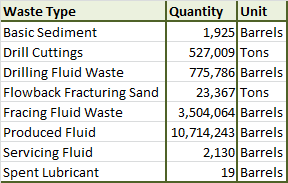
Waste reported from unconventional wells in Pennsylvania from January to June 2013. Note that one barrel equals 42 US gallons.
Some interesting things are revealed when sorting the waste type data by operator, although the resulting table is a little unweildy, even for me. But here are a few highlights:
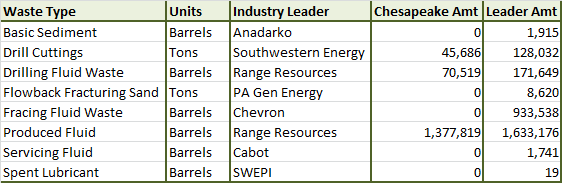
- Anadarko reported 99.5 percent of basic sediment production
- Southwestern Energy produced more than twice as much drill cuttings (128,000 tons) as the next highest operator (Cabot: 50,000 tons)
- Range Resources led the pack with 172,000 barrels of drilling fluid, with Chevron Appalachia (168,000 barrels) close behind
- PA Gen Energy had the most flowback fracturing sand reported, with over 8,600 tons, despite having fewer than 100 producing wells.
- Chevron Appalachia produced the most fracing fluid waste (934,000 barrels), with Range Resources coming in at number two (773,000 barrels). This is what Pennsylvania calls the flowback fluid; this is not the straight chemical additives that used in the hydraulic fracturing process, but those additives are included in this fluid
- The most produced fluid, or formation brine, came from Range Resources wells (1.6 million barrels), followed by Chesapeake (1.4 million barrels)
- 82 percent of the servicing fluid reported was from Cabot (1,741 barrels)
- 100 percent of the spent lubricant was reported by SWEPI (19 barrels)
Amazingly, despite their overwhelming lead in gas production in the state, Chesapeake Appalachia did not have the most of any of the eight different waste types, and in some cases, were not even close:
Waste produced by Chesapeake Appalachia and the industry leader in each category from unconventional wells in PA between January and June 2013
The Pennsylvania waste data is also notable for including the disposal method of the waste:
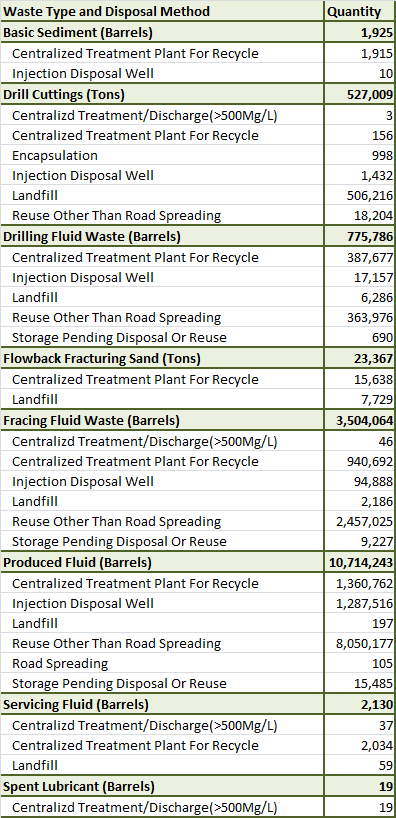
Disposal method for unconventional waste from PA between January and June 2013
And for those who can handle one last table, Pennsylvania also tells us where the waste is disposed:
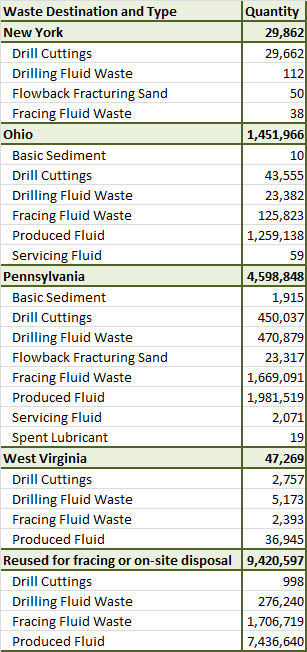
Destination of unconventional oil and gas waste in PA between January and June 2013, by state
Thank you very much for posting this information,
and summarizing it for us.
Your role in keeping us informed is greatly appreciated.