Violations per Well Among PA Operators
People often want to know which operators perform the best (or worst) among their peers in terms of adhering to the laws set forth in a given state. In principle, the easiest metric for determining this is to look at the ratio of violations issued per well, or VpW.
However, in order to make that analysis, we would obviously need to have violations data. Unfortunately, out of the twenty states that we have shale viewers for on FracMapper, we only have violations data for Arkansas, Colorado, and Pennsylvania, with the latter being far and away more robust and complete when compared to the other two. We have been told that the data is also available for North Dakota as well, if we are willing to pay for it, so we might be able to perform a VpW analysis for the Peace Garden State in the near future.
Then, of course, there is the realization that, “What is a violation?” is actually somewhat of a philosophical question in Pennsylvania. In the past, I’ve determined that the Pennsylvania Department of Environmental Protection (PADEP) uses the number of unique violation ID numbers issued to calculate their totals. However, historically, the department would often lump several issues that showed up on the Compliance Report together under the same violation ID. Others have taken to looking at Notices of Violations (NOV’s), which are more limited in number. Still others exclude any violations marked as being administrative in nature, an idea that makes sense superficially, but a closer look at the data shows that the label is extremely misleading. For example, “Pits and tanks not constructed with sufficient capacity to contain pollutional substances” is an administrative violation, as is, “Improper casing to protect fresh groundwater”.
In addition to all of that, the cast of operators is constantly shifting as new operators come on board, old ones get bought out by rivals, joint ventures are formed between them, and the like. Sometimes a parent company will shift the active operator status to one of its subsidiaries, so wells that were originally Consol will then be listed under CNX, for example.
In terms of violations per well, there is a further complication, in that all of the drilled wells data reflect the current custodians of the wells, whereas the violations data reflect those that received the violations. The result is that there are records issued for Turm Oil (really!) for wells where Chesapeake is now listed as the operator. In some respects, this makes sense: why should Chesapeake carry the burden of the legacy mistakes of Turm in their compliance record?
But it does make analysis somewhat tricky. My approach has been to combine operators that are obviously the same parent company, and to do the analysis in several different ways, and over different time frames. Who’s ready for some numbers?
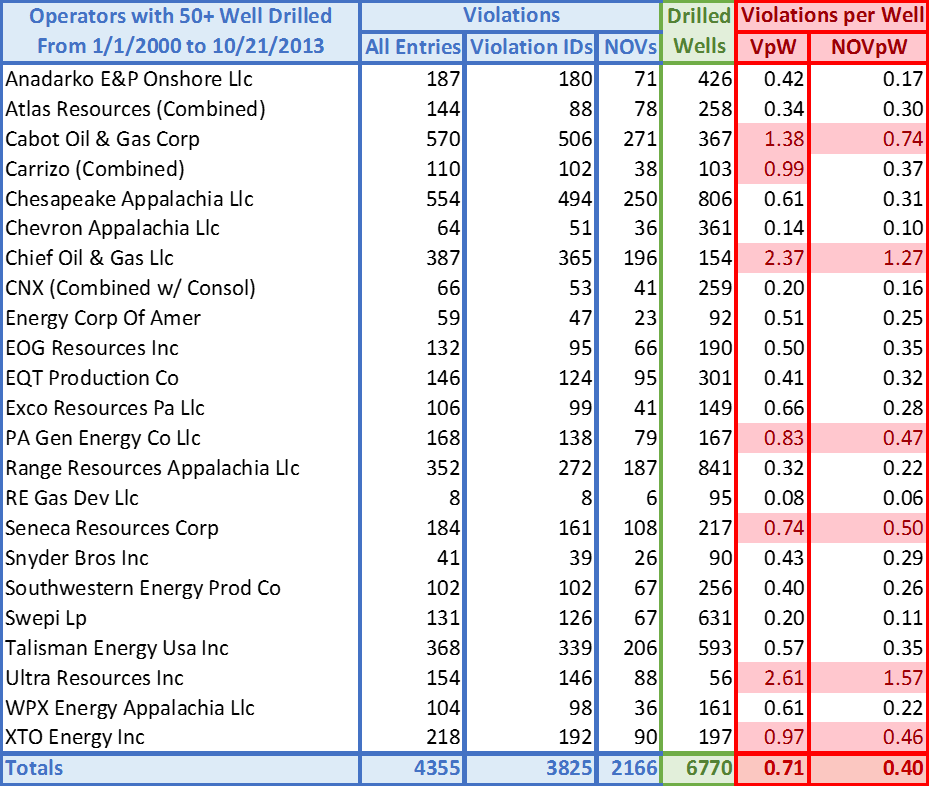
Violations per Well (VpW) for operators of unconventional wells in Pennsylvania with 50 or more wells. Those operators with scores higher than the average of their peers are highlighted in pink.
Here, violations per well are based on the number of violation ID’s issued, where as NOVpW is based on the number of Notices of Violations. The date range for this table is from January 1, 2000 through October 21, 2013, and please note that the totals represent those that are included on the chart, not statewide totals. A lot of violations are lost of the shuffle when we look at only the largest current operators, but it also helps eliminate some of the noise that can be generated with small sample sizes, as well as with the inconsistencies described above. Here’s a look at data from this year:
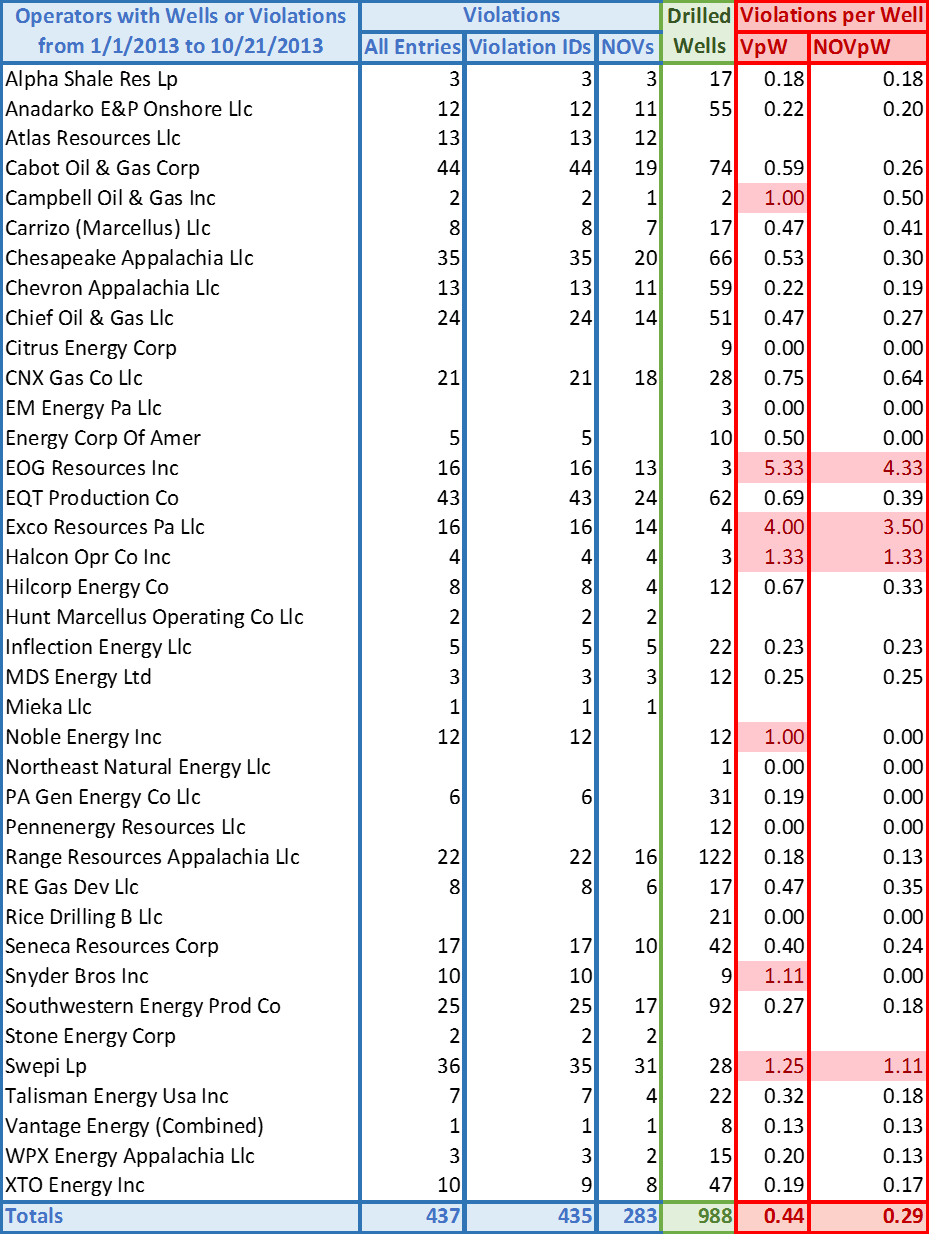
Violations per Well (VpW) for operators with unconventional wells in Pennsylvania in 2013, through October 21. Those operators with scores higher than on violation per well or NOV per well are highlighted in pink.
Notice that the highest violations per well and notices of violations per well scores are much higher than the data aggregated since 2000, whereas the statewide averages of the two scores are actually much lower. The former is almost certainly attributable to having a smaller sample size, but there is something else at play with the latter:
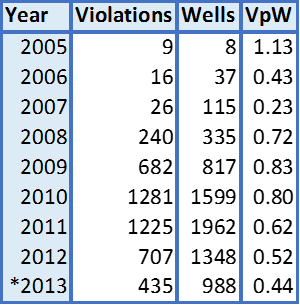
Violations per well of Pennsylvania’s unconventional wells. 2013 data through 10/21/2013.
The number of violations per well drilled has been steadily decreasing since 2009, and it is now down to an average of less than one violation issued per every two wells. There is nothing in the data that indicates why this is the case, however.
Note: This post was edited on 12/18/2013. The table showing operators violations per well and NOV’s per well in 2013 originally stated that that values higher than the average of their peers are highlighted in pink. In fact, only those with values of 1.00 or higher are highlighted in that fashion.
What constitutes as a “violation” is it an accident, a permitting issues, a spill/leak?
The reason that the violations have decreased in the last year is because now the DEP can only issue violations after they have been approved by top administrators who take their marching orders from the governor’s office. $1.8M apparently buys a lot of regulatory favor in PA.
http://shalejustice.org/
I’ve been trying to understand why a class action lawsuit hasn’t been filed against the frackers. Clearly the frackers appear to be in violation of the constitutional right residents have to the reasonable enjoyment of their property including above and below their “homesteads”….no more or no less than a resident has protection from pollution caused by aircraft. Yea, like the war on tobacco it could take 10-20 years… but our children need to understand they are our treasure and we’ll go to ‘war’ to protect their health and enjoyment of life. I’ll be on board to do voluntary research.
IT’s TIME!