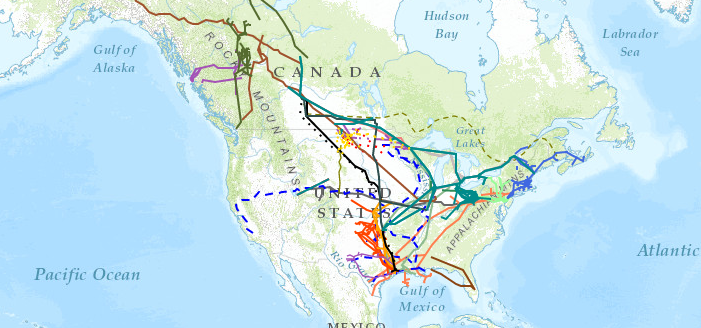
North American Pipeline Proposal Map
By Ted Auch, PhD – OH Program Coordinator, FracTracker Alliance
With all the focus on the existing TransCanada Keystone XL pipeline – as well as the primary expansion proposal recently rejected by Lancaster County, NB Judge Stephanie Stacy and more recently the Canadian National Energy Board’s approval of Enbridge’s Line 9 pipeline – we thought it would be good to generate a map that displays related proposals in the US and Canada.
North American Proposed Pipelines and Current Pipelines
To view the fullscreen version of this map along with a legend and more details, click on the arrows in the upper right hand corner of the map.
The map was last updated in October 2014.
Pipeline Incidents
The frequency and intensity of proposals and/or expansions of existing pipelines has increased in recent years to accompany the expansion of the shale gas boom in the Great Plains, Midwest, and the Athabasca Tar Sands in Alberta. This expansion of existing pipeline infrastructure and increased transport volume pressures has resulted in significant leakages in places like Marshall, MI along the Kalamazoo River and Mayflower, AR. Additionally, the demand for pipelines is rapidly outstripping supply – as can be seen from recent political pressure and headline-grabbing rail explosions in Lac-Mégantic, QC, Casselton, ND, Demopolis, AL, and Philadelphia.1 According to rail transport consultant Anthony Hatch, “Quebec shocked the industry…the consequences of any accident are rising.” This sentiment is ubiquitous in the US and north of the border, especially in Quebec where the sites, sounds, and casualties of Lac-Mégantic will not soon be forgotten.
Improving Safety Through Transparency
It is imperative that we begin to make pipeline data available to all manner of parties ex ante for planning purposes. The only source of pipeline data historically has been the EIA’s Pipeline Network. However, the last significant update to this data was 7/28/2011 – meaning much of the recent activity has been undocumented and/or mapped in any meaningful way. The EIA (and others) claims national security is a primary reason for the lack of data updates, but it could be argued that citizens’ right-to-know with respect to pending proposals outweighs such concerns – at least at the county or community level. There is no doubt that pipelines are magnets for attention, stretching from the nefarious to the curious. Our interest lies in filling a crucial and much requested data gap.
Metadata
Pipelines in the map above range from the larger Keystone and Bluegrass across PA, OH, and KY to smaller ones like the Rex Energy Seneca Extension in Southeast Ohio or the Addison Natural Gas Project in Vermont. In total the pipeline proposals presented herein are equivalent to 46% of EIA’s 34,133 pipeline segment inventory (Table 1).
Table 1. Pipeline segments (#), min/max length, total length, and mean length (miles).
|
Section |
# |
Min |
Max |
Mean |
Sum |
|
Bakken |
34 |
18 |
560 |
140 |
4,774 |
|
MW East-West |
68 |
5 |
1,056 |
300 |
20,398 |
|
Midwest to OK/TX |
13 |
13 |
1,346 |
307 |
3,997 |
|
Great Lakes |
5 |
32 |
1,515 |
707 |
3,535 |
|
TransCanada |
3 |
612 |
2,626 |
1,341 |
4,021 |
|
Liquids Ventures |
2 |
433 |
590 |
512 |
1,023 |
|
Alliance et al |
3 |
439 |
584 |
527 |
1,580 |
|
Rocky Express |
2 |
247 |
2,124 |
1,186 |
2,371 |
|
Overland Pass |
6 |
66 |
1,685 |
639 |
3,839 |
|
TX Eastern |
15 |
53 |
1,755 |
397 |
5,958 |
|
Keystone Laterals |
4 |
32 |
917 |
505 |
2,020 |
|
Gulf Stream |
2 |
541 |
621 |
581 |
1,162 |
|
Arbuckle ECHO |
25 |
27 |
668 |
217 |
5,427 |
|
Sterling |
9 |
42 |
793 |
313 |
2,817 |
|
West TX Gateway |
13 |
1 |
759 |
142 |
1,852 |
|
SXL in PA and NY |
15 |
48 |
461 |
191 |
2,864 |
|
New England |
70 |
2 |
855 |
65 |
4,581 |
|
Spectra BC |
9 |
11 |
699 |
302 |
2,714 |
|
Alliance et al |
4 |
69 |
4,358 |
2,186 |
4,358 |
|
MarkWest |
63 |
2 |
113 |
19 |
1,196 |
|
Mackenzie |
46 |
3 |
2,551 |
190 |
8,745 |
|
Total |
411 |
128 |
1,268 |
512 |
89,232† |
† This is equivalent to 46% of the current hydrocarbon pipeline inventory in the US across the EIA’s inventory of 34,133 pipeline segments with a total length of 195,990 miles
The map depicts all of the following (Note: Updated quarterly or when notified of proposals by concerned citizens):
- All known North American pipeline proposals
- Those pipelines that have yet to be documented by the EIA’s Natural Gas Pipeline Network mapping team
- EIA documented pipelines more accurately mapped to the county level (i.e., select northeastern pipelines)
- The current Keystone XL pipeline and the Keystone XL expansion proposal rectified to the county level in Nebraska, South Dakota, Oklahoma, and Texas
We generated this map by importing JPEGs into ArcMAP 10.2, we then “Fit To Display”. Once this was accomplished we anchored the image (i.e., georeferenced) in place using a minimum of 10 control points (Note: All Root Mean Square (RMS) error reports are available upon request) and as many as 30-40. When JPEGs were overly distorted we then converted or sought out Portable Network Graphic (PNG) imagery to facilitate more accurate anchoring of imagery.
We will be updating this map periodically, and it should be noted that all layers are a priori aggregations of regional pipelines across the 4 categories above.
Imagery sources:
- Northeast – Long Island Sound, Montreal to Portland, Westchester, Spectra Energy Northeast, Maritime Northeast-Algonquin-Texas Eastern, Delaware River Watershed, Northeastern accuracy of existing EIA data, New England Kinder Morgan, Spectra Energy-Tennessee Gas Pipeline Company (TGP)-Portland Natural Gas Transmission System (PNGTS)
- Duluth to The Dakotas, NYMarc Pipeline, Mariner East, Millenium Pipeline Company, WBI Energy’s Bakken,
- British Columbia – Enbridge, Spectra/BG, Coastal, Tanker Route
- Midwest – ATEX and Bluegrass, BlueGrass, BlueGrass Pipeline,
- TransCanada/New England – Portland, Financial Post,
- Alaska Pipelines Historically
- Rail projects and primary transport
- Keystone Tar Sands – Canada (website no longer active), United States, Texas-Oklahoma
- Gulf Coast – Florida
- MarkWest Houston, Liberty, Liberty, Houston and Majorsville,
- Texas Oklahoma – Granite Wash Extension,
- Ohio – Spectra Energy, Enterprise Products, Kinder Morgan, Buckeye-Kinder Morgan-El Paso, Chesapeake Energy and AEP
- The Rockies Express Pipeline (REX)
Reference
1. Krauss, C, & Mouawad, J. (2014, January 25). Accidents Surge as Oil Industry Takes the Train, The New York Times.
When will the above be updated? It is an extremely useful map
We update this map as we are made aware of pipeline proposals or discover them ourselves. However, if a proposal is publicized but no decent mapping sources are public we must wait until county or state level proposals are made public or sent to us by interested parties. You can plan on seeing updates at least twice a quarter.