Utica Shale Drill Cuttings Production – Back of the Envelope Recipe
By Ted Auch, OH Program Coordinator, FracTracker Alliance
Ohio is the only shale gas state in the Marcellus and/or Utica Shale Basin that has decided to go “all in.” i.e. The state is moving forward with shale gas production, Class II Injection Well disposal of brine waste from fracking, and more recently the processing and disposal of drill cuttings/muds via the state’s Solid Waste Disposal (SWD) districts and waste landfills. The latter would fall under the joint ODNR, ODH, and EPA’s September 18, 2012 Solidification and Disposal Activities Associated with Drilling-Related Wastes advisory. It occurred to us that it might be time to try to estimate how much of these materials are produced here in Ohio on a per-well basis using basic math, data gleaned from Ohio’s current inventory of Utica wells and the current inventory of PLAT maps, and some broad assumptions as to the density of Ohio’s geology.
Developing the Estimate
1) Start with a 341 Actual Utica well lateral dataset generated utilizing the ODNR Ohio Oil & Gas Well Database PLAT inventory or the current inventory of 1,137 permitted Utica wells. Generate a Straight Line lateral dataset by converting this data from “XY To Line” with the following summary statistics:
|
Variable |
Actual |
Straight Line |
|
# |
341 |
1,137 |
|
Minimum |
186 |
50 |
|
Maximum |
20,295 |
12,109 |
|
Sum |
2,196,856 |
7,190,889 |
|
Mean |
6,442 ±1,480 |
6,386 ±1,489 |
|
Median |
6,428 |
6,096 |
2) Average Vertical Depth for 109 Utica wells utilizing data from the ODNR RBDMS Microsoft Access database = 6,819 feet (207,843 centimeters)
Average Lateral + Vertical Footage = 13,205-13,261 total feet (402,488-404,195 centimeters) (Figure 1)
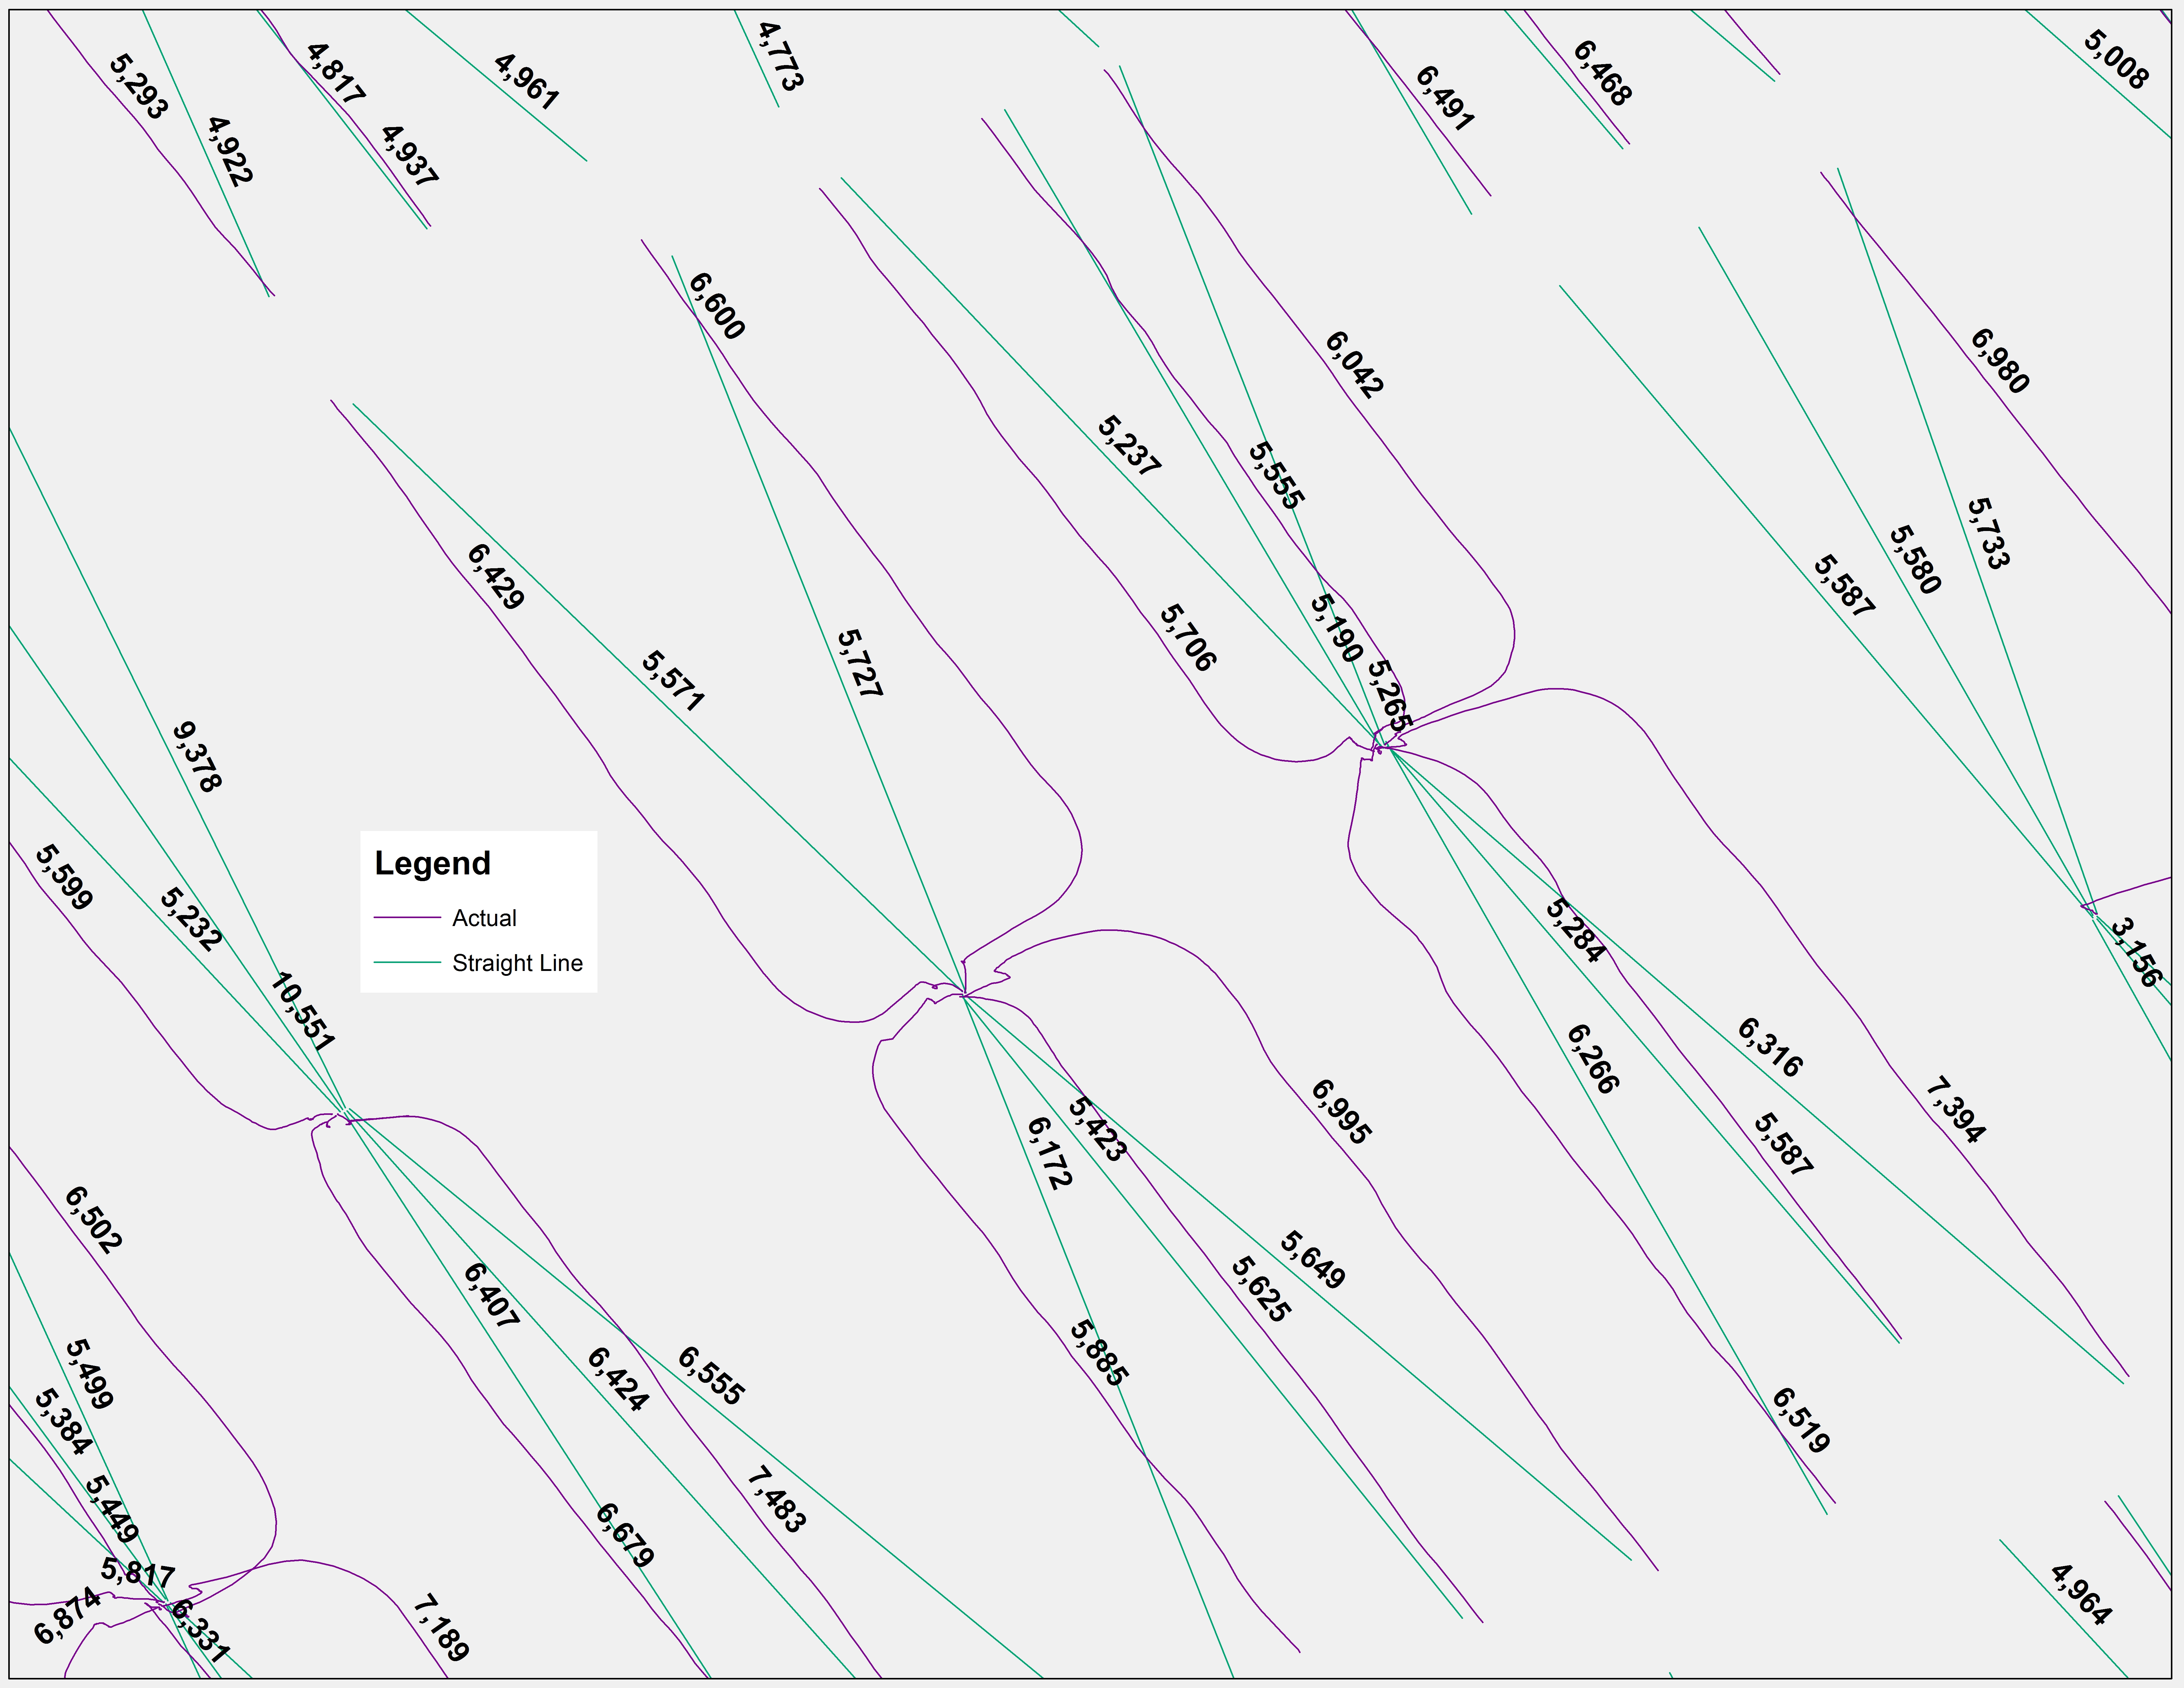
Fig. 1. An example of Actual and Straight Line Utica well laterals in Southeast Carroll County, Ohio
3) We assume a rough diameter of 8″ down to 5″ (20-13 centimeters) for all of 1) and 14″ to 8″ (36-20 centimeters) for the entirety of 2)
4) The density of 1) is roughly 2.61 g cm3 assuming the average of seven regional shale formations (Manger, 1963)
5) None of the materials being drilled through are igneous or metamorphic (limestone, siltstone, sandstone, and coal) thus the density of 2) is all going to be
≈2.75 g cm3
6) The volume of the above is calculated assuming the volume of a cylinder
(i.e., V = hπr2):
- Σ of Actual Lateral Length 49,205,721 cm3 * 2.61 g = 128,180,904 g
- Σ of Actual Lateral Length 153,991,464 cm3 * 2.75 g = 423,476,526 g
Average Lateral + Vertical Volume = 551,657,430 grams = 1,216,195 pounds =
608 tons of drill cuttings per Utica well * 829 drilled, drilling, or producing wells = 504,113 million tons
To put these numbers into perspective, the average Ohio household of 2.46 people generates about 3,933 pounds of waste per year or 1.78 metric tons.
7) Caveats include:
- The coarse assumptions as to density of materials and the fact that these materials experience significant increases in surface area once they have been drilled through.
- The assumptions as to pipe diameter could be over or underestimating drill cuttings due to the fact that we know laterals taper as they near their endpoint. We assume 45% of the vertical depth is comprised of 14″ diameter pipe, 40% 11″ diameter pipe, and 15% 8″ pipe. Similarly we assume the same percentage distribution for 8″, 6.5″, and 5″ lateral pipe.
Ohio Drilling Mud Generation and Processing
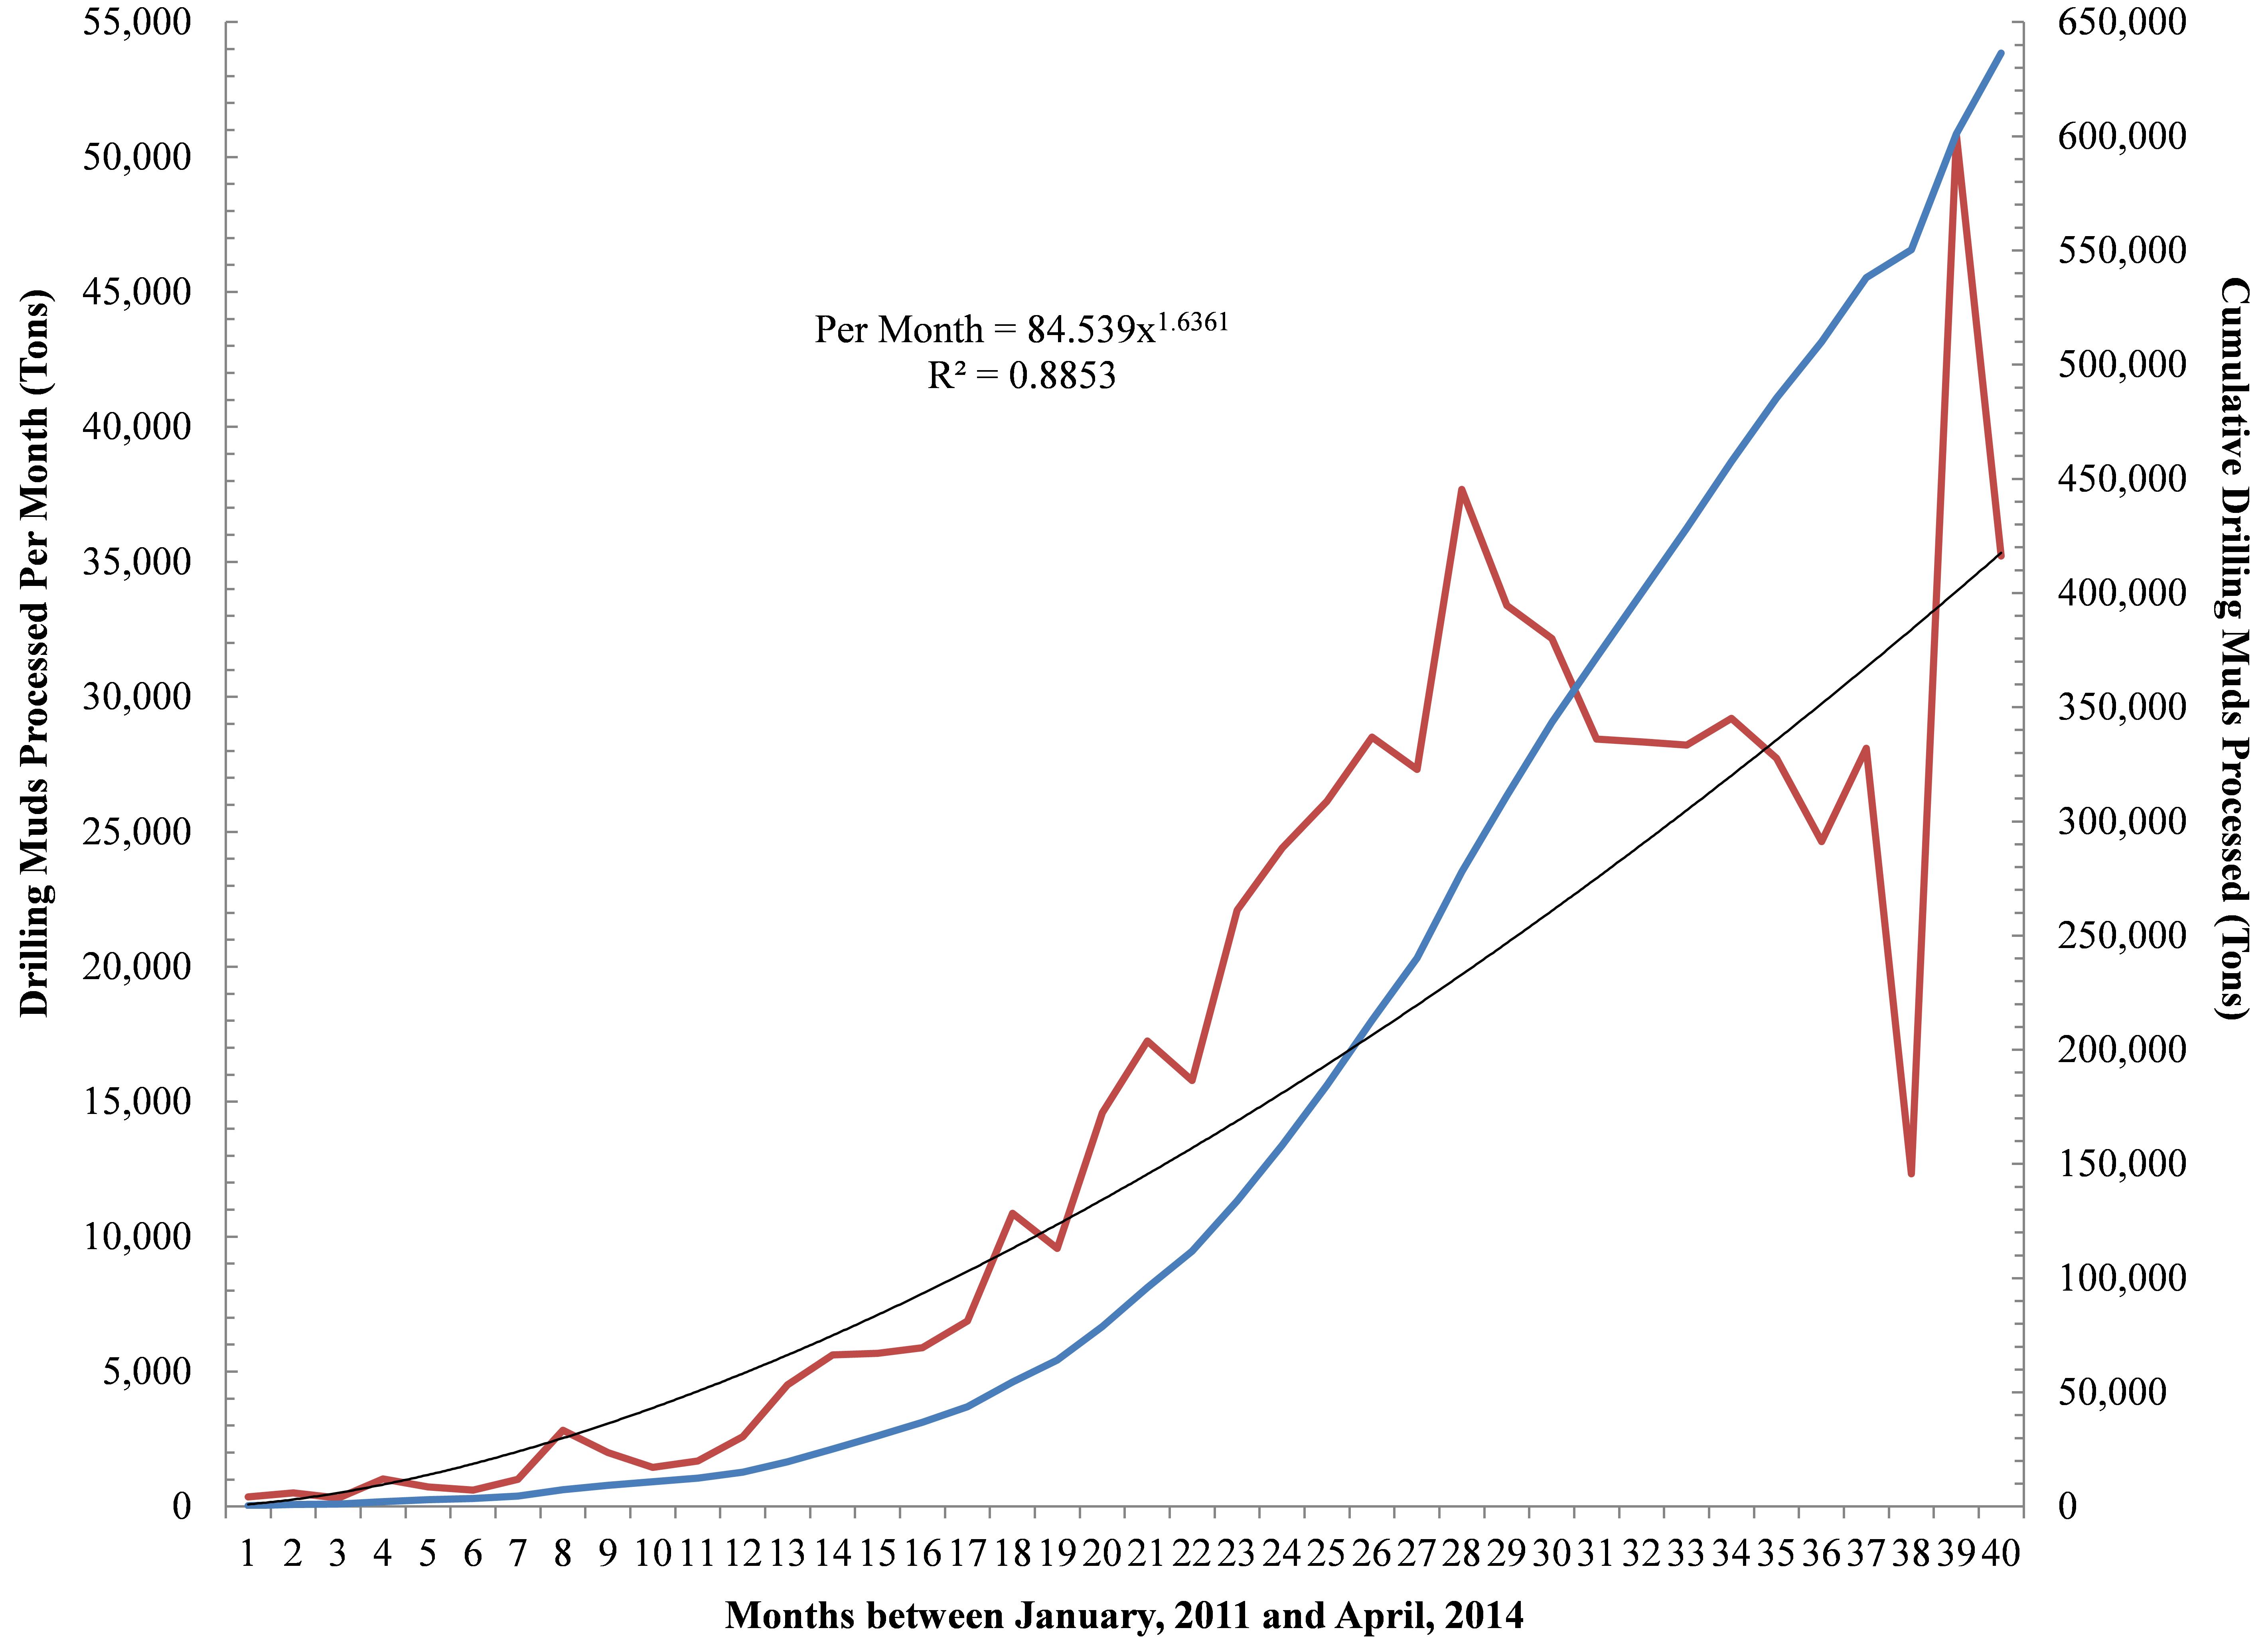
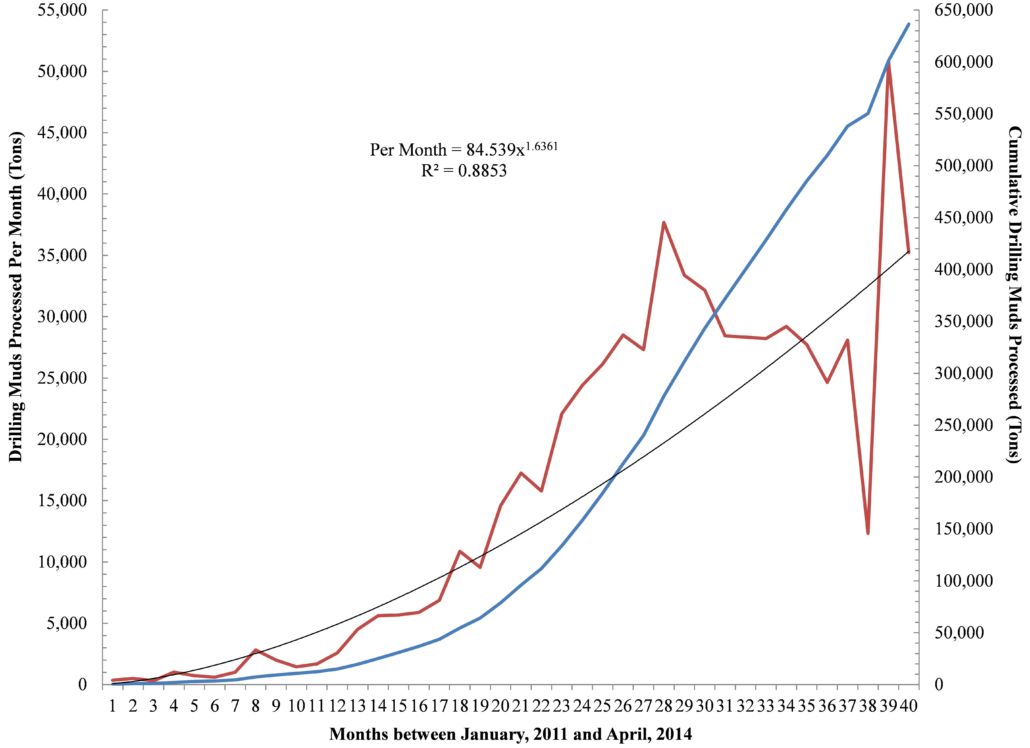
Fig. 2. Month-to-month and cumulative drilling muds processed by CCHSWD, one of six OH SWDs charged with processing shale gas drilling waste from OH, WV, and PA.
Ohio’s primary SWDs responsible for handling the above waste streams – from in state as well as from Pennsylvania and West Virginia – are the six southeastern SWDs along with the counties of Portage and Mahoning according to several anonymous sources. However, when attempting to acquire numbers that speak to the flows/stocks of fracking related SWD waste (i.e., drilling muds) the only district that keeps track of this data is the Carroll-Columbiana-Harrison Solid Waste District (CCHSWD). The CCHSWD’s Director of Administration was generous enough to provide us with this data. According to a month-over-month analysis they have processed 636,450 tons generating a fixed fee of $3.5 per ton or $2.23 million to date (Figure 2). This trend translates into a 1,046-1,571 ton monthly increase depending on how you fit your trend line to the data (i.e., linear Vs power functions) or put another way annual drilling mud increases of 12,546-18,847 tons.
Why is only one district ( Carroll-Columbiana-Harrison) keeping track of the data? Why are there only anonymous sources for the info about where this stuff is going? Who in our own district should we contact to try to find out more? Thanks.
Christine H.
1. Great question. Ohio SWDs charged with processing and disposing of fracking waste are not required to parse drilling muds and solids from related industrial waste per the Ohio Revised Code “3745-27-19 Operational criteria for a sanitary landfill facility.” (http://codes.ohio.gov/oac/3745-27-19). The folks at the SWD mentioned in this piece started to see nontrivial upticks in flows of muds and solids from the fracking boom and decided to take it on themselves to start collecting this critical data. We can thank their Director of Administration Barb Walton for the forethought required to establish this understanding. The Ohio EPA, DNR, and
2. Anonymous sources are the only ones we have because many in the industry are hesitant to talk on the record because of the revenue generated by drilling muds.
3. Contact your local SWD using the links here
http://epa.ohio.gov/portals/34/document/general/swmd_chair_list.pdf