Offshore oil and gas exploration federally approved

By Karen Edelstein, NY Program Coordinator

Right whale (Eubalaena glacialis) with calf

Background

Drilling in the Atlantic Ocean off the coast of the United States has been off-limits for nearly four decades. However, last Friday, the Obama administration’s Bureau of Ocean Energy Management (BOEM) opened the Atlantic outer continental shelf for oil and gas exploration starting in 2018, with oil production commencing in 2026. In a December 2013 report by the American Petroleum Institute (API) , API estimated that offshore exploration and federal lease sales could generate $195 billion between 2017 and 2035.

Problems for marine mammals, sea turtles, fish

Aside from the inherent risks of catastrophic drilling accidents similar to BP’s Deepwater Horizon in April 2010, open ocean oil and gas exploration can pose severe problems for marine life. Environmentalists have voiced alarm over the techniques used to explore for hydrocarbons deep below the ocean floor. Using “sonic cannons” or “‘seismic airguns,” pulses of sound are directed at the sea bottom to detect hydrocarbon deposits.

Underwater communication by marine mammals, such as whales and dolphins, relies on sound transmission over long distances — sometimes thousands of miles. These animals use sound to navigate, find mates and food, and communicate with each other. Noise pollution by common ships and supertankers is known to disrupt and displace marine mammals, but naval sonar has been documented as a cause of inner ear bleeding, hearing loss, tissue rupture, and beach strandings. According to the Ocean Mammal Institute:

These sonars – both low -frequency (LFAS) and mid -frequency can have a source level of 240 dB, which is one trillion times louder than the sounds whales have been shown to avoid. One scientist analyzing underwater acoustic data reported that a single low frequency sonar signal deployed off the coast of California could be heard over the entire North Pacific Ocean.

Natural Resources Defense Council also expressed concern over naval sonar: “By the Navy’s own estimates, even 300 miles from the source, these sonic waves can retain an intensity of 140 decibels – a hundred times more intense than the level known to alter the behavior of large whales.”

As destructive as naval sonar may be, oil and gas exploration sonic cannons–also known as seismic airguns– (at 216 – 230 dB) create disruptions to marine life many orders of magnitude greater. Fish and sea turtles are also affected, with catch rates of fish decreasing up to 70% when airguns were used in a commercial fishing area, according to a study by the Norwegian Institute of Marine Research.

The intensity and duration of the sonic cannon pulses during oil and gas exploration are an important factor in this equation. According to the Huffington Post, “The sonic cannons are often fired continually for weeks or months, and multiple mapping projects are expected to be operating simultaneously as companies gather competitive, secret data.” Collateral damage for the exploration is far from insignificant, the article continues:

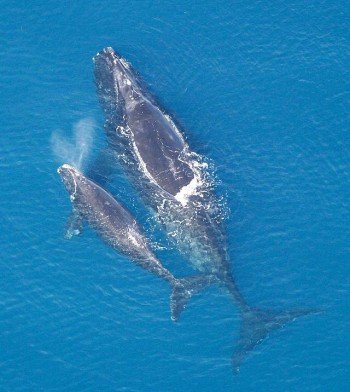
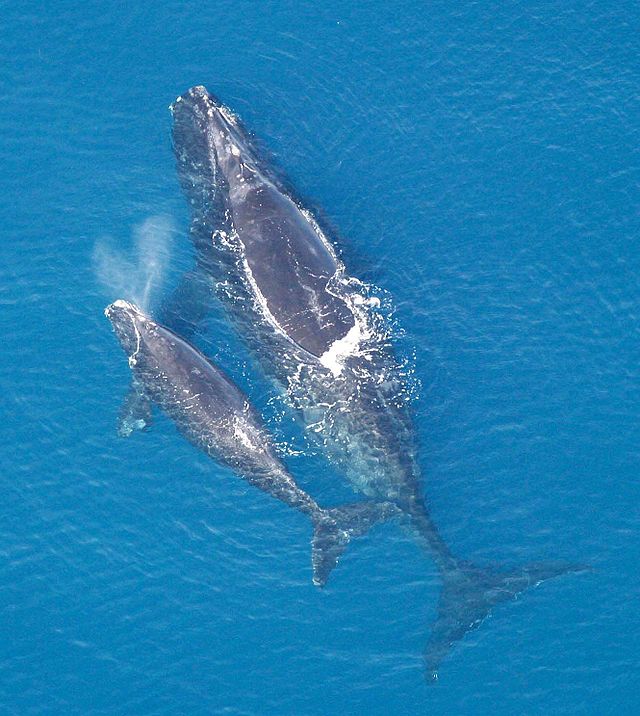
The bureau’s environmental impact study estimates that more than 138,000 sea creatures could be harmed, including nine of the 500 north Atlantic right whales remaining in the world. Of foremost concern are endangered species like these whales, which give birth off the shores of northern Florida and southern Georgia before migrating north each year. Since the cetaceans are so scarce, any impact from this intense noise pollution on feeding or communications could have long-term effects, Scott Kraus, a right whale expert at the John H. Prescott Marine Laboratory in Boston, said.

‘No one has been allowed to test anything like this on right whales,” Kraus said of the seismic cannons. “(The Obama administration) has authorized a giant experiment on right whales that this country would never allow researchers to do.’

North Atlantic right whales are one of the most endangered species of cetaceans in the world.

Map of ranges of marine mammals potentially affected and towns opposing sonic cannon exploration for oil and gas

Although currently, the waters off New Jersey and New England are off-limits for exploration, North Carolina, South Carolina, and Virginia encouraged the federal government to open their off-shore waters for oil and gas surveys. Nevertheless,  many ocean-front communities have come out strongly against the use of sonic cannons and their impacts on marine life. To date, 15 communities from New Jersey to Florida have passed resolutions opposing this form of oil and gas exploration.

FracTracker has mapped the locations of these communities, with pop-up links to the resolutions that were passed, as well as the ranges of 17 marine mammals found along the Atlantic seaboard of the US.  These data come from the International Union for Conservation of Nature (IUCN) 2014 Red List of Threatened Species. You can toggle ranges on and off by going to the “Layers” drop-down menu at the top of the map. The default presentation for this map currently shows only the range of North Atlantic right whales. For a full-screen version of this map, with access to the other marine mammal ranges, click here.

Photo by the NY Times

In Solidarity With Argentina

Update: The Indiegogo crowdfunding campaign for this initiative ended on August 20, 2014

An International Expedition to Address the Perils of Oil & Gas Extraction

Photo by the NY Times

Signs point to exploration areas in the Vaca Muerta, or Dead Cow, a field in the Patagonian desert where Chevron is currently drilling fracking exploratory wells. (Photo by NY Times)

People in Argentina are concerned about fracking increasing in their country. They are aware of the impacts to people’s health and the environment that oil and gas fracking has caused – spills, leaks and explosions; air and water pollution; nausea, headaches and other health problems from toxic exposure; destruction of forests and parklands; increased earthquake risks.

They want to know the truth from those who have lived and worked near oil and gas operations in the U.S. Argentina sin Fracking has invited Earthworks, FracTracker Alliance and Ecologic Institute to come to Argentina to tell the real story.

To help fund this initiative, we have launched an Indiegogo campaign. Your contributions will make it possible for experts from these 3 American organizations to travel to Argentina, and share their experiences from the U.S. with fracking. We’ll hold several workshops in Buenos Aires and other affected communities, such as the Vaca Muerta region, where fracking is already occurring, and visit others who face the potential dangers of fracking.

With your help, we can help Argentina avoid making the mistakes that we’ve made in the U.S., and we can connect Argentinians to a new international network of environmental groups fighting fossil fuel development worldwide.

What’s in PA Senate Bill 1378?

State Senator Joseph Scarnati III, from north-central Pennsylvania, has introduced a bill that would redefine the distinction between conventional and unconventional oil and gas wells throughout the state.  In Section 1 of the bill, the sponsors try to establish the purpose of the legislation,  making the case that:

  1. Conventional oil and gas development has a benign impact on the Commonwealth
  2. Many of the wells currently classified as conventional are developed by small businesses
  3. Oil and gas regulations, “must permit the optimal development of oil and gas resources,” as well as protect the citizens and environment.
  4. Previous legislation already does, and should, treat conventional and unconventional wells differently
This diagram shows geologic stata in Pennsylvania.  The Elk Sandstone is between the Huron and Rhinestreet shale deposits from the Upper Devonian period.

This diagram shows geologic stata in Pennsylvania. The Elk Group is between the Huron and Rhinestreet shale deposits from the Upper Devonian period. Click on the image to see the full version. Source: DCNR

Certainly, robust debate surrounds each of these points, but they are introductory in nature, not the meat and potatoes of Senate Bill 1378.  What this bill does is re-categorize some of the state’s unconventional wells to the less restrictive conventional category, including:

  1. All oil wells
  2. All natural gas wells not drilled in shale formations
  3. All shale wells above (shallower than) the base of the Elk Group or equivalent
  4. All shale wells below the Elk Group from a formation that can be economically drilled without the use of hydraulic fracturing or multi-lateral bore holes
  5. All wells drilled into any formation where the purpose is not production, including waste disposal and other injection wells

The current distinction is in fact muddled, with one DEP source indicating that the difference is entirely due to whether or not the formation being drilled into is above or below the Elk Group, and another DEP source indicates that the difference is much more nuanced, and really depends on whether the volumes of hydraulic fracturing fluid required to profitably drill into a given formation are generally high or low.

This table shows the number of wells in each formation in Pennsylvania that has both conventional and unconventional wells drilled into it.  Data source:  DEP, downloaded 7/9/2014.

This table shows the number of distinct wells in each producing formation in Pennsylvania that has both conventional and unconventional wells drilled into it. Data source: DEP, downloaded 7/9/2014.

As one might expect, this ambiguity is represented in the data. The chart at the left shows the number of distinct number of wells by formation, for each producing formation that has both conventional and unconventional wells in the dataset.  Certainly, there could be some data entry errors involved, as the vast majority of Bradford wells are conventional, and almost all of the Marcellus wells are unconventional.  But there seems to be some real confusion with regards to the Oriskany, for example, which is not only deeper than the Elk Group, but the Marcellus formation as well.

While an adjustment to the distinction of conventional and unconventional wells in Pennsylvania is called for, one wonders if the definitions proposed in SB 1378 is the right way to handle it.  If the idea of separating the two is based on the relative impact of the drilling operation, then a much more straightforward metric might be useful, such as providing a cutoff in the amount of hydraulic fracturing fluid used to drill a well.  Further, each of the five parts of the proposed definition serve to make the definition of unconventional wells less inclusive, meaning that additional wells would be subject to the less stringent regulations, and that the state would collect less money from the impact fees that were a part of Act 13 of 2012.

Instead, it is worth checking to see whether the definition of unconventional is inclusive enough.  In May of this year, FracTracker posted a blog about conventional wells that were drilled horizontally in Pennsylvania.


Conventional, non-vertical wells in Pennsylvania. Please click the expanding arrows icon at the top-right corner to access the legend and other map controls. Please zoom in to access data for each location.

These wells require large amounts of hydraulic fracturing fluids, and are already being drilled at depths of only 3,000 feet, and could go as shallow as 1,000 feet.  It’s pretty easy to argue that due to the shallow nature of the wells, and the close proximity to drinking water aquifers, these wells are deserving of even more rigorous scrutiny than those drilled into the Marcellus Shale, which generally ranges from 5,000 to 9,000 feet deep throughout the state.

A summary of the different regulations regarding conventional and unconventional wells can be found from PennFuture.  In general, unconventional wells must be further away from water sources and structures than their conventional counterparts, and the radius of presumptive liability for the contamination of water supplies is 2,500 feet instead of 1,000.

SB 1378 has been re-referred to the Appropriations Committee.


OH and WV Shale Gas Water Usage and Waste Injection

By Ted Auch, OH Program Coordinator, FracTracker Alliance

Both Ohio and West Virginia citizens are concerned about the increasing shale exploration in their area and how it affects water quality. Those concerned about the drilling tend to focus on the large quantities of water required to hydraulically fracture – or “frack” – Utica and Marcellus wells. Meanwhile those concerned with water quality cite increases in truck traffic and related spills. Concerns also exist regarding the large volumes of fracking waste injected into Class II Salt Water Disposal (SWD) wells primarily located in/adjacent to Ohio’s Muskingum River Watershed.

Injection Wells & Water Usage

While Pennsylvania and WV have drilled heavily into their various shale plays, OH has seen a dramatic increase in Class II Injection wells. In 2010 OH hosted 151 injection wells, which received 50.1 Million Gallons (MGs) per quarter in total – or 331,982 gallons per well. Now, this area has 1941 injection wells accepting 937.5 MGs in total and an average of 4.3 MGs per well.

In the second quarter of 2010 the Top 10 Class II wells by volume accounted for 45.87% of total fracking waste injected in the state. Fast forward to today, the Top 10 wells account for 38.87% of the waste injected. This means that the industry and OH Department of Natural Resources Underground Injection Control (ODNR UIC) are relying on 128% more wells to handle the 1,671% increase in the fracking waste stream coming from inside OH, WV, and PA. During the same time period, freshwater usage by the directional drilling industry has increased by 261% in WV and 162% in OH.

Quantity of Disposed Waste

With respect to OH’s injection waste story there appear to be a couple of distinct trends with the following injection wells:

— Long Run Disposal #8 in Washington and Myers in Portage counties. The changes reflect a nearly exponential increase in the amount of oil and gas waste being injected, with projected quarterly increases of 6.78 and 5.64 MGs. This trend is followed by slightly less dramatic increases at several other sites: the Devco Unit #11 is up 4.81 MGs per quarter (MGPQ).

— Groselle #2 is increasing at 4.21 MGPQ, and Ohio Oil Gathering Corp II #6 is the same with an increase of 4.03 MGPQ.

— Another group of wells with similar waste statistics is the trio of the Newell Run Disposal #10 (↑2.81 MGPQ), Pander R & P #15 (↑3.23 MGPQ), and Dietrich PH (↑2.53 MGPQ).

— The final grouping are of wells that came online between the fall of 2012 and the spring of 2013 and have rapidly begun to constitute a sizeable share of the fracking waste stream. The two wells that fall within this category and rank in the Top 10 are the Adams #10 and Warren Drilling Co. #6 wells, which are experiencing quarterly increases of 3.49 and 2.41 MGs (Figure 2).

Disposal of Out-of-State Waste

These Top 10 wells also break down into groups based on the degree to which they have, are, and plan to rely on out-of-state fracking waste (Figure 3). Five wells that have continuously received more than 70% of their wastestream from out-of-state are the Newell Run Disposal (94.4), Long Run Disposal (94.7%), Ohio Oil Gathering Corp (94.2%), Groselle (94.3%), and Myers (77.2%). This group is followed by a set of three wells that reflect those that relied on out-of-state waste for 17-30% of their inputs during the early stages of Utica Shale development in OH but shifted significantly to out-of-state shale waste for ≥40% of their inputs. (More than 80% of Pander R & P’s waste stream was from out-of-state waste streams, up from ≈20% during the Fall/Winter of 2010-11). Finally, there are the Adams and Warren Drilling Co. wells, which – in addition to coming online only recently – initially heavily received out-of-state fracking waste to the tune of ≥75% but this reliance declined significantly by 51% and 26% in the case of the Adams and Warren Drilling Co. wells, respectively. This indicates that demand-side pressures are growing in Ohio and for individual Class II owners – or – the expanding Stallion Oilfield Services (which is rapidly buying up Class II wells) is responding to an exponential increase in fracking brine waste internally.

Waste Sources

We know anecdotally that much of the waste coming into OH is coming from neighboring WV and PA, which is why we are now looking into directional well water usage in these two states. WV and PA have far fewer Class II wells relative to OH and well permitting has not increased significantly there. Here in Ohio we are experiencing not just an increase in injection waste volumes but also a steady increase in water usage.  The average Utica well currently utilizes 6.5-8.1 million gallons of fresh water, up from 4.6-5.3 MGs during the Fall/Winter of 2010-11 (Figure 4). Put another way, water usage is increasing on a quarterly basis by 221-333K gallons per well2. Unfortunately, this increase coincides with an increase in the reliance on freshwater (+00.42% PQ) and parallel decline in recycled water (-00.54% PQ). In addition to declining in nominal terms, recycling rates are also declining in real terms given that the rate is a percentage of an ever-increasing volume. Currently the use of freshwater and recycled water account for 6.1 MGs and 0.33 MGs per well, respectively. Given the difference in freshwater and recycled water it appears there is an average 8,319 gallon unknown fluid void per well. The quality of the water used to fill the void is important from a watershed (or drinking water) perspective.  The chemicals used in the process tend to be resistant to bio-degradation and can negatively influence the chemistry of freshwater.

WV Data

WV is experiencing similar increases in water usage for their directionally drilled wells; the average well currently utilizes 7.0-9.6 MGs of fresh water – up from 2.9-5.0 MGs during the Fall/Winter of 2010-11 (↑208%). This change translates into a quarterly increase in the range of 189-353K gallons per well3. The increase coincides with an increase in the reliance on freshwater (+00.34% PQ) and related decline in recycled water (-00.67% PQ). Currently, freshwater and recycled water account for 7.7 MGs and 0.61 MGs per well, respectively. Given the difference in freshwater and recycled water, there is an average of 22,750 gallons of unaccounted for fluids being filled by unknown or proprietary fluids (Figure 5).

The Bigger Picture

This analysis coincides with our ongoing Muskingum River Watershed resilience analysis on behalf of Freshwater Accountability Project’s Leatra Harper and Terry Lodge. Their group represents a set of concerned citizens disputing the “short-term water sale” of freshwater by the increasingly abstruse and proprietary Muskingum Watershed Conservancy District (MWCD) to industry players such as Antero, Gulfport, and American Energy Utica. Pending or approved sales total 120 MGs averaging 1.8 MGs per day at around $4.25 per thousand gallons4. The proximity of this watershed – and location of many Utica wells within its boundaries – to most of the current and proposed WV and OH wells makes it susceptible to excess, irresponsible, or dangerous water withdrawals and waste transport (Figure 6). We will continue to update this analysis in an effort to infuse the MWCD conversation about industry water sales with more holistic watershed resilience and susceptibility mapping with an eye toward getting the state of OH to address issues associated with freshwater valuation which is lacking at the present time.

Figures

Ohio Class II Number and Volumes in 2010 and 2014

Figure 1. Ohio Class II Number and Volumes in 2010 and 2014

Ohio's Top 10 Fracking Waste Class II Injection Wells by Volume

Figure 2. Quarterly volumes accepted by Ohio’s Top Ten Class II Injection Wells with respect to hydraulic fracturing brine waste.

Ohio's Top 10 Fracking Waste Class II Injection Wells by % Out-Of-State

Figure 3. Ohio’s Top Ten Class II Injection Wells w/respect to hydraulic fracturing brine waste.

Average Water Usage by Ohio's Utica Wells By Quarter (Fall 2010 to Spring 2014)

Figure 4. Total water usage per Utica well and recycled Vs freshwater percentage change across Ohio’s Utica Shale wells on a quarterly basis. Data are presented quarterly (Ave. Q3-2010 to Q2-2014)

Average Water Usage by West Virginia's Directional Drilling Wells By Quarter (Summer 2010 to Winter 2014)

Figure 5. Changes in WV water usage for horizontally/hydraulically fractured wells w/respect to recycled water (volume & percentages) & freshwater. Data are presented quarterly (Ave. Q3-2010 to Q2-2014)

OH_WV_Water

Figure 6. Unconventional drilling well water usage in OH (n = 516) and WV (n = 581) (Note: blue borders describe primary Hydrological Units w/the green outline depicting the Muskingum River watershed in OH).


References & Resources

  1. Of a possible 239 Class II Salt Water Disposal (SWD) wells.
  2. The large range depends on whether you start your analysis at Q3-2010 or the aforementioned statistically robust Q3-2011.
  3. The large range depends on whether you start your analysis at Q3-2010 or the more statistically robust Q3-2011.
  4. MWCD water sales approved to date: 1) Seneca Lake for Antero: 15 million gallons at 1.5mm per day, 2) Piedmont Lake for Gulfport: 45 million gallons at 2 million per day, 3) Clendening for American Energy Utica: 60 million gallons at 2 million per day.
Photo by Evan Collins and Rachel Wadell

These Fish Weren’t Playing Opossum (Creek)

A First-hand Look at the Recent Statoil Well Pad Fire

By Evan Collins and Rachel Wadell, Summer Research Interns, Wheeling Jesuit University

Statoil well pad fire 2205-crop

Monroe Co. Ohio – Site of June 2014 Statoil well pad fire

After sitting in the non-air-conditioned lab on a muggy Monday afternoon (June 30, 2014), we were more than ready to go for a ride to Opossum Creek after our professor at Wheeling Jesuit University mentioned a field work opportunity. As a researcher concerned about drilling’s impacts, our professor has given many talks on the damaging effects that unconventional drilling can have on the local ecosystem. During the trip down route 7, he explained that there had been a serious incident on a well pad in Monroe County, Ohio (along the OH-WV border) on Saturday morning.

About the Incident

Hydraulic tubing had caught fire at Statoil’s Eisenbarth well pad, resulting in the evacuation of 20-25 nearby residents.1 Statoil North America is a relatively large Norwegian-based company, employing roughly 23,000 workers, that operates all of its OH shale wells in Monroe County.2 The Eisenbarth pad has 8 wells, 2 of which are active.1 However, the fire did not result from operations underground. All burning occurred at the surface from faulty hydraulic lines.

Resulting Fish Kill?

Photo by Evan Collins and Rachel Wadell

Several fish from the reported fish kill of Opossum Creek in the wake of the recent well pad fire in Monroe County, OH.

When we arrived at Opossum Creek, which flows into the Ohio River north of New Martinsville, WV, it smelled like the fresh scent of lemon pine-sol. A quick look revealed that there was definitely something wrong with the water. The water had an orange tint, aquatic plants were wilting, and dozens of fish were belly-up. In several shallow pools along the creek, a few small mouth bass were still alive, but they appeared to be disoriented.  As we drove down the rocky path towards the upstream contamination site, we passed other water samplers. One group was from the Center for Toxicology and Environmental Health (CTEH). The consulting firm was sampling for volatile organic compounds, while we were looking for the presence of halogens such as Bromide and Chloride. These are the precursors to trihalomethanes, a known environmental toxicant.

Visiting the Site

After collecting water samples, we decided to visit the site of the fire. As we drove up the ridge, we passed another active well site. Pausing for a break and a peek at the well, we gazed upon the scenic Appalachian hillsides and enjoyed the peaceful drone of the well site. Further up the road, we came to the skeletal frame of the previous Statoil site. Workers and members of consulting agencies, such as CTEH, surrounded the still smoking debris. After taking a few pictures, we ran into a woman who lived just a half-mile from the well site.  We asked her about the fire and she stated that she did not appreciate having to evacuate her home. Surrounding plants and animals were not able to be evacuated, however.

Somehow the fish living in Opossum Creek, just downhill from the well, ended up dead after the fire. The topography of the area suggests that runoff from the well would likely flow in a different direction, so the direct cause of the fish kill is still obscure. While it is possible that chemicals used on the well pad ran into the creek while the fire was being extinguished, the OH Department of Natural Resources “can’t confirm if it (the fish kill) is related to the gas-well fire.”3  In reference to the fire, a local resident said “It’s one of those things that happens. My God, they’re 20,000 feet down in the ground. Fracking isn’t going to hurt anything around here. The real danger is this kind of thing — fire or accidents like that.”4

Lacking Transparency

WV 2014 Photo by Evan Collins and Rachel Wadell

Run by Statoil North America, Eisenbarth well pad in Monroe County, Ohio is still smoking after the fire.

Unfortunately, this sentiment is just another example of the general public being ill-informed about all of the aspects involved in unconventional drilling. This knowledge gap is largely due to the fact that oil and gas extraction companies are not always transparent about their operations or the risks of drilling. In addition to the potential for water pollution, earthquakes, and illness due to chemicals, air pollution from active unconventional well sites is increasing annually.

CO2 Emissions

Using prior years’ data, from 2010 to 2013, we determined that the average CO2 output from unconventional gas wells in 2013 was equal to that of an average coal-fired plant. If growth continued at this rate, the total emissions of all unconventional wells in West Virginia will approximate 10 coal-fired power plants in the year 2030. Coincidentally, this is the same year which the EPA has mandated a 30 percent reduction in CO2 emissions by all current forms of energy production. However, recent reports suggest that the amount of exported gas will quadruple by 2030, meaning that the growth will actually be larger than originally predicted.5 Yet, this number only includes the CO2 produced during extraction. It does not include the CO2 released when the natural gas is burned, or the gas that escapes from leaks in the wells.

Long-Term Impacts

Fires and explosions are just some of the dangers involved in unconventional drilling. While they can be immediately damaging, it is important to look at the long-term impacts that this industry has on the environment. Over time, seepage into drinking water wells and aquifers from underground injection sites will contaminate these potable sources of water. Constant drilling has also led to the occurrence of unnatural earthquakes. CO2 emissions, if left unchecked, could easily eclipse the output from coal-fired power plants – meaning that modern natural gas drilling isn’t necessarily the “clean alternative” as it has been advertised.

References

  1. Willis, Jim ed. (2014). Statoil Frack Trucks Catch Fire in Monroe County, OH. Marcellus Drilling News.
  2. Forbes. (2014). Statoil.
  3. Woods, Jim. (2014). Fish Kill in Eastern Ohio Might be Linked to Fire at Fracking Well. The Columbus Dispatch.
  4. Ibid.
  5. Cushman, John H., Jr. (2014). US Natural Gas Exports No Better for Climate than China’s Coal, Experts Say.