OH and WV Shale Gas Water Usage and Waste Injection
By Ted Auch, OH Program Coordinator, FracTracker Alliance
Both Ohio and West Virginia citizens are concerned about the increasing shale exploration in their area and how it affects water quality. Those concerned about the drilling tend to focus on the large quantities of water required to hydraulically fracture – or “frack” – Utica and Marcellus wells. Meanwhile those concerned with water quality cite increases in truck traffic and related spills. Concerns also exist regarding the large volumes of fracking waste injected into Class II Salt Water Disposal (SWD) wells primarily located in/adjacent to Ohio’s Muskingum River Watershed.
Injection Wells & Water Usage
While Pennsylvania and WV have drilled heavily into their various shale plays, OH has seen a dramatic increase in Class II Injection wells. In 2010 OH hosted 151 injection wells, which received 50.1 Million Gallons (MGs) per quarter in total – or 331,982 gallons per well. Now, this area has 1941 injection wells accepting 937.5 MGs in total and an average of 4.3 MGs per well.
In the second quarter of 2010 the Top 10 Class II wells by volume accounted for 45.87% of total fracking waste injected in the state. Fast forward to today, the Top 10 wells account for 38.87% of the waste injected. This means that the industry and OH Department of Natural Resources Underground Injection Control (ODNR UIC) are relying on 128% more wells to handle the 1,671% increase in the fracking waste stream coming from inside OH, WV, and PA. During the same time period, freshwater usage by the directional drilling industry has increased by 261% in WV and 162% in OH.
Quantity of Disposed Waste
With respect to OH’s injection waste story there appear to be a couple of distinct trends with the following injection wells:
— Long Run Disposal #8 in Washington and Myers in Portage counties. The changes reflect a nearly exponential increase in the amount of oil and gas waste being injected, with projected quarterly increases of 6.78 and 5.64 MGs. This trend is followed by slightly less dramatic increases at several other sites: the Devco Unit #11 is up 4.81 MGs per quarter (MGPQ).
— Groselle #2 is increasing at 4.21 MGPQ, and Ohio Oil Gathering Corp II #6 is the same with an increase of 4.03 MGPQ.
— Another group of wells with similar waste statistics is the trio of the Newell Run Disposal #10 (↑2.81 MGPQ), Pander R & P #15 (↑3.23 MGPQ), and Dietrich PH (↑2.53 MGPQ).
— The final grouping are of wells that came online between the fall of 2012 and the spring of 2013 and have rapidly begun to constitute a sizeable share of the fracking waste stream. The two wells that fall within this category and rank in the Top 10 are the Adams #10 and Warren Drilling Co. #6 wells, which are experiencing quarterly increases of 3.49 and 2.41 MGs (Figure 2).
Disposal of Out-of-State Waste
These Top 10 wells also break down into groups based on the degree to which they have, are, and plan to rely on out-of-state fracking waste (Figure 3). Five wells that have continuously received more than 70% of their wastestream from out-of-state are the Newell Run Disposal (94.4), Long Run Disposal (94.7%), Ohio Oil Gathering Corp (94.2%), Groselle (94.3%), and Myers (77.2%). This group is followed by a set of three wells that reflect those that relied on out-of-state waste for 17-30% of their inputs during the early stages of Utica Shale development in OH but shifted significantly to out-of-state shale waste for ≥40% of their inputs. (More than 80% of Pander R & P’s waste stream was from out-of-state waste streams, up from ≈20% during the Fall/Winter of 2010-11). Finally, there are the Adams and Warren Drilling Co. wells, which – in addition to coming online only recently – initially heavily received out-of-state fracking waste to the tune of ≥75% but this reliance declined significantly by 51% and 26% in the case of the Adams and Warren Drilling Co. wells, respectively. This indicates that demand-side pressures are growing in Ohio and for individual Class II owners – or – the expanding Stallion Oilfield Services (which is rapidly buying up Class II wells) is responding to an exponential increase in fracking brine waste internally.
Waste Sources
We know anecdotally that much of the waste coming into OH is coming from neighboring WV and PA, which is why we are now looking into directional well water usage in these two states. WV and PA have far fewer Class II wells relative to OH and well permitting has not increased significantly there. Here in Ohio we are experiencing not just an increase in injection waste volumes but also a steady increase in water usage. The average Utica well currently utilizes 6.5-8.1 million gallons of fresh water, up from 4.6-5.3 MGs during the Fall/Winter of 2010-11 (Figure 4). Put another way, water usage is increasing on a quarterly basis by 221-333K gallons per well2. Unfortunately, this increase coincides with an increase in the reliance on freshwater (+00.42% PQ) and parallel decline in recycled water (-00.54% PQ). In addition to declining in nominal terms, recycling rates are also declining in real terms given that the rate is a percentage of an ever-increasing volume. Currently the use of freshwater and recycled water account for 6.1 MGs and 0.33 MGs per well, respectively. Given the difference in freshwater and recycled water it appears there is an average 8,319 gallon unknown fluid void per well. The quality of the water used to fill the void is important from a watershed (or drinking water) perspective. The chemicals used in the process tend to be resistant to bio-degradation and can negatively influence the chemistry of freshwater.
WV Data
WV is experiencing similar increases in water usage for their directionally drilled wells; the average well currently utilizes 7.0-9.6 MGs of fresh water – up from 2.9-5.0 MGs during the Fall/Winter of 2010-11 (↑208%). This change translates into a quarterly increase in the range of 189-353K gallons per well3. The increase coincides with an increase in the reliance on freshwater (+00.34% PQ) and related decline in recycled water (-00.67% PQ). Currently, freshwater and recycled water account for 7.7 MGs and 0.61 MGs per well, respectively. Given the difference in freshwater and recycled water, there is an average of 22,750 gallons of unaccounted for fluids being filled by unknown or proprietary fluids (Figure 5).
The Bigger Picture
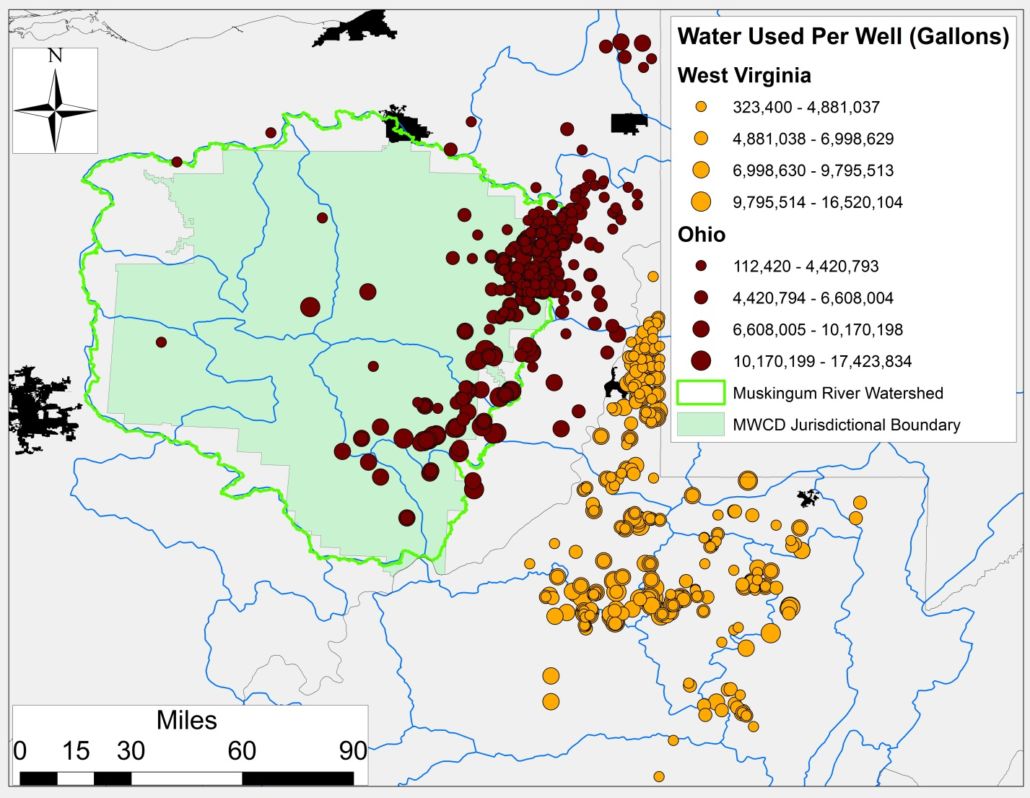
This analysis coincides with our ongoing Muskingum River Watershed resilience analysis on behalf of Freshwater Accountability Project’s Leatra Harper and Terry Lodge. Their group represents a set of concerned citizens disputing the “short-term water sale” of freshwater by the increasingly abstruse and proprietary Muskingum Watershed Conservancy District (MWCD) to industry players such as Antero, Gulfport, and American Energy Utica. Pending or approved sales total 120 MGs averaging 1.8 MGs per day at around $4.25 per thousand gallons4. The proximity of this watershed – and location of many Utica wells within its boundaries – to most of the current and proposed WV and OH wells makes it susceptible to excess, irresponsible, or dangerous water withdrawals and waste transport (Figure 6). We will continue to update this analysis in an effort to infuse the MWCD conversation about industry water sales with more holistic watershed resilience and susceptibility mapping with an eye toward getting the state of OH to address issues associated with freshwater valuation which is lacking at the present time.
Figures
 Figure 1. Ohio Class II Number and Volumes in 2010 and 2014 |
 Figure 2. Quarterly volumes accepted by Ohio’s Top Ten Class II Injection Wells with respect to hydraulic fracturing brine waste. |
 Figure 3. Ohio’s Top Ten Class II Injection Wells w/respect to hydraulic fracturing brine waste. |
 Figure 4. Total water usage per Utica well and recycled Vs freshwater percentage change across Ohio’s Utica Shale wells on a quarterly basis. Data are presented quarterly (Ave. Q3-2010 to Q2-2014) |
 Figure 5. Changes in WV water usage for horizontally/hydraulically fractured wells w/respect to recycled water (volume & percentages) & freshwater. Data are presented quarterly (Ave. Q3-2010 to Q2-2014) |
 Figure 6. Unconventional drilling well water usage in OH (n = 516) and WV (n = 581) (Note: blue borders describe primary Hydrological Units w/the green outline depicting the Muskingum River watershed in OH). |
References & Resources
- Of a possible 239 Class II Salt Water Disposal (SWD) wells.
- The large range depends on whether you start your analysis at Q3-2010 or the aforementioned statistically robust Q3-2011.
- The large range depends on whether you start your analysis at Q3-2010 or the more statistically robust Q3-2011.
- MWCD water sales approved to date: 1) Seneca Lake for Antero: 15 million gallons at 1.5mm per day, 2) Piedmont Lake for Gulfport: 45 million gallons at 2 million per day, 3) Clendening for American Energy Utica: 60 million gallons at 2 million per day.
Trackbacks & Pingbacks
[…] (2) this increase in lateral length accounts for 40% of the increase in water usage we have discussed in the past, (3) as a general rule every foot increase in lateral length equates to an increase of 1,461 […]
Comments are closed.