Digging into Waste Data
By Katie Mattern, FracTracker Summer Intern
Seeing is believing, as the saying goes. Without physically observing the amount of waste generated from hydraulic fracturing of unconventional oil and gas wells, it is difficult to comprehend the volume and scope of the waste produced.
The Pennsylvania Department of Environmental Protection (PADEP) makes a considerable amount of waste production data publicly available, speaking to the quantities of fluids and solids produced by 25 oil and gas operators across 25 counties. This figure, however, is only about 40% of all of the operators according to StateImpactPA. Also, complete data is not available for the 25 companies that are included, but let’s dig into some waste data simply as an exercise.
Dig Into Basic Cabot Waste Statistics
In order to gain a sense for industry trends we decided to look at data pertaining to Cabot Oil and Gas Corporation, specifically, whose entire 2013 inventory of oil and gas wells were in Susquehanna County and the surrounding region. The first and second halves of 2013 contain fairly complete records for Cabot – such as well location, waste facility location, waste type, waste quantity, and disposal method. It is interesting to note that in the comments section, all but a few of the well permit sites read “Entire water fraction of waste stream recycled at a centralized treatment plant for reuse by Cabot,” even for drill cuttings that were taken to a landfill.
The following analysis focuses on the waste generated by 264 Cabot wells during this period. All of Cabot’s unconventional oil and gas wells in Pennsylvania during 2013 were in Susquehanna County and the surrounding region.
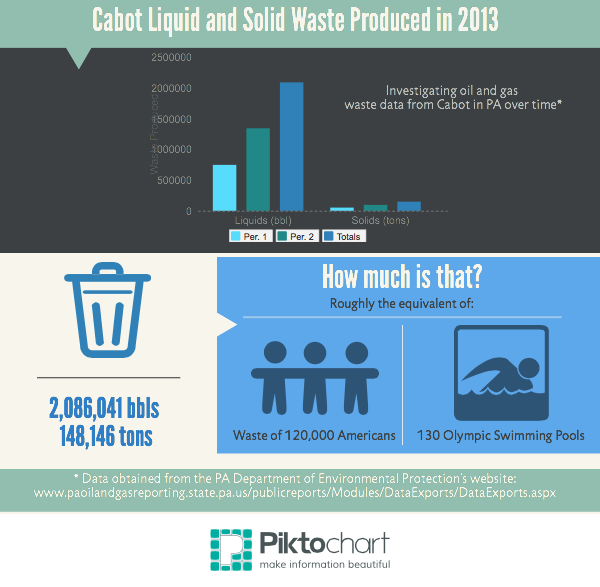
Waste Produced
In the first 6 months of 2013 (Period 1), liquid waste – consisting of produced fluid, servicing fluid, hydraulic fracturing fluid (frac fluid) waste, and drilling fluid waste – totaled 745,898 barrels (Bbl) or over 30,000,000 gallons. Solid waste – or drill cuttings – totaled 51,981 tons.1 To put this into perspective, 745,898 Bbls is equivalent to the water usage requirements of about 4 wells in West Virginia.2 The 51,981 tons of drill cuttings weighs about the same as the average amount of garbage produced by 65,029 Americans per year, or 1.5 times the population of Susquehanna County. The fluid waste is also enough to fill approximately 48 Olympic swimming pools.
Period 2 (July through December) of 2013, consisting of 319 reporting wells, experienced a 77% increase in liquid waste, climbing past the 1 million Bbl mark to 1,340,143 Bbl. This figure is the equivalent of filling almost 85 Olympic swimming pools. Similarly, drill cuttings increased to 96,165 tons, almost double the amount generated in Period 1. The total amount of waste generated by Cabot for the entire year yields more than 2 million Bbl of liquid waste and nearly 150,000 tons of solid waste from drill cuttings1 – more than 130 Olympic swimming pools worth of water and a weight of solid waste equivalent to the average waste generated by more than 120,000 American per year- over 2.8 times the population pf Susquehanna County (see infographic below).
Waste Composition
According to Cabot’s waste data, most of the liquid waste is made up of produced fluid,1 which is the saline water that returns to the surface as a byproduct of the drilling process. This fluid can be up to 10 times saltier than ocean water and can also be radioactive.3 Frac fluid waste3 contributed to the next largest amount of waste, followed by drilling fluid waste and servicing fluid. Produced fluid tripled from Period 1 to Period 2, while frac fluid waste remained fairly steady, and drilling fluid waste decreased slightly. However, the amount of servicing fluid waste generated between the first and second half of 2013 increased more than 12 times.1 Overall, the following increases were seen between Period 1 and Period 2 in 2013:
- Fluid waste from hydraulic fracturing rose by nearly 80%
- Solid waste rose by 85%
- The number of unconventional oil and gas reporting wells only increased by about 20%, from 264 to 319.
Examining the data from FracFocus that is available for these reporting wells,4 it is interesting to note that the average true vertical depth of the wells decreased by about 100 feet between the two periods. Therefore, it is difficult to understand why the amount of drill cuttings increased by 85% in Period 2. Why is there such a large increase in both solid and liquid waste between these two periods when there was only a 20% increase in the number of wells? There are various theories that could result in such a dramatic increase in period 2 compared to the 6 months prior, including but not limited to:
- The use of more liquids for the construction or drilling processes,
- Longer lateral distances per horizontal well,
- More lax operating procedures,
- More detailed reporting by Cabot, and/or
- Stricter reporting/enforcement by the PADEP.
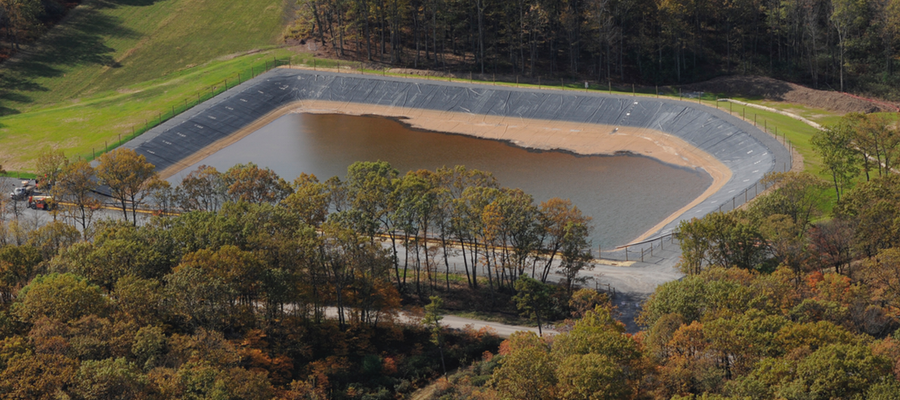
Waste Impoundment – Photo by Pete Stern 2013
Waste Produced Means Waste Transported
Although Cabot is responsible for producing large amounts of waste, they also are recycling their liquid waste (as is listed for every site in the Period 2 data). To do so, the company transports their waste to a centralized treatment plant. There, the water is filtered so that it can be mixed with more freshwater and chemicals and be reused at another well site. However, hauling so much fluid to the centralized treatment plant requires numerous trips by tanker trucks, as well as dump trucks and trailer trucks taking drill cuttings to landfills. Some treatment facilities for PA waste are located as far away as Ohio, West Virginia, and New York. Cabot trucks travelled approximately 114,000 miles5 in Period 1 of 2013, and over 1,122,000 miles were travelled in Period 2 of 2013. The total miles travelled to transport Cabot’s waste is equivalent to almost 50 times around the earth – for one company in one state, operating in only two counties.1
Additional Considerations
Further analysis should examine the air pollution and carbon footprint generated from such extensive traffic. The miles make a difference, considering that a highly efficient tractor trailor only gets ~10 miles per gallon.
While reusing the majority of liquid waste in an effort to reduce the amount of fresh water needed for hydraulic fracturing is a positive step, transporting recycling water by truck still results in fuel used, pollutants emitted, and traffic impacts.
Cabot Oil and Gas Corp. was the second largest unconventional shale gas producer in PA behind Chesapeake Appalachia LLC, which had more than 809 reporting wells in Period 2 of 2013. With a total of 62 companies operating in PA at this time,6 the cumulative effects of waste transportation undoubtedly add up. Serious efforts should be made on the part of all oil and gas companies to reduce their waste and provide accurate and timely waste reports.
References and Resources
- Data obtained from the PA DEP Oil and Gas Reporting Website
- Data originally posted on FracTracker.org
- Data obtained from New York State Water Resources Institute
- True vertical depth measurements are missing for many of the sites in Period 1. Data obtained from FracFocus
- Miles calculated in Microsoft Excel using formula obtained from Blogspot.com
- Data obtained from StateImpact Pennsylvania