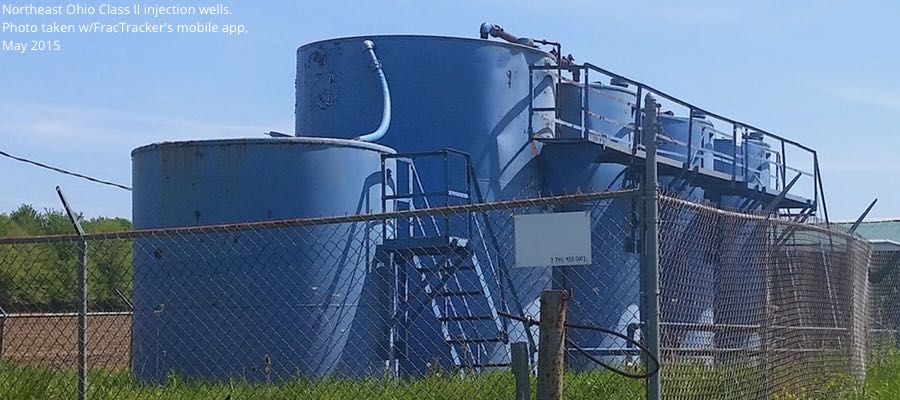
OH Class II Injection Wells – Waste Disposal and Industry Water Demand
By Ted Auch, PhD – Great Lakes Program Coordinator
Waste Trends in Ohio
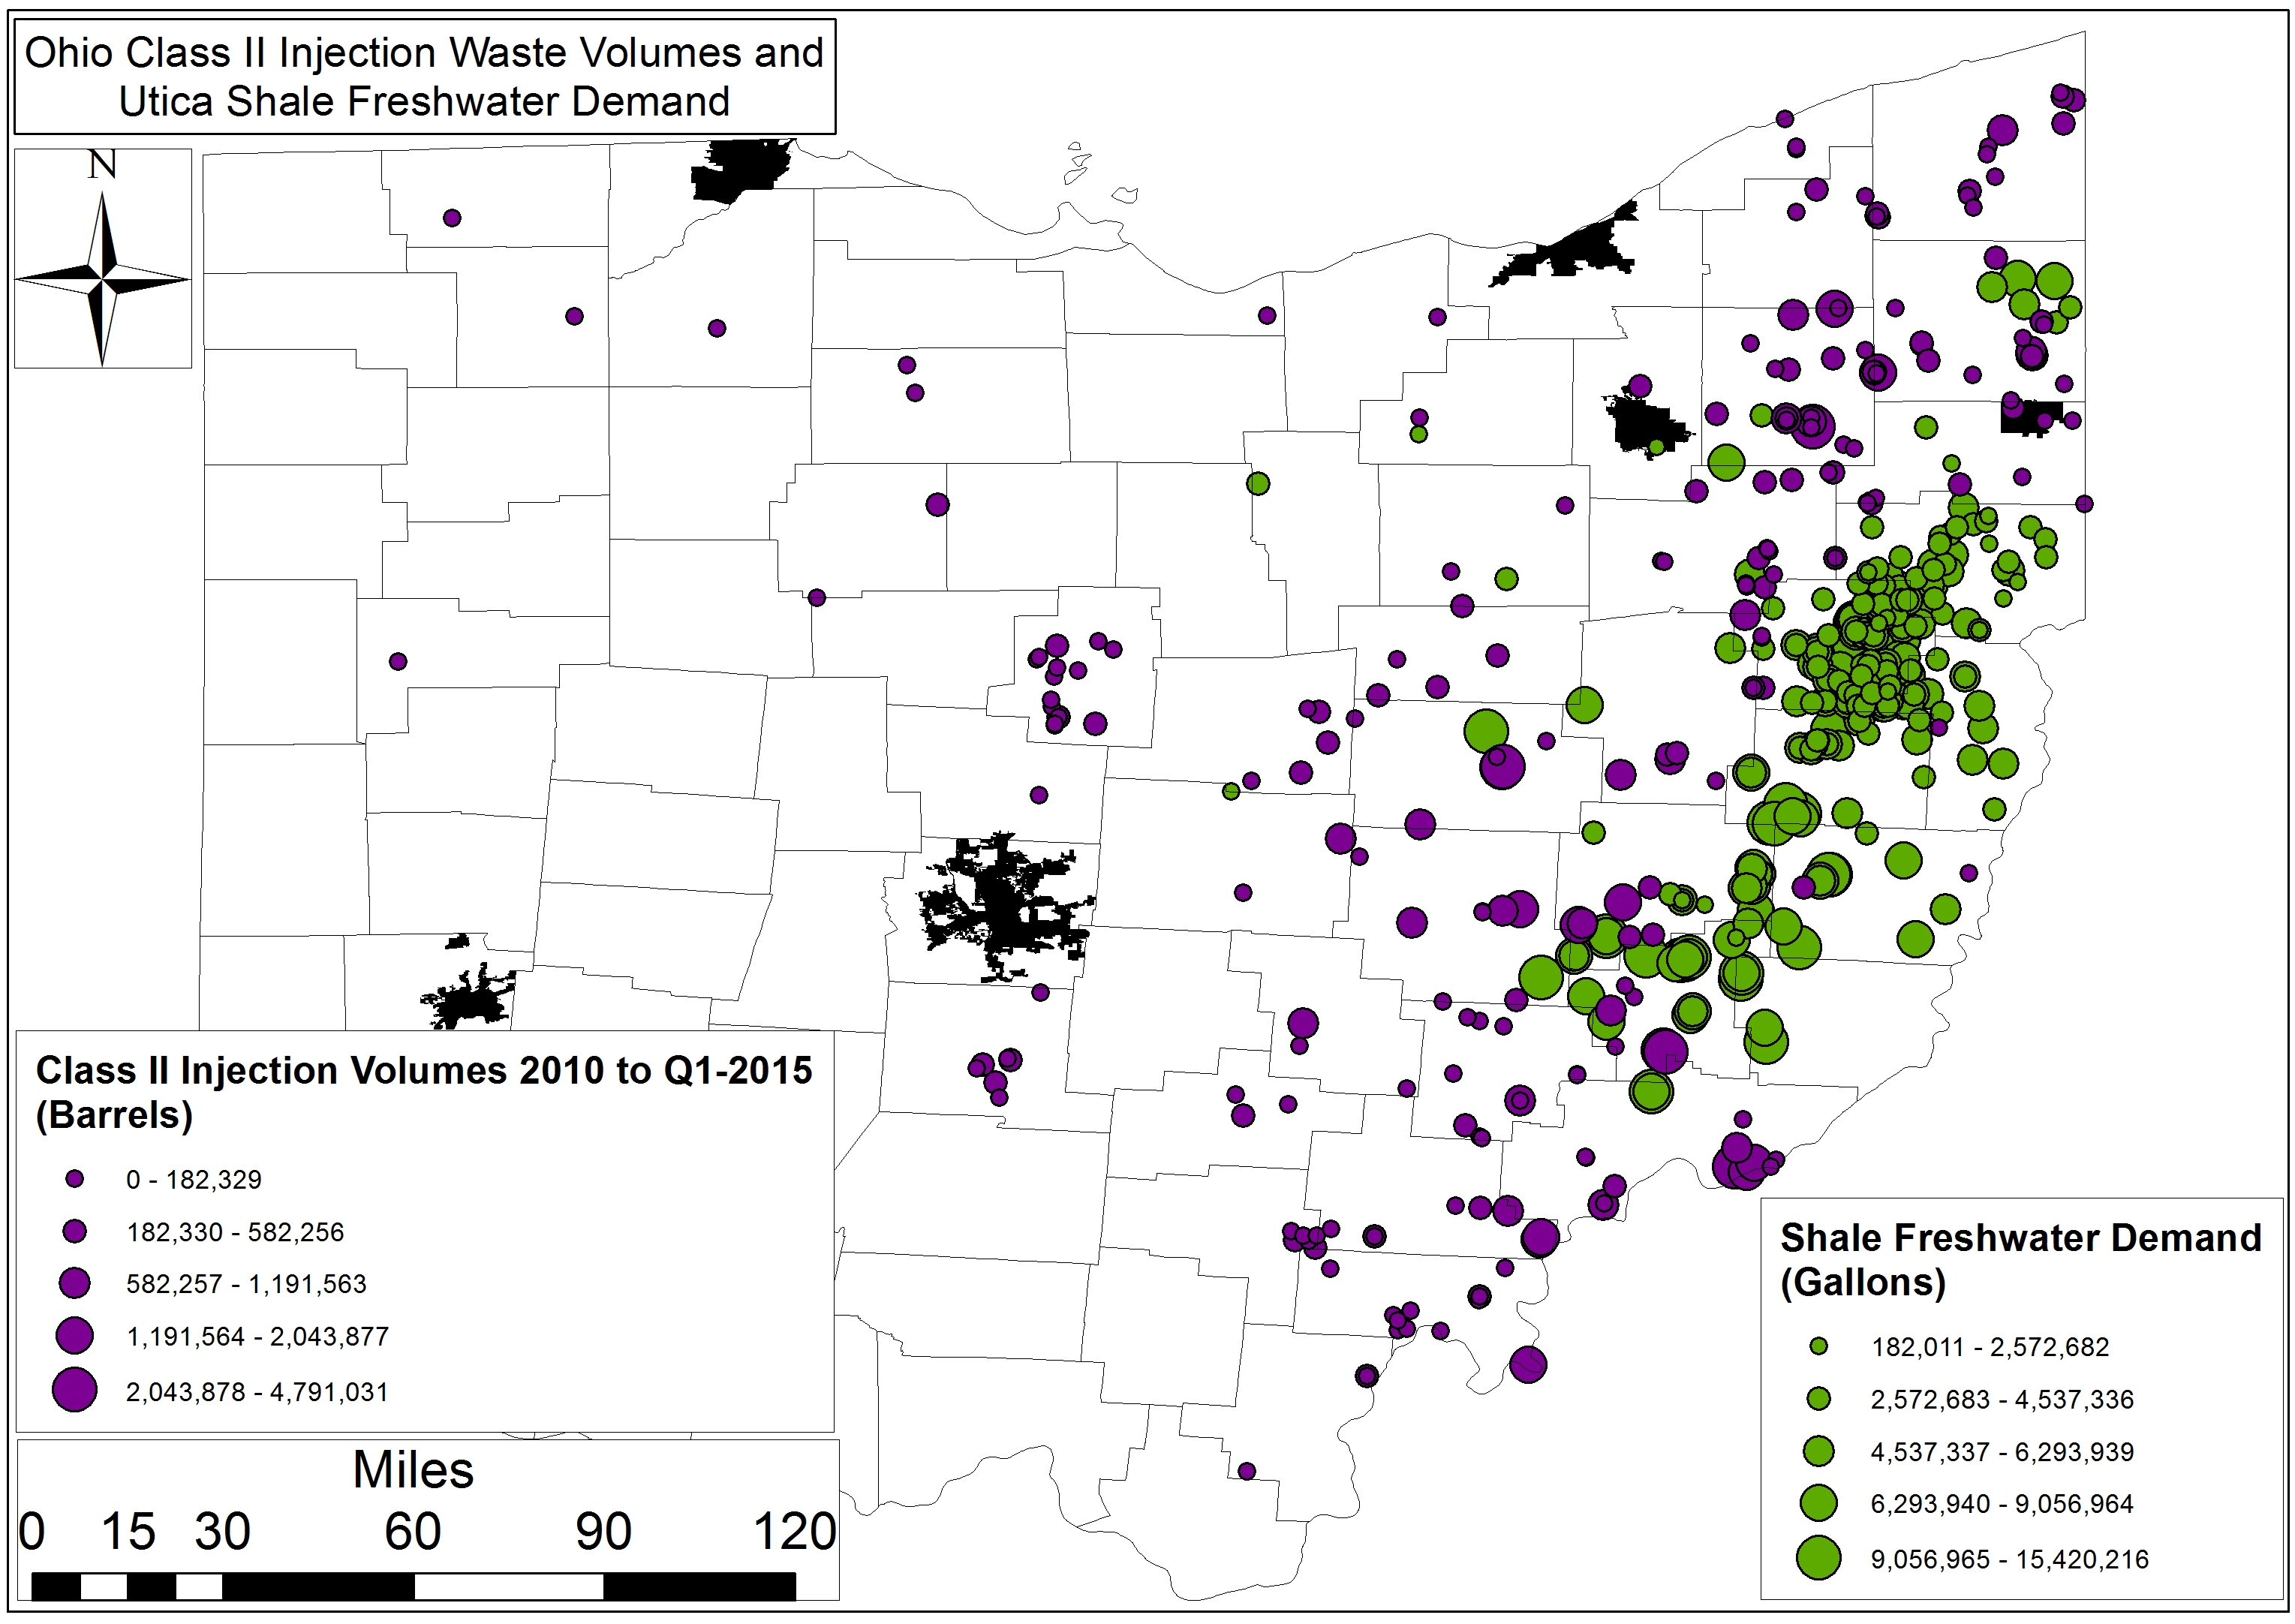
Map of Class II Injection Volumes and Utica Shale Freshwater Demand in Ohio. Explore dynamic map
It has been nearly 2 years since last we looked at the injection well landscape in Ohio. Are existing disposals wells receiving just as much waste as before? Have new injection wells been added to the list of those permitted to receive oil and gas waste? Let’s take a look.
Waste disposal is an issue that causes quite a bit of consternation even amongst those that are pro-fracking. The disposal of fracking waste into injection wells has exposed many “hidden geologic faults” across the US as a result of induced seismicity, and it has been linked recently with increases in earthquake activity in states like Arkansas, Kansas, Texas, and Ohio. Here in OH there is growing evidence – from Ashtabula to Washington counties – that injection well volumes and quarterly rates of change are related to upticks in seismic activity.
Origins of Fracking Waste
Furthermore, as part of this analysis we wanted to understand the ratio of Ohio’s Class II waste that has come from within Ohio and the proportion of waste originating from neighboring states such as West Virginia and Pennsylvania. Out of 960 Utica laterals and 245+ Class II wells, the results speak to the fact that a preponderance of the waste is coming from outside Ohio with out-of-state shale development accounting for ≈90% of the state’s hydraulic fracturing brine stream to-date. However, more recently the tables have turned with in-state waste increasing by 4,202 barrels per quarter per well (BPQPW). Out-of-state waste is only increasing by 1,112 BPQPW. Such a change stands in sharp contrast to our August 2013 analysis that spoke to 471 and 723 BPQPW rates of change for In- and Out-Of-State, respectively.
Brine Production
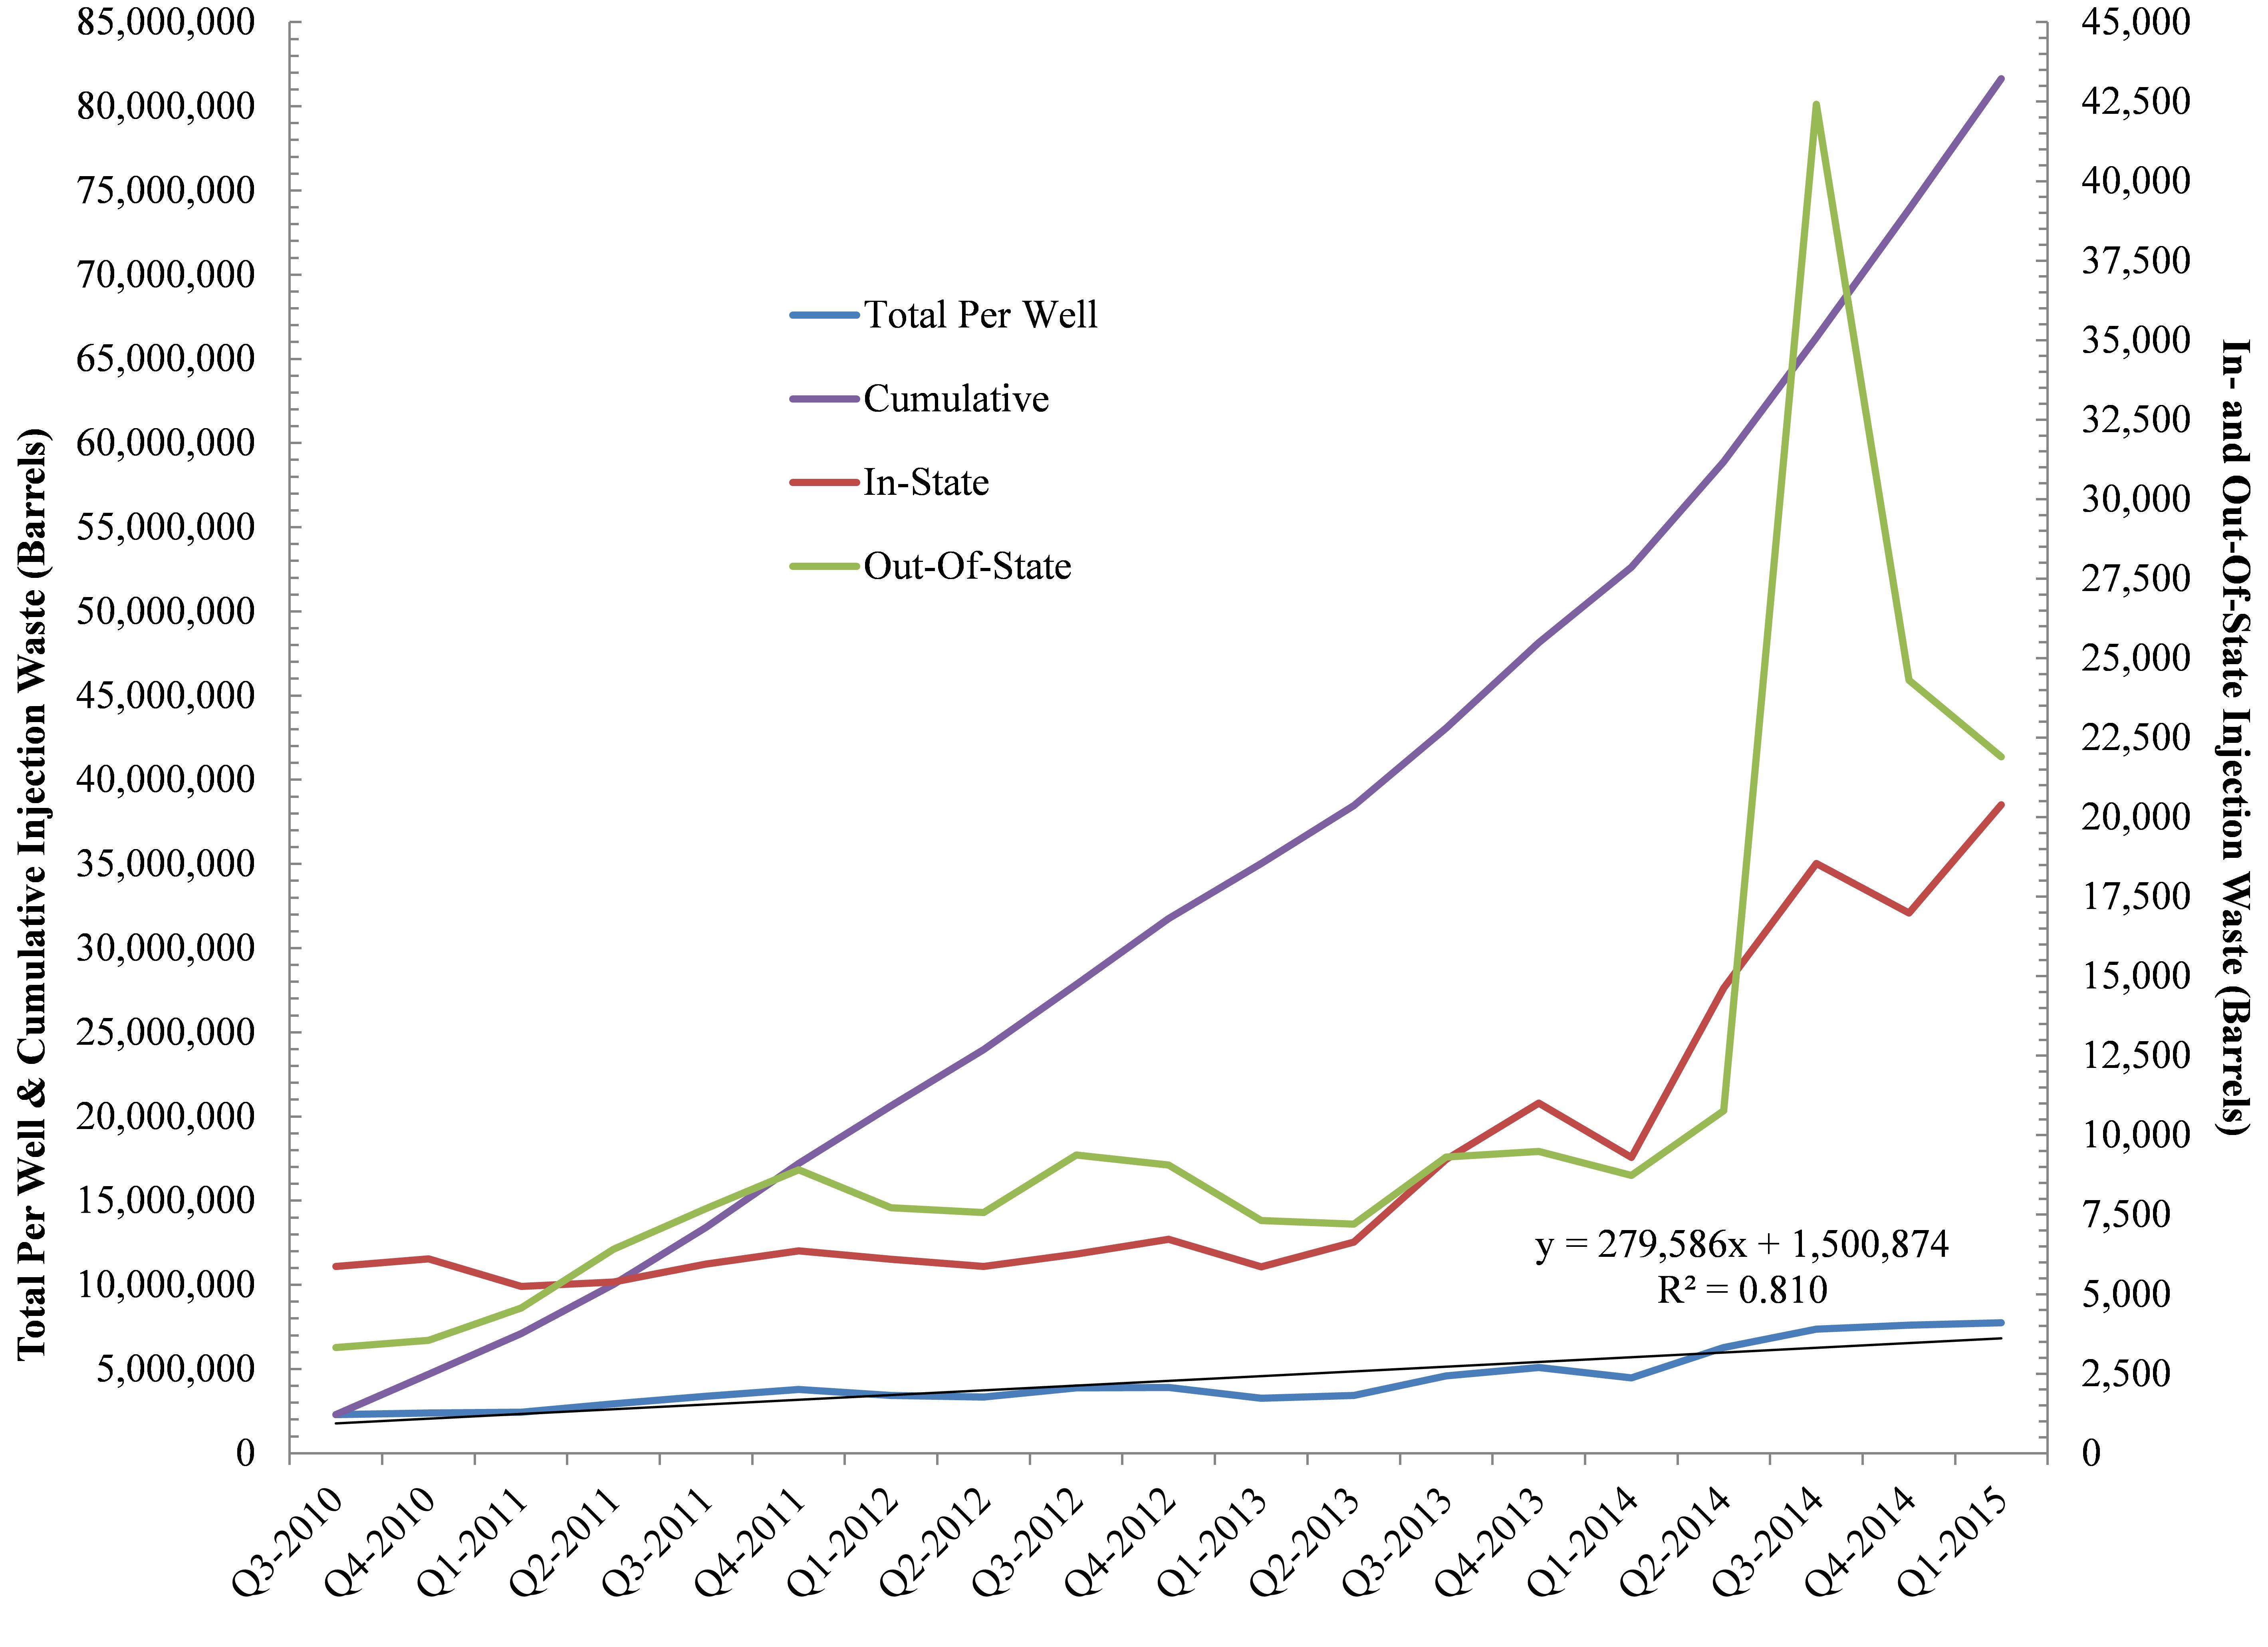
Figure 1. Ohio Class II Injection Well trends In- and Out-Of-State, Cumulatively, and on Per Well basis (n = 248).
For every gallon of freshwater used in the fracking process here in Ohio the industry is generating .03 gallons of brine (On average, Ohio’s 758 Utica wells use 6.88 million gallons of freshwater and produce 225,883 gallons of brine per well).
Back in August of 2013 the rate at which brine volumes were increasing was approaching 150,000 BPQPW (Learn more, Fig 5), however, that number has nearly doubled to +279,586 BPQPW (Note: 1 barrel of brine equals 32-42 gallons). Furthermore, Ohio’s Class II Injection wells are averaging 37,301 BPQPW (1.6 MGs) per quarter over the last year vs. 12,926 barrels BPQPW – all of this between the initiation of frack waste injection in 2010 and our last analysis up to and including Q2-2013. Finally, between Q3-2010 and Q1-2015 the exponential increase in injection activity has resulted in a total of 81.7 million barrels (2.6-3.4 billion gallons) of waste disposed of here in Ohio. From a dollars and cents perspective this waste has generated $2.5 million in revenue for the state or 00.01% of the average state budget (Note: 2.5% of ODNR’s annual budget).
Freshwater Demand Growing
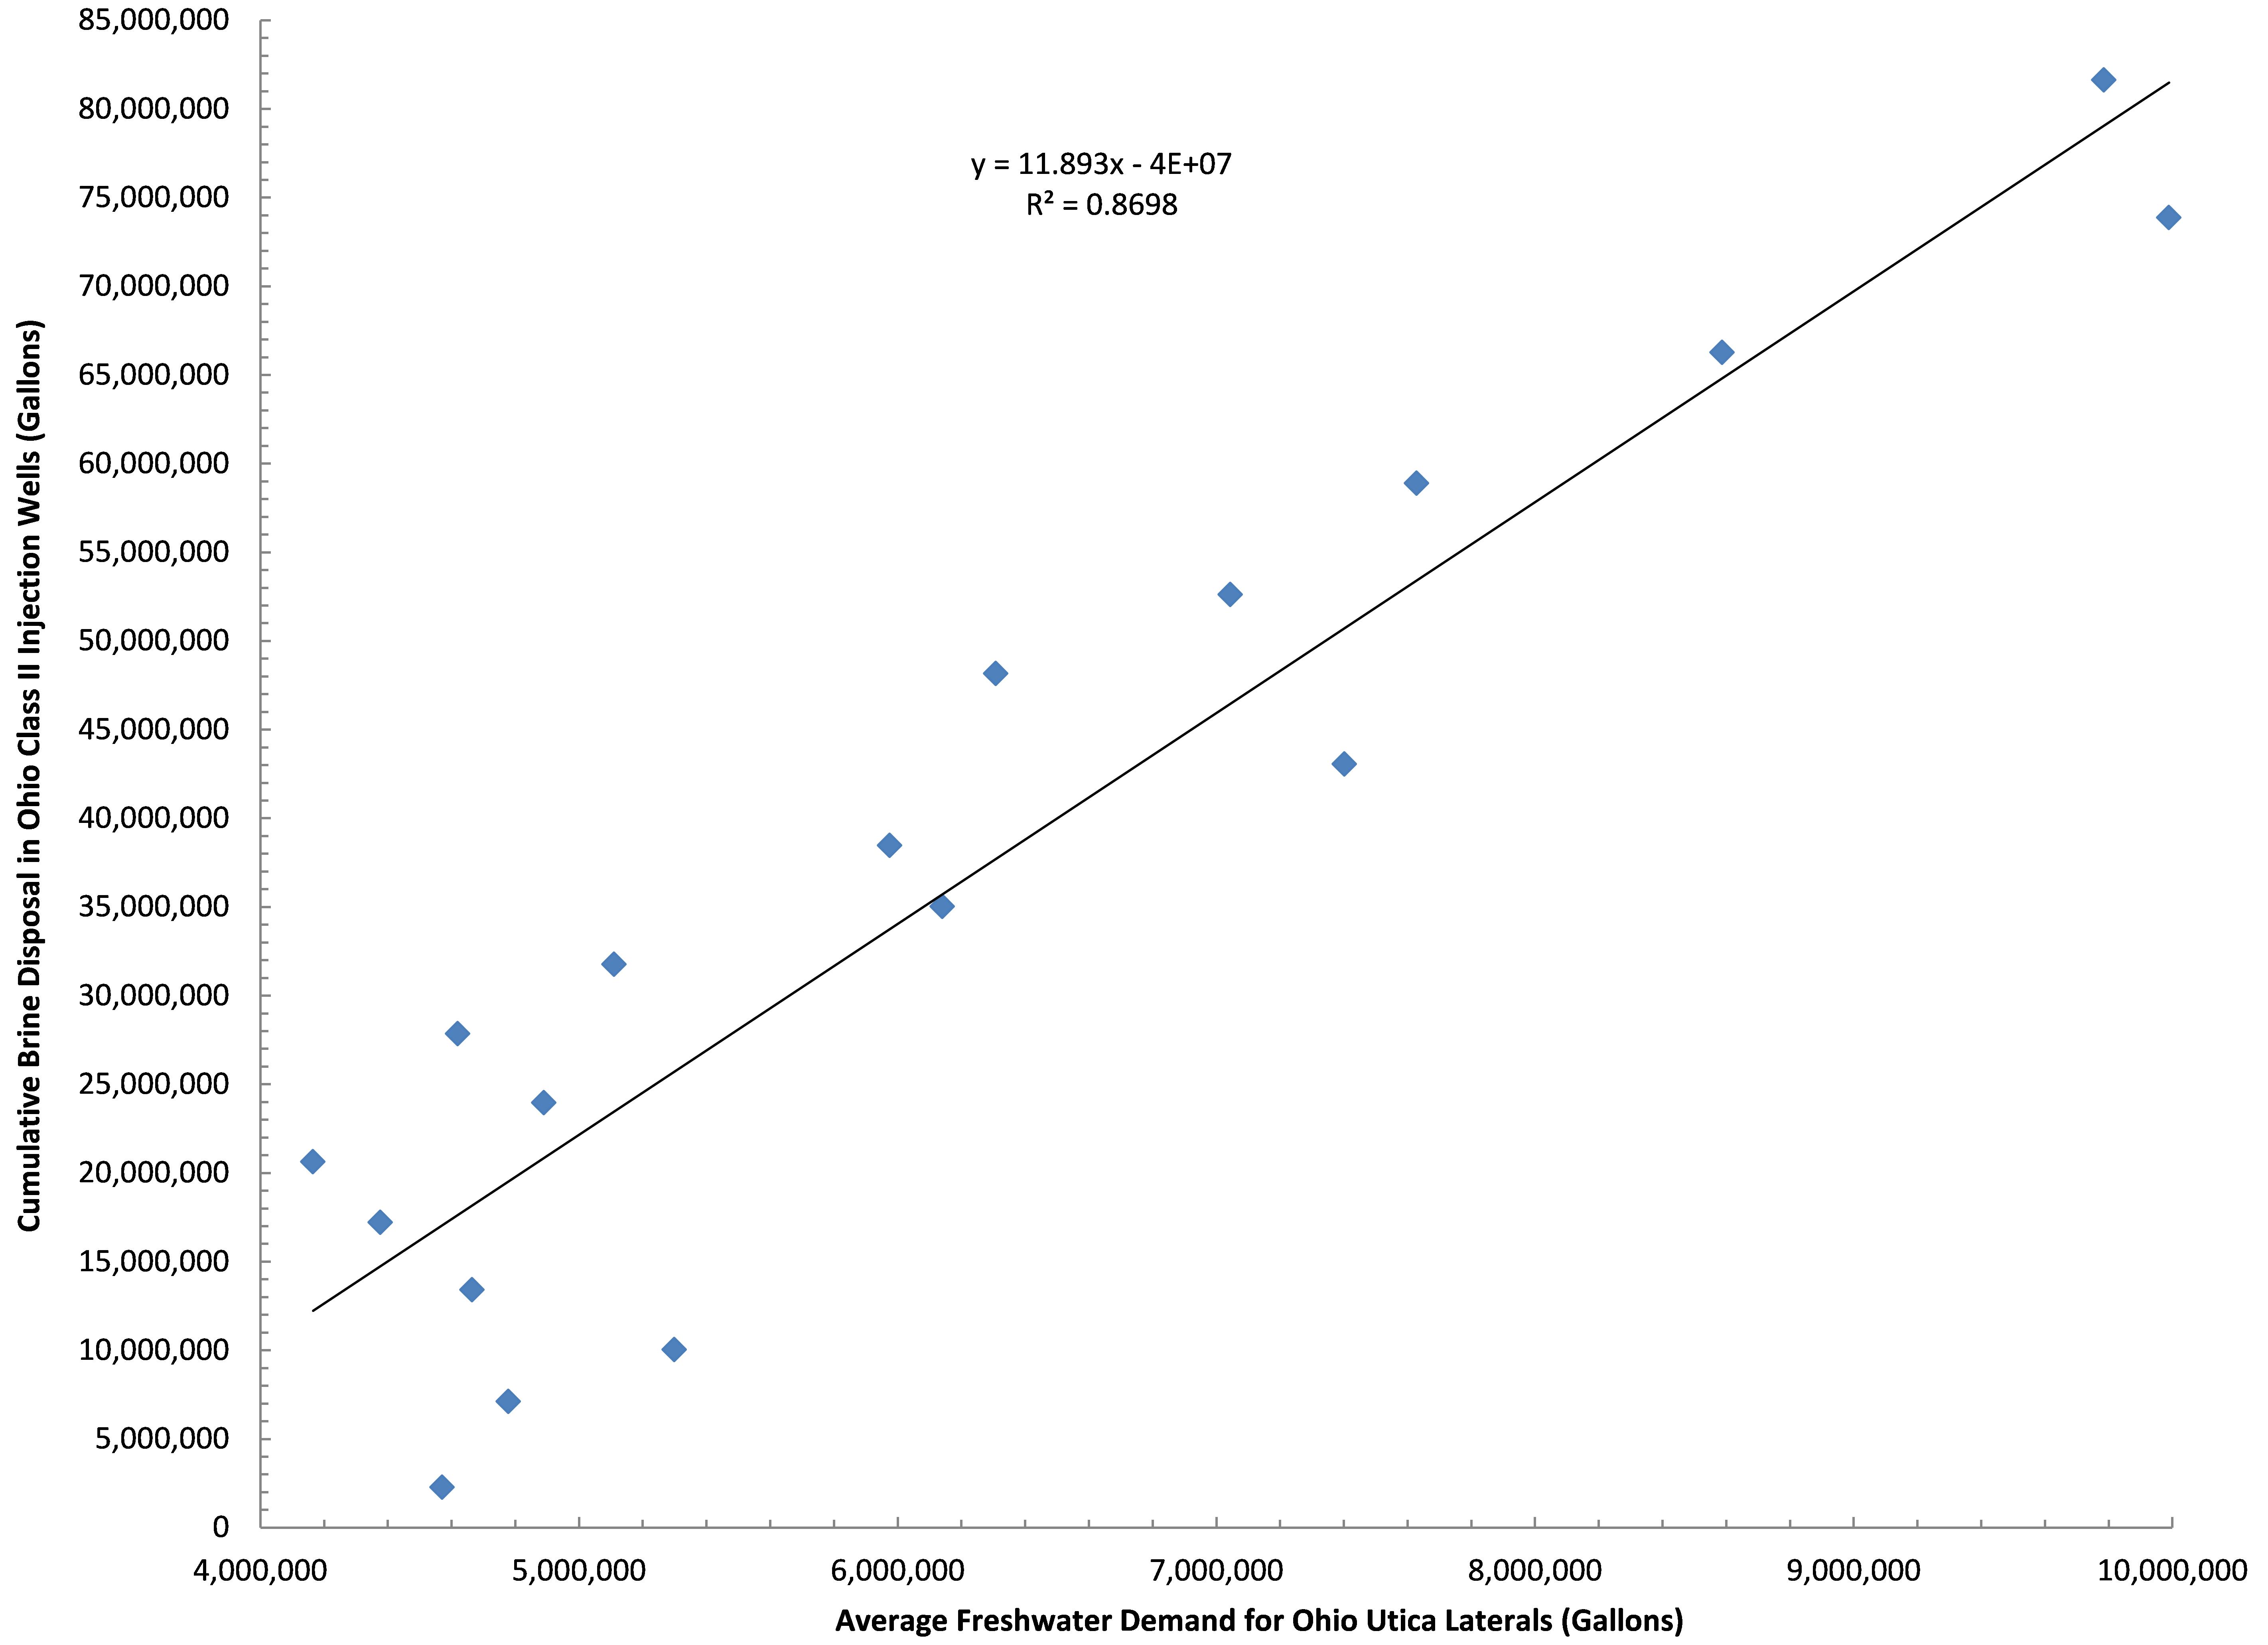
Figure 2. Ohio Class II Injection Well disposal as a function of freshwater demand by the shale industry in Ohio between Q3-2010 and Q1-2015.
The relationship between brine (waste) produced and freshwater needed by the hydraulic fracturing industry is an interesting one; average freshwater demand during the fracking process accounts for 87% of the trend in brine disposal here in Ohio (Fig. 2). The more water used, the more waste produced. Additionally, the demand for OH freshwater is growing to the tune of 405-410,000 gallons PQPW, which means brine production is growing by roughly 12,000 gallons PQPW. This says nothing for the 450,000 gallons of freshwater PQPW increase in West Virginia and their likely demand for injection sites that can accommodate their 13,500 gallons PQPW increase.
Where will all this waste go? I’ll give you two guesses, and the first one doesn’t count given that in the last month the ODNR has issued 7 new injection well permits with 9 pending according to the Center For Health and Environmental Justice’s Teresa Mills.
Trackbacks & Pingbacks
[…] [6] Tous ces chiffres sont tirés de cet article de synthèse de Ted Auch. […]
[…] les chiffres qui précèdent sont tirés de cet article de synthèse de Ted […]
Comments are closed.