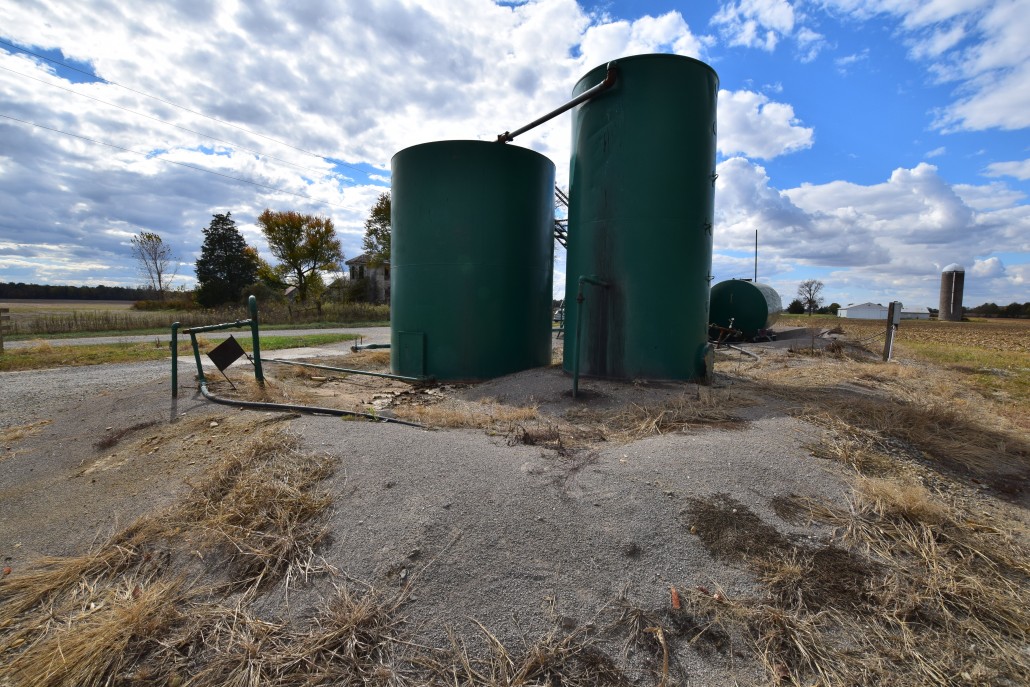
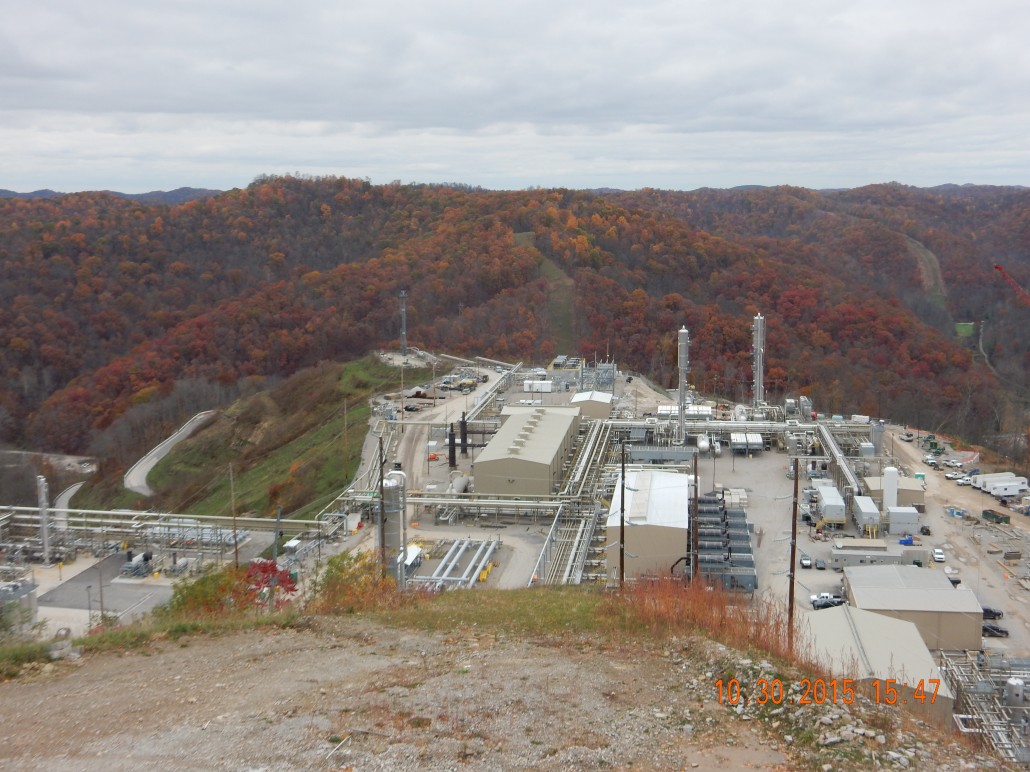
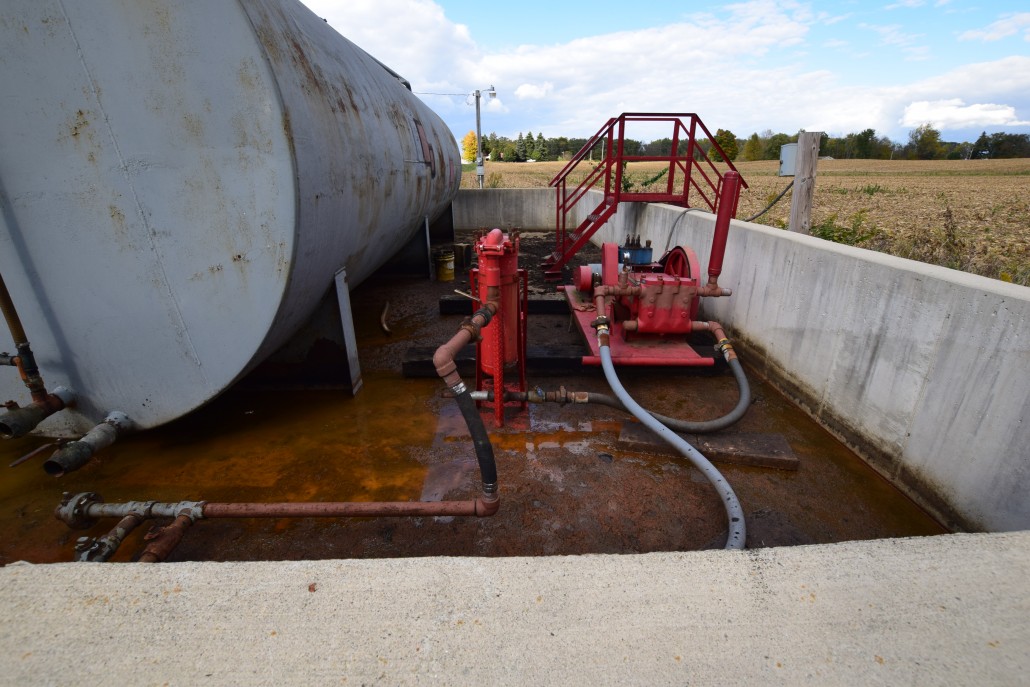
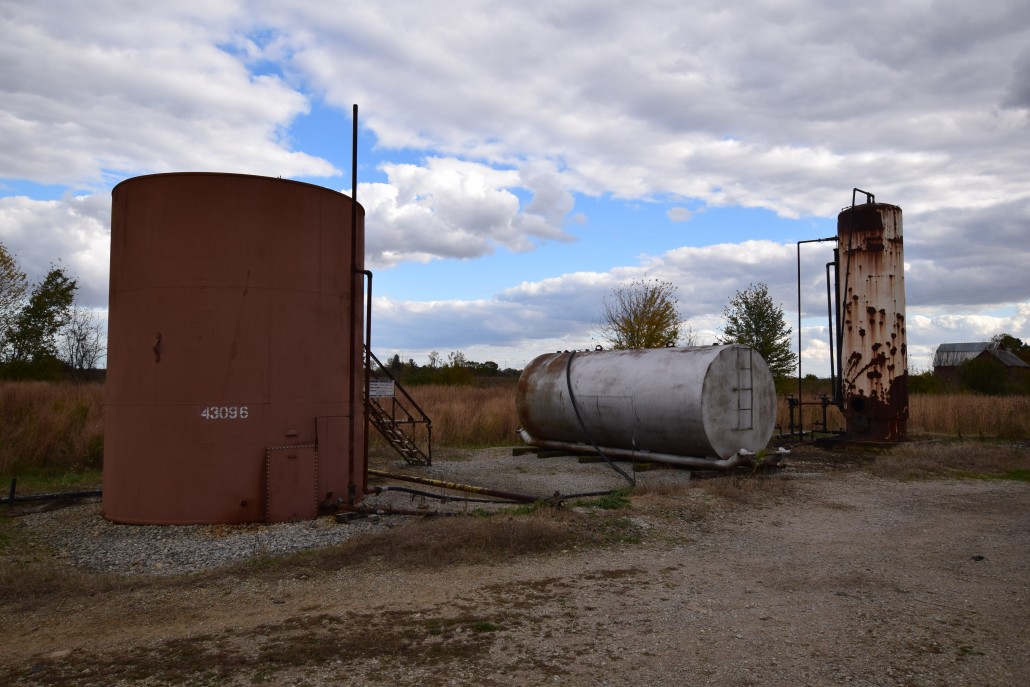
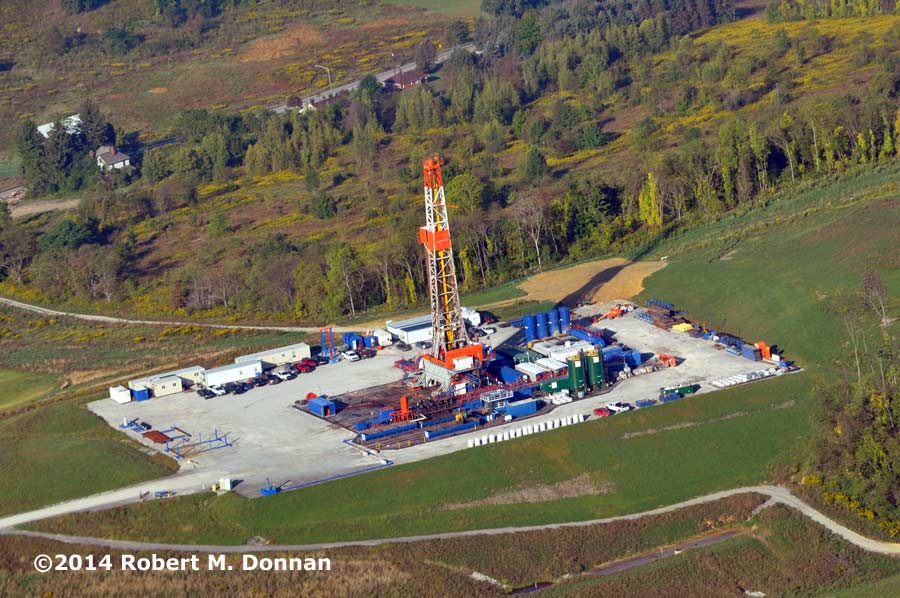
One of the many services that FracTracker offers is access to oil and gas photos. These have been contributed to our website by partners & FracTracker staff and can be used free of charge for non-commercial purposes. Please site the photographer if one is listed, however.
Over the last few months we have added additional oil and gas photos to the following location-based albums – and more photos and videos are coming soon! Click on the links below to explore:
If you would like to contribute photos or videos to this collection, please email us the files along with information on how to credit the photographer to: info@fractracker.org.
By Danny Kallich, Southwest Pennsylvania Environmental Health Project
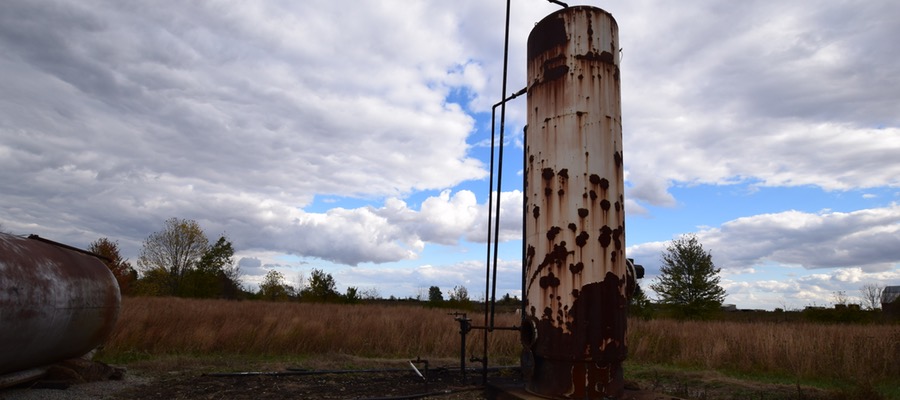
This article examines whether emergency responders are prepared in rural areas for oil and gas drilling emergencies, how people may be put at risk if the proper procedures aren’t in place, and other critical safety questions that citizens in Southwest Pennsylvania should be asking.
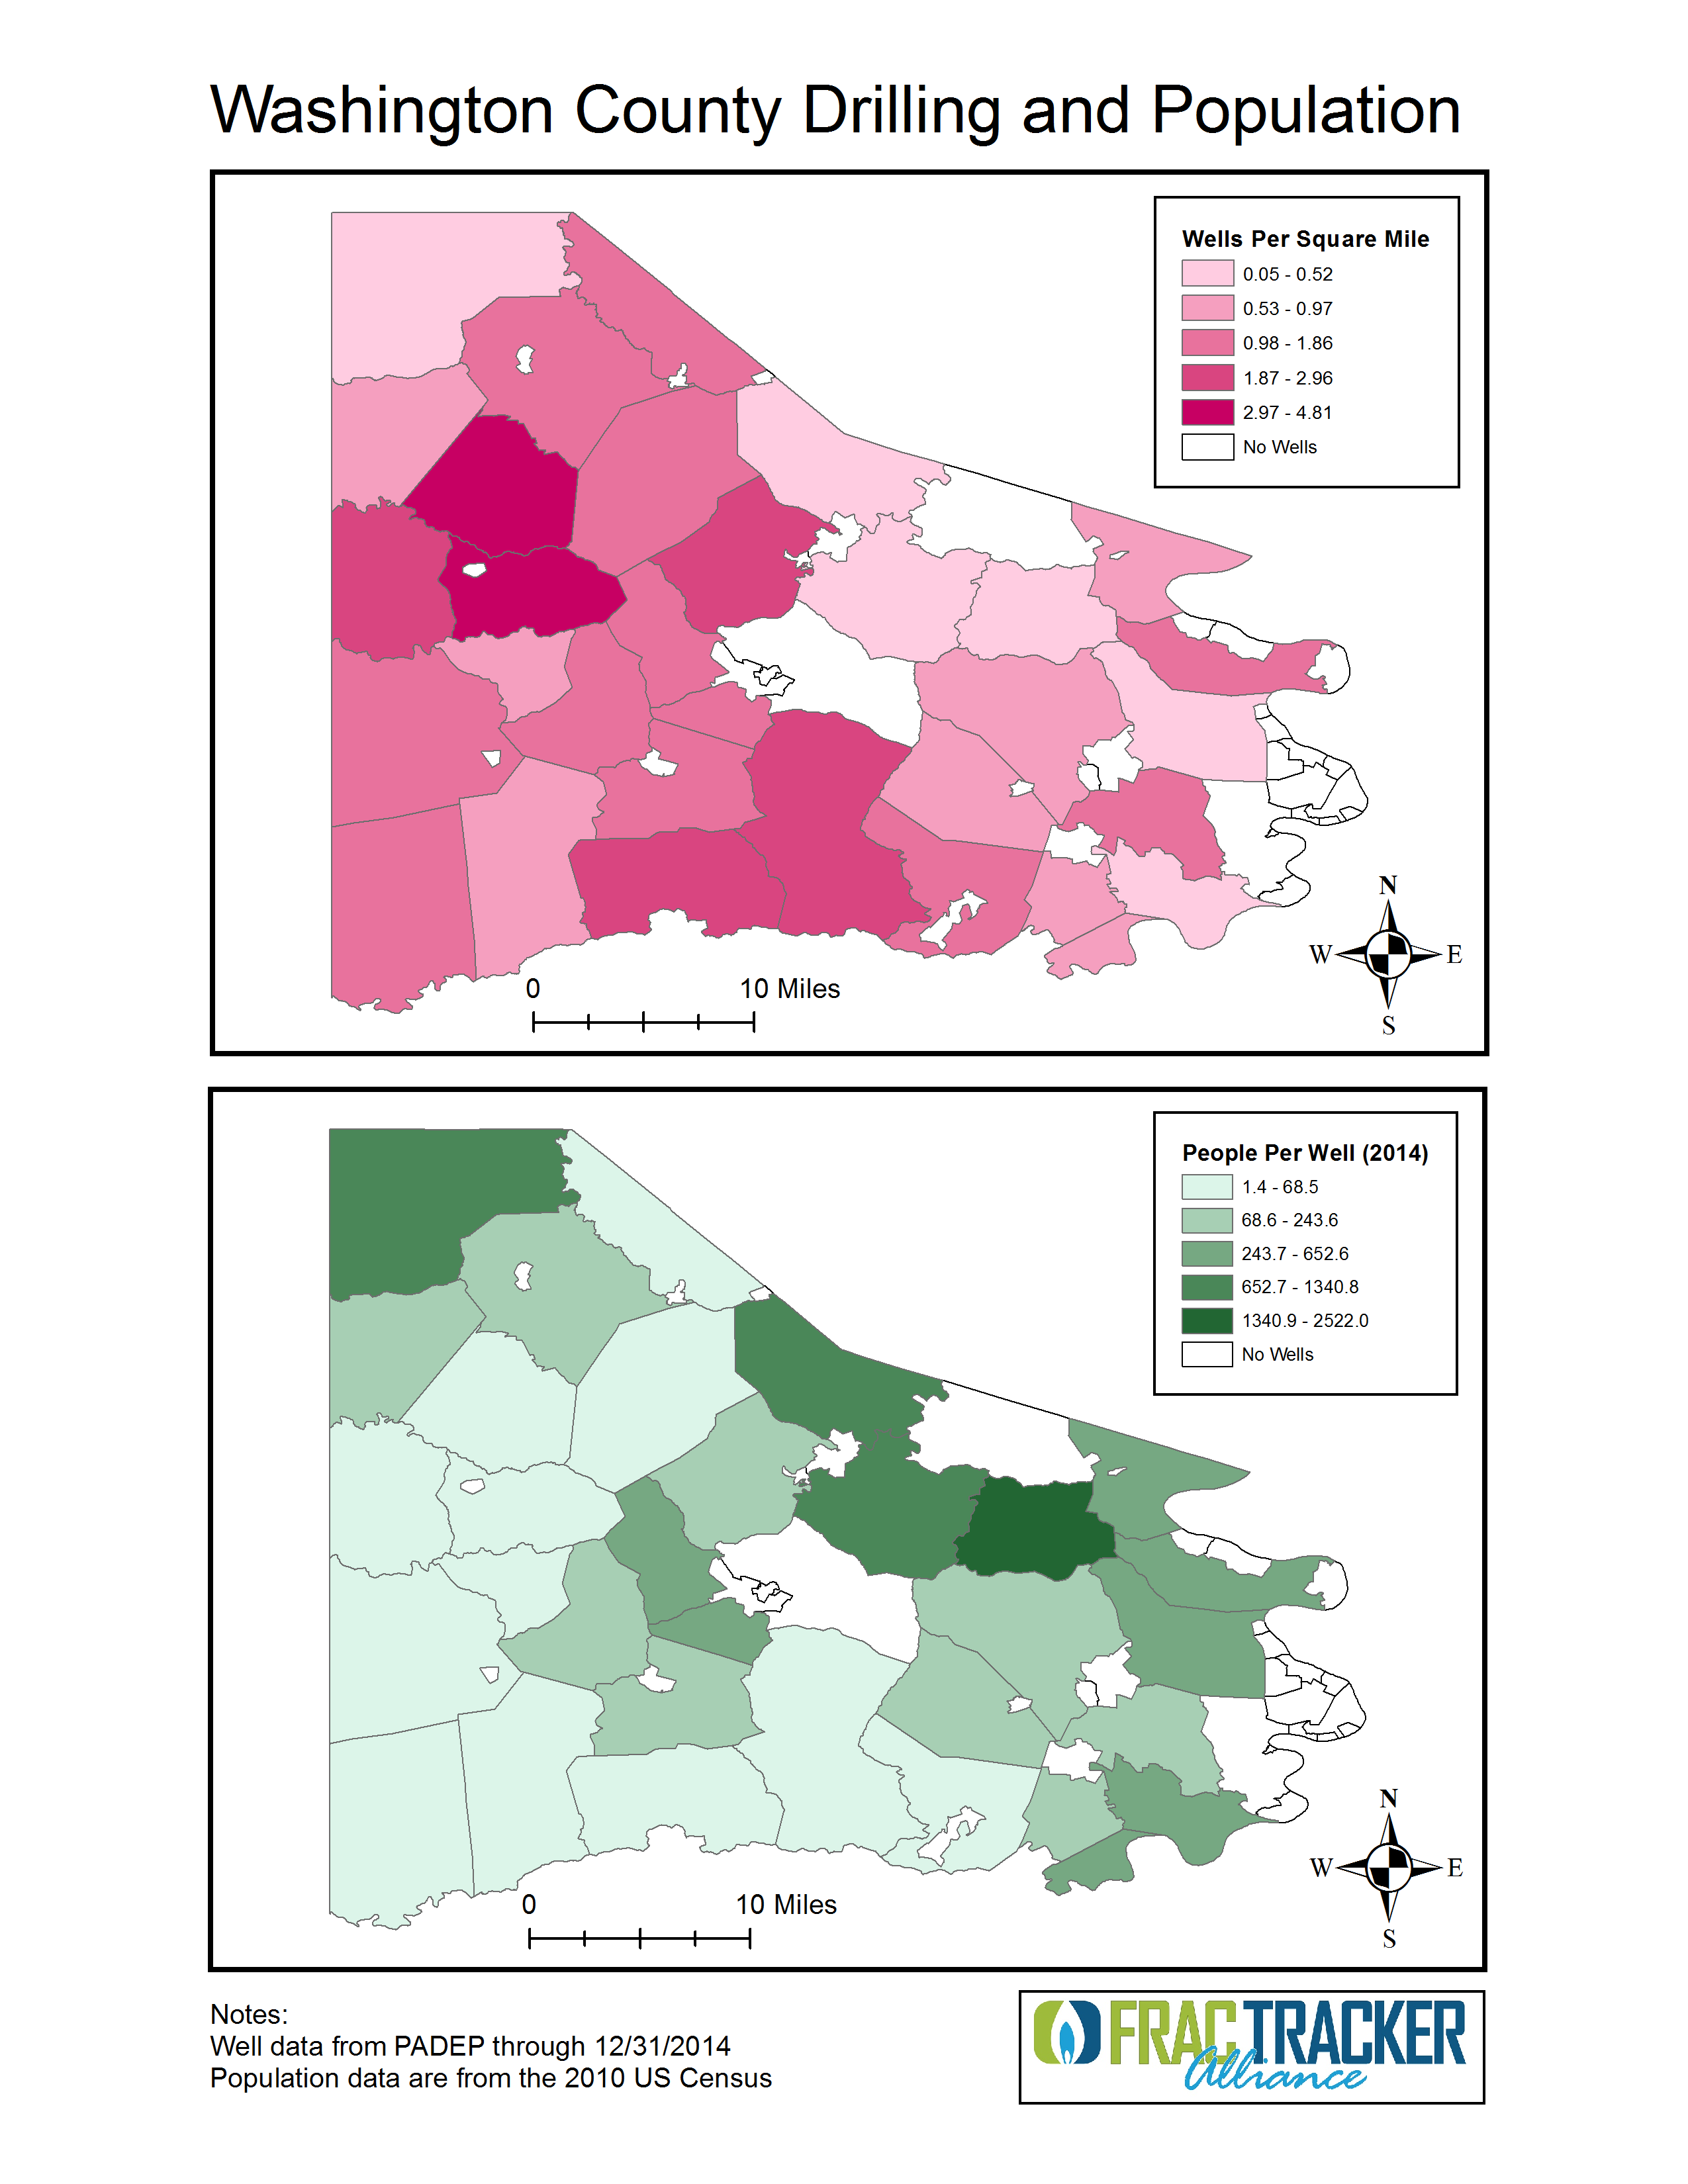
Maps of wells per sq. mile and people per well in Washington County, PA
The rapid spread of unconventional natural gas development (UNGD) across Pennsylvania has highlighted the need for state, county, and municipal agencies to regulate industry activity and protect the public on several fronts. In particular, comprehensive emergency preparedness and response specific to natural gas development is an obvious necessity for residents living within close proximity of wells, compressor stations, and other stages of UNGD.
While experts in the field of emergency planning are rightfully responsible for creating and executing emergency plans, the Federal Emergency Planning and Community Right to Know Act of 1986 (EPCRA) defines citizens’ rights to engage in the process, both through open records requests and public meetings with local emergency planners. EPCRA establishes roles and requirements for emergency planners while clarifying the rights of citizens to engage in dialogue with those responsible for safety about potentially harmful industrial activity in their community.
Unique Emergency Preparedness Challenges
UNGD presents a unique set of challenges for residents and emergency planners. The high likelihood that UNGD will be located in a rural area not typically supporting industrial use argues for the need for special treatment by emergency planners. Furthermore, responding to a UNGD emergency requires specialized training that is not mandated for local first responders, often volunteer fire fighters. While local first responders cannot be expected to specialize in UNGD related emergencies, it takes many hours for the contracted well-fire specialists, Texas-based Wild Well Control, to arrive and mitigate an emergency situation. The interim period between the arrival of local and county first responders and the arrival of Wild Well Control is, nonetheless, a critical time during which a system for consistent updates to nearby residents should be a priority. An emergency situation, as demonstrated by the February 11, 2014 Chevron Appalachia well fire, discussed below, can affect a community in a variety of ways, even if evacuation is not necessary.
Chevron Appalachia Incident, Greene County, PA
Testing The System:
Using Right-To-Know requests to gauge transparency & citizen awareness
The opportunities for citizen comment and engagement with emergency planners are limited and not well publicized. The dearth of clear and consistent means of communication between residents and those responsible for emergency planning provides a noteworthy opportunity to test the provisions of EPCRA as they relate to UNGD.
In this regard, testing the emergency response system related to oil and gas drilling emergencies is intended to analyze existent emergency plans, municipal preparedness, communication between county, municipal, and industry emergency planners, and perhaps most importantly, how much of this information is available to citizens.
The transparency of the system was tested by filing Right-To-Know requests. These public information requests were filed with nine municipalities in various counties across the state of Pennsylvania. All filed requests specifically asked for “all available county, municipal, and company generated emergency plans” in relation to specific well sites. One request asked for emergency plans generated by an elementary school in relation to a well site within approximately a half-mile.
Of these nine requests, three were fulfilled with returned emergency plans. Of the remaining six requests, five were not fulfilled because no emergency plan existed on record in the municipality. Initially, the request for the elementary school emergency plan was unable to be met by the municipal open records officer because no plan existed. Two months after that request, an unsolicited response from the same individual was received stating that the now-existent plan could not be shared because of security issues. A final question posed to the open records officer asked what concerned parents might be able to do to prepare themselves for emergency situations. This question, too, was deemed unanswerable due to security reasons. Another unmet municipal request was redirected to a county emergency planner who stated that the company generated plan was not theirs to distribute. Of the three emergency plans received, only one made any specific mention of residents living within close proximity; this response merely stated the number of nearby houses. Excluding GPS coordinates, no plan addressed any other infrastructure specific to the surrounding area, indicating a broad generality to their application.
The fact that six out of nine queried communities in PA were unable or unwilling to provide emergency response plans is highly concerning. These findings, when considered in the broader national context, indicate a significant chance that UNGD specific emergency planning and necessary communication with the public is deficient, particularly on the municipal level.
What Communities Need
Lack of specificity, inter-agency communication, and transparency indicate that the potential of EPCRA to benefit citizens has been largely untapped during the Marcellus Shale boom relative to emergency planning. Residents living within close proximity to UNGD should not only be apprised of emergency risk and strategy before an emergency arises, they should have a clearly accessible venue through which to voice concerns, needs, and recommendations. Furthermore, residents have valid reason to demand greater public oversight of current emergency planning efforts when the overwhelming majority of publicly available emergency plans fail to provide any information useful to a layperson.
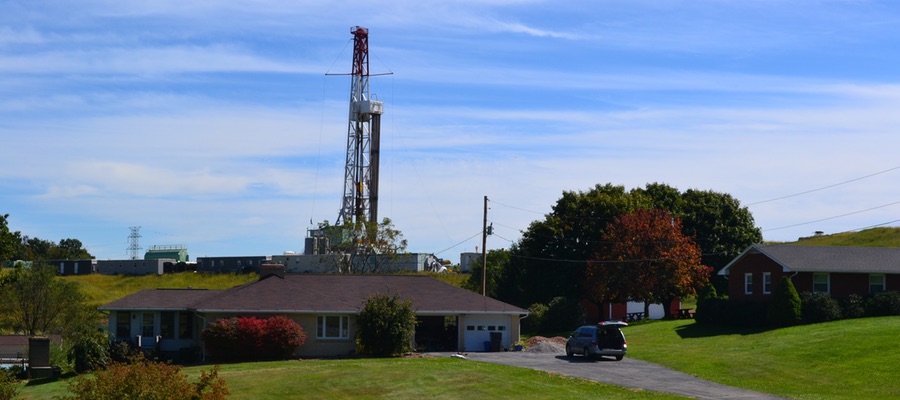
Currently, there are communities in which the questionable practice of locating UNGD within a half-mile of elementary schools and other sensitive areas continues. In such areas, every effort must be made to develop, institute, and practice emergency plans prioritizing the concerns, safety, and coordination of local residents. Recommendations for improved transparency include:
Make publicly available site-specific plans,
Hold regular public meetings, and
Prioritize communication between emergency responders and residents during emergency events
We encourage residents who are concerned about what their community is doing for UNGD-specific emergency planning to contact their local emergency responders and attend Local Emergency Planning Committee meetings in their county to advocate for such measures.
About EHP
The Southwest Pennsylvania Environmental Health Project (EHP) is a nonprofit environmental health organization created to assist and support Washington County residents who believe their health has been, or could be, impacted by natural gas drilling activities. Their Mission is to respond to individuals’ and communities’ need for access to accurate, timely and trusted public health information and health services associated with natural gas extraction.
In October 2014, the FracTracker Alliance performed an analysis showing an estimated 1.2 million people lived within a half mile of oil and gas wells in Pennsylvania. We have now updated the analysis, but this time, the unit of measure is one kilometer (0.62 miles).
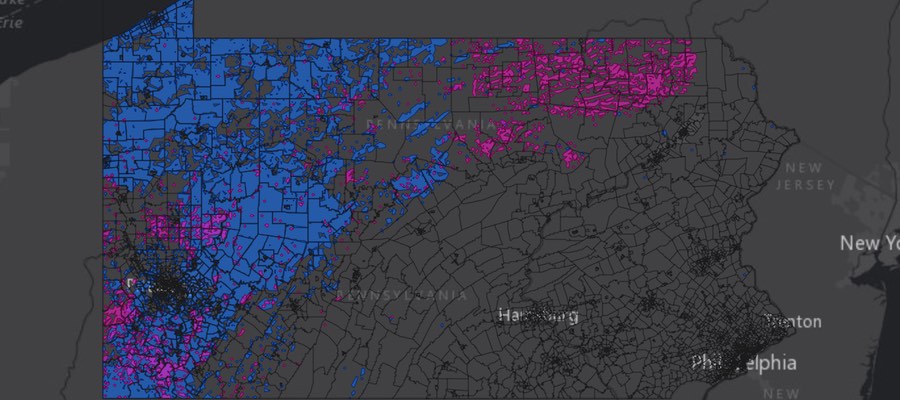
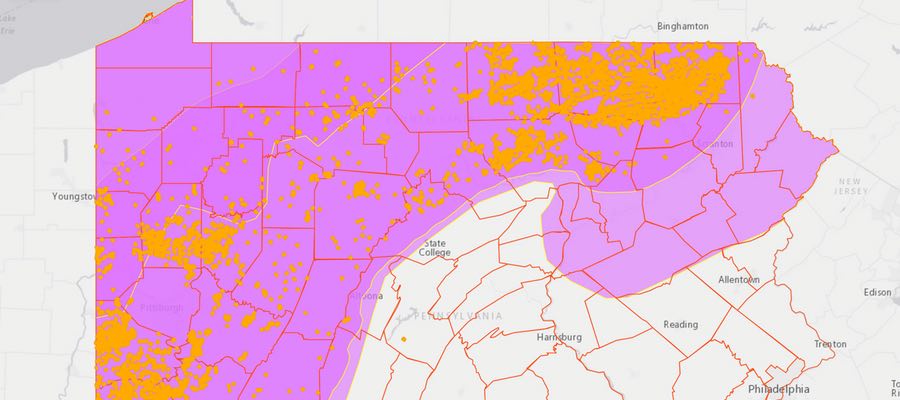
PA Population Within 1km of Active Oil and Gas Wells
This map shows the estimated population within one kilometer of active oil and gas wells in PA – a total of nearly 2 million Pennsylvanians. To access the full set of tools and details about how the map was made, click here for the full screen version of the map.
Methods
To get as complete a picture as possible of the oil and gas industry in PA, we queried the spud date report to show all wells that were listed as being spudded between January 1, 1800 and November 12, 2015. We used the former date because it appears to be a default for unknown spud dates, and the latter being the date that the data were downloaded for the analysis. Altogether, this yielded 203,887 oil and gas wells throughout the state, but 74,900 (37%) of these lacked location coordinates. All of those missing latitude and longitude data were classified as conventional wells, and many of them were fairly old. We then filtered out wells that were reported as not being drilled, as well as those that were permanently plugged, either by the operator, or by the PA Department of Environmental Protection (PADEP). The resulting set, which we refer to as “active” oil and gas wells, included 106,970 wells, of which 9,042 (8%) are defined as unconventional wells by the state.
To obtain an estimated population, we used the Census Tract level of detail, using official 2010 population figures. We calculated the area within 1 kilometer of active wells in three categories – conventional, unconventional, and all oil and gas wells. The population was then estimated by comparing the area inside the 1 km zone to the entire Census Tract, multiplying that ratio to the population of that tract, and repeating the process for each of the three datasets.
This area calculation was performed in Albers Equal Area projection optimized for the Great Lakes Basin area. Every method of flattening an area of a globe on the map will lead to some type of distortion, but this projection prioritizes area over other factors, and is therefore appropriate for this type of analysis.
Results
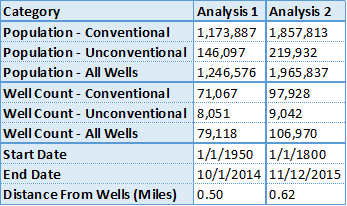
An additional year of drilling activity, a more comprehensive date range, and the slight increase of the radius distance has had a significant effect on the estimated population near wells. The 2014 analysis yielded an estimated 1,264,576 within a half-mile of wells, while the current analysis has the figure at 1,965,837, an increase of 55%. Below is a table showing differences between the two analyses:
This chart shows summaries of the current analysis of population within 1 km of wells in PA and an October 2014 version, showing population within a half-mile of wells.
One thing you will notice in this figure is that simply adding up the number of people who live in areas near unconventional and conventional drilling will not get you to the 1,965,837 figure we’ve presented. This is because some people live within the specified distance of both types of wells.
Additionally, it is impossible to say how many people live near the oil and gas wells that lack location data, as we obviously can’t map these wells. The majority of these wells may be in the areas that are already represented in the buffer zones, or they may extend that distance significantly.
https://www.fractracker.org/a5ej20sjfwe/wp-content/uploads/2015/11/PA-KM-Feature.jpg400900Matt Kelso, BAhttps://www.fractracker.org/a5ej20sjfwe/wp-content/uploads/2021/04/2021-FracTracker-logo-horizontal.pngMatt Kelso, BA2015-11-23 11:26:282020-03-12 17:37:22Nearly 2 Million Pennsylvanians Live Within a Kilometer of Oil & Gas Wells
Pennsylvania’s Drake Well is known for sparking the first oil boom in the United States in 1859. In more recent history, the industry has resurrected hydrocarbon extraction in the Commonwealth through unconventional oil and gas drilling – or fracking. Between 2002 and October 28, 2015, at least 16,826 of these high-impact wells have been approved statewide, and 9,508 drilled.
While standard maps can be useful to show the reach of the industry in aggregate, they aren’t the best way to show how drilling activity has changed over time. Luckily, we have other tools in the toolbox to show the trend. See drilling by year in this time sequence map below.
PA Unconventional Drilling Time Sequence Map
This representation starts slowly, just as the industry did in the state. Activity begins to pick up around 2008. In later years, watch exploration expand throughout the Marcellus and Utica shale plays. Eventually the activity concentrates in the northeastern and southwestern portions in the state.
https://www.fractracker.org/a5ej20sjfwe/wp-content/uploads/2015/11/PAViewer-Feature.jpg400900Matt Kelso, BAhttps://www.fractracker.org/a5ej20sjfwe/wp-content/uploads/2021/04/2021-FracTracker-logo-horizontal.pngMatt Kelso, BA2015-11-05 17:03:292020-03-12 17:37:38Time Sequence Map of PA Drilling Available
PA DCNR recently released a draft State Forest Resource Management Plan. The draft plan, last revised in 2007, is an important tool that the Bureau of Forestry (BOF) uses to help manage Pennsylvania’s approximately 2.2 million acre state forest system. Approximately 1.5 million acres of state forest lands lie within the shale gas fairway and gas extraction – along with related issues like water resources – is among the numerous subjects addressed in the document.
In total, approximately 673,000 acres are available for oil and gas development in PA state forests, either because private interests own the mineral rights below the land or because DCNR has opened up state-lands for drilling where it controls the mineral rights.
Approximately 386,000 acres have been leased by DCNR to allow drilling. DCNR’s shale gas monitoring report in 2014 said that only 16% of available state forest lands have been developed, which means that 84% (or 328,700 acres) could still be accessed for oil and gas through DCNR leases. Another 287,000 acres of state forest land sits atop private mineral rights. Mineral rights supersede – or overrule – those of the surface rights.
By some estimates, the projected “drillout” of state forest lands may include an additional 2,000 to 3,000 unconventional natural gas wells. There are concerns that the draft plan also does not adequately address the full scale and scope of such drilling and the serious impacts associated with it.
Derived from available data, FracTracker has prepared the following portrait of the projected impact to Pennsylvania’s state forest estate with emphasis on the resource-intensive nature of hydraulic fracturing and its extensive footprint on this sensitive landscape.
Table 1. Projected land use needed to add 2,000 to 3,000 more wells on PA state forestlands
Facility Type
Unit
Projected Drilled Wells
2,000
3,000
Well Pads
#
606
909
Acres
2,477
3,716
Limit Of Disturbance (LOD)*
Acres
7,130
10,695
Gathering Lines
Acres
20,189
30,284
Addtl. Mid/Down-stream Facilities
Acres
2,847
4,271
Compressor Stations**
#
126-210
189-316
Acres
2,978-4,976
4,466-7,464
ESTIMATED TOTAL
Acres
36,621
54,931
*Limit of Disturbance includes infrastructure, mounded earth, etc. needed to access and service the well pads. **1 compressor station is needed for every 25-30 miles of gathering lines, at 15-30 acres per station.
In Ohio, well pads average 4-5 acres, 3.4 laterals per well pad, and 8.5 acres of gathering line per acre of well pad. However, each pad has what we are calling a “Limit of Disturbance,” which includes infrastructure, mounded earth, etc. LOD likely represents a conservative estimate of miscellaneous land disturbance as it does not include the access roads; it was not possible with our current datasets to discern which roads were specifically added to access the well pads. LODs are averaging 10-14 acres.
Using the 2,000-3,000 wells proposed, the total acreage that could be disturbed by new well pads, well pad LODs, gathering lines, compressor stations, and related mid/downstream facilities in PA’s state forests would be between and 36,621 and 54,931 acres depending on the number and size of compressor stations (i.e., averaging 24 acres) (Table 1).
Water Use
Table 2. Projected resource use and waste produced per well based on OH, WV, and PA historical figures.
Variable
Unit
Avg
Increase / Quarter
Water Needed
Gallons
3.5 MGs
–
PA Stats
Gallons
4.4 MGs
–
OH Stats*
Gallons
6.2-7.0 MGs
405-410 K
WV Stats
Gallons
7.9 MGs
450 K
Drill Cuttings**
Tons
1,050
4.96
OH Stats
Tons
700+ (estimate)
4.7-5.2
PA Stats
Tons
1,400
–
Landfill Waste (Drilling Muds)
Tons / Facility
28,098
15,319
Silica Sand
Tons
4,303
86
Injection Waste
Gallons / Quarter
117 MGs
5.4 MGs
* 7-9% of injected fluids returns to the surface as fracking waste ** significantly dependent upon lateral length
https://www.fractracker.org/a5ej20sjfwe/wp-content/uploads/2015/10/Forest-PA-Feature.jpg400900FracTracker Alliancehttps://www.fractracker.org/a5ej20sjfwe/wp-content/uploads/2021/04/2021-FracTracker-logo-horizontal.pngFracTracker Alliance2015-11-04 10:40:372020-03-12 13:44:21The Ultimate Price of PA State Forest Drilling