

-29")


 Ted Auch, 2022. Photo courtesy of FracTracker Alliance.
https://fractracker.org/wp-content/uploads/2026/07/52406478291_9120a22e07_k.jpg
1083
1500
Shannon Smith
https://fractracker.org/wp-content/uploads/2025/09/2025-Wordmark-Logo.png
Shannon Smith2026-07-10 14:18:442026-07-10 14:22:59Pennsylvania 2025 Oil & Gas Production Report: Record Gas, Low-Producing Wells, and Long-Term Liabilities
Ted Auch, 2022. Photo courtesy of FracTracker Alliance.
https://fractracker.org/wp-content/uploads/2026/07/52406478291_9120a22e07_k.jpg
1083
1500
Shannon Smith
https://fractracker.org/wp-content/uploads/2025/09/2025-Wordmark-Logo.png
Shannon Smith2026-07-10 14:18:442026-07-10 14:22:59Pennsylvania 2025 Oil & Gas Production Report: Record Gas, Low-Producing Wells, and Long-Term LiabilitiesOil and Gas Wells in Pennsylvania
As of December 2025 there are records of 223,279 drilled and proposed wells in Pennsylvania, which have been assessed 89,487 violations since 2008.
-15")
Pennsylvania Unconventional Wells
15,150
Drilled unconventional wells as of September 2025
FEATURED MAPS
FracTracker Data Folder Contents
FracTracker provides state-specific data on issues such as:
- Locations of oil and gas facilities
- Pipelines and processor locations
- Production amount of oil and gas generated
- Amounts of waste generated from oil and gas
The data folders may also contain information on other energy generation locations, data from different years, and data on violations committed by oil and gas facilities. Amount of information and types of information will vary by state. Get data.
More Data Sources
Pennsylvania Spatial Data Access is Pennsylvania’s official public access geospatial information clearinghouse.
The Pennsylvania Department of Environmental Protection provides data on violations for download in their compliance report, wells drilled data in their spud data reports, and a number of other helpful resources for accessing oil and gas data (including unconventional / fracking data) in the Commonwealth.
LATEST PENNSYLVANIA ARTICLES
Ted Auch, 2022. Photo courtesy of FracTracker Alliance.
https://fractracker.org/wp-content/uploads/2026/07/52406478291_9120a22e07_k.jpg
1083
1500
Shannon Smith
https://fractracker.org/wp-content/uploads/2025/09/2025-Wordmark-Logo.png
Shannon Smith2026-07-10 14:18:442026-07-10 14:22:59Pennsylvania 2025 Oil & Gas Production Report: Record Gas, Low-Producing Wells, and Long-Term Liabilities https://fractracker.org/wp-content/uploads/2026/03/Web-Elements-Map-thumbnails-28.png
500
750
Shannon Smith
https://fractracker.org/wp-content/uploads/2025/09/2025-Wordmark-Logo.png
Shannon Smith2026-06-12 15:27:012026-07-10 14:27:18PA DEP Approves Unusual “Mineral Brine” Well in Erie County, Raising Concerns About New Regulatory Loophole
https://fractracker.org/wp-content/uploads/2026/03/Web-Elements-Map-thumbnails-28.png
500
750
Shannon Smith
https://fractracker.org/wp-content/uploads/2025/09/2025-Wordmark-Logo.png
Shannon Smith2026-06-12 15:27:012026-07-10 14:27:18PA DEP Approves Unusual “Mineral Brine” Well in Erie County, Raising Concerns About New Regulatory Loophole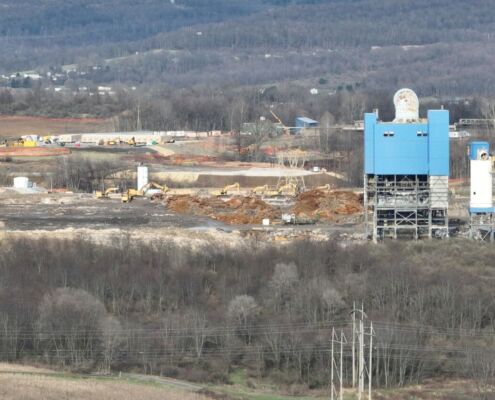 https://fractracker.org/wp-content/uploads/2026/05/Untitled-design.jpg
844
1500
FracTracker Alliance
https://fractracker.org/wp-content/uploads/2025/09/2025-Wordmark-Logo.png
FracTracker Alliance2026-04-30 17:32:352026-05-28 13:40:18From Coal Plant to AI Campus: FracTracker Documents Construction at Homer City
https://fractracker.org/wp-content/uploads/2026/05/Untitled-design.jpg
844
1500
FracTracker Alliance
https://fractracker.org/wp-content/uploads/2025/09/2025-Wordmark-Logo.png
FracTracker Alliance2026-04-30 17:32:352026-05-28 13:40:18From Coal Plant to AI Campus: FracTracker Documents Construction at Homer City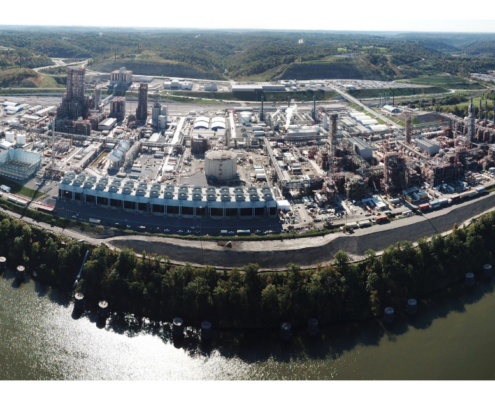 https://fractracker.org/wp-content/uploads/2026/03/Shell-Polymers-Data-Tool-Graphics.png
628
1200
Guest Author
https://fractracker.org/wp-content/uploads/2025/09/2025-Wordmark-Logo.png
Guest Author2026-03-26 15:42:172026-04-03 10:35:54FracTracker’s New Data Tool Visualizes Shell’s Pollution, Violations, and Malfunctions Ahead of Permit Public Hearing
https://fractracker.org/wp-content/uploads/2026/03/Shell-Polymers-Data-Tool-Graphics.png
628
1200
Guest Author
https://fractracker.org/wp-content/uploads/2025/09/2025-Wordmark-Logo.png
Guest Author2026-03-26 15:42:172026-04-03 10:35:54FracTracker’s New Data Tool Visualizes Shell’s Pollution, Violations, and Malfunctions Ahead of Permit Public Hearing https://fractracker.org/wp-content/uploads/2022/11/Fhn3YgeXkAI0QiX.jpg
675
1200
Katie Jones
https://fractracker.org/wp-content/uploads/2025/09/2025-Wordmark-Logo.png
Katie Jones2025-07-03 13:22:502026-01-14 17:55:32Shell Polymers Monaca: 17.9 Billion Pounds of Emissions and Repeated Violations in Pennsylvania
https://fractracker.org/wp-content/uploads/2022/11/Fhn3YgeXkAI0QiX.jpg
675
1200
Katie Jones
https://fractracker.org/wp-content/uploads/2025/09/2025-Wordmark-Logo.png
Katie Jones2025-07-03 13:22:502026-01-14 17:55:32Shell Polymers Monaca: 17.9 Billion Pounds of Emissions and Repeated Violations in Pennsylvania https://fractracker.org/wp-content/uploads/2016/07/DSC_0266_LowRes.jpg
3000
4496
FracTracker Alliance
https://fractracker.org/wp-content/uploads/2025/09/2025-Wordmark-Logo.png
FracTracker Alliance2025-06-30 14:48:532025-07-03 13:47:59Plum Borough Rejects Fracking Waste Injection Well After Public Pushback
https://fractracker.org/wp-content/uploads/2016/07/DSC_0266_LowRes.jpg
3000
4496
FracTracker Alliance
https://fractracker.org/wp-content/uploads/2025/09/2025-Wordmark-Logo.png
FracTracker Alliance2025-06-30 14:48:532025-07-03 13:47:59Plum Borough Rejects Fracking Waste Injection Well After Public Pushback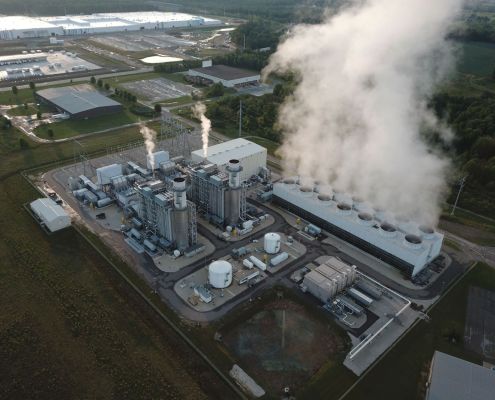 https://fractracker.org/wp-content/uploads/2025/05/51382261216_f8af819a45_o.jpg
1125
1500
Guest Author
https://fractracker.org/wp-content/uploads/2025/09/2025-Wordmark-Logo.png
Guest Author2025-05-31 12:00:592026-03-13 12:05:07Power Plant Locations and Unemployment Rates
https://fractracker.org/wp-content/uploads/2025/05/51382261216_f8af819a45_o.jpg
1125
1500
Guest Author
https://fractracker.org/wp-content/uploads/2025/09/2025-Wordmark-Logo.png
Guest Author2025-05-31 12:00:592026-03-13 12:05:07Power Plant Locations and Unemployment Rates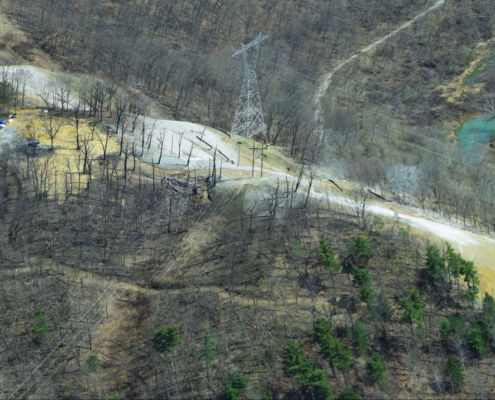 https://fractracker.org/wp-content/uploads/2021/04/49770601811_6cc7e18996_k.jpg
716
1500
Matt Kelso, BA
https://fractracker.org/wp-content/uploads/2025/09/2025-Wordmark-Logo.png
Matt Kelso, BA2025-04-07 15:42:272025-04-07 15:42:27Pipeline Incidents Are a Daily Occurrence
https://fractracker.org/wp-content/uploads/2021/04/49770601811_6cc7e18996_k.jpg
716
1500
Matt Kelso, BA
https://fractracker.org/wp-content/uploads/2025/09/2025-Wordmark-Logo.png
Matt Kelso, BA2025-04-07 15:42:272025-04-07 15:42:27Pipeline Incidents Are a Daily Occurrence https://www.flickr.com/people/10175246@N08
https://fractracker.org/wp-content/uploads/2025/04/Lighthouse_on_shannon_river_8051332659_2.jpg
1000
1500
Shannon Smith
https://fractracker.org/wp-content/uploads/2025/09/2025-Wordmark-Logo.png
Shannon Smith2025-03-31 14:18:352025-04-01 16:56:15Greenwashed “Security”: The Truth Behind Ireland’s LNG Terminal Plans
https://www.flickr.com/people/10175246@N08
https://fractracker.org/wp-content/uploads/2025/04/Lighthouse_on_shannon_river_8051332659_2.jpg
1000
1500
Shannon Smith
https://fractracker.org/wp-content/uploads/2025/09/2025-Wordmark-Logo.png
Shannon Smith2025-03-31 14:18:352025-04-01 16:56:15Greenwashed “Security”: The Truth Behind Ireland’s LNG Terminal Plans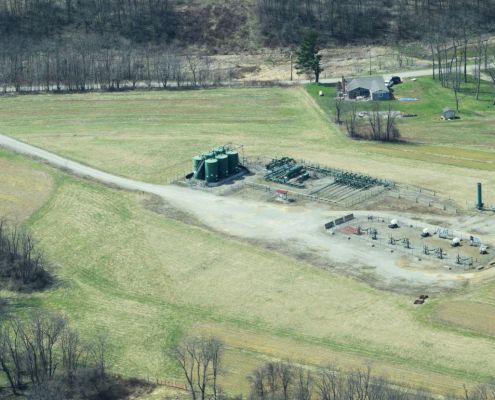 https://fractracker.org/wp-content/uploads/2025/03/3_TAuch_Infrastructure-FrackPad-SouthwestPA_April2019.jpg
830
1500
Katie Jones
https://fractracker.org/wp-content/uploads/2025/09/2025-Wordmark-Logo.png
Katie Jones2025-03-26 14:05:222025-04-01 12:29:01How Increased Protective Buffer Zones Could Help Protect 3.6 million Pennsylvanians
https://fractracker.org/wp-content/uploads/2025/03/3_TAuch_Infrastructure-FrackPad-SouthwestPA_April2019.jpg
830
1500
Katie Jones
https://fractracker.org/wp-content/uploads/2025/09/2025-Wordmark-Logo.png
Katie Jones2025-03-26 14:05:222025-04-01 12:29:01How Increased Protective Buffer Zones Could Help Protect 3.6 million Pennsylvanians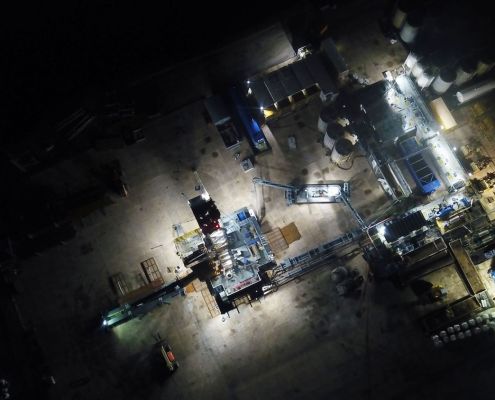 FracTracker Alliance
https://fractracker.org/wp-content/uploads/2025/03/49811276952_cf44185f24_k.jpg
844
1500
Shannon Smith
https://fractracker.org/wp-content/uploads/2025/09/2025-Wordmark-Logo.png
Shannon Smith2025-02-28 10:11:582025-03-03 15:32:59FracTracker Alliance Calls for Independent Science in Pennsylvania
FracTracker Alliance
https://fractracker.org/wp-content/uploads/2025/03/49811276952_cf44185f24_k.jpg
844
1500
Shannon Smith
https://fractracker.org/wp-content/uploads/2025/09/2025-Wordmark-Logo.png
Shannon Smith2025-02-28 10:11:582025-03-03 15:32:59FracTracker Alliance Calls for Independent Science in Pennsylvania https://fractracker.org/wp-content/uploads/2018/11/VoteBoldly-Flag-Sunset-Home.jpg
430
1500
Sarah Carballo
https://fractracker.org/wp-content/uploads/2025/09/2025-Wordmark-Logo.png
Sarah Carballo2024-10-17 14:54:042024-10-17 14:54:04Fracking’s Role in the 2024 Election: An Uncertain Future for Pennsylvania and Beyond
https://fractracker.org/wp-content/uploads/2018/11/VoteBoldly-Flag-Sunset-Home.jpg
430
1500
Sarah Carballo
https://fractracker.org/wp-content/uploads/2025/09/2025-Wordmark-Logo.png
Sarah Carballo2024-10-17 14:54:042024-10-17 14:54:04Fracking’s Role in the 2024 Election: An Uncertain Future for Pennsylvania and Beyond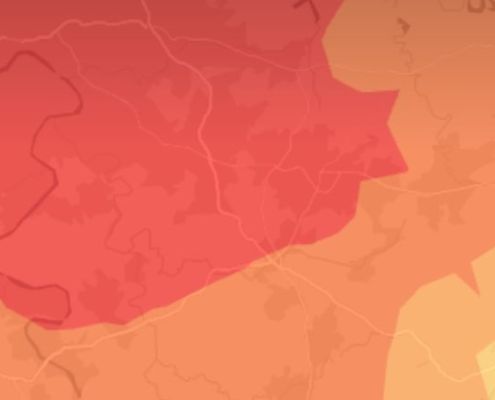 https://fractracker.org/wp-content/uploads/2024/09/Satellite-emissions-feature.jpeg
443
1500
FracTracker Alliance
https://fractracker.org/wp-content/uploads/2025/09/2025-Wordmark-Logo.png
FracTracker Alliance2024-09-03 14:23:262025-05-02 14:52:33Mapping the Invisible Threat: Emissions from Oil and Gas
https://fractracker.org/wp-content/uploads/2024/09/Satellite-emissions-feature.jpeg
443
1500
FracTracker Alliance
https://fractracker.org/wp-content/uploads/2025/09/2025-Wordmark-Logo.png
FracTracker Alliance2024-09-03 14:23:262025-05-02 14:52:33Mapping the Invisible Threat: Emissions from Oil and Gas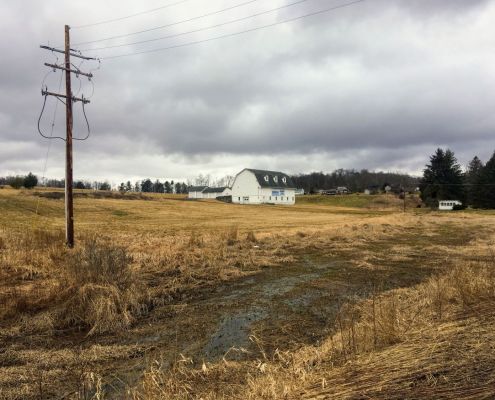 https://fractracker.org/wp-content/uploads/2022/04/PA_Dimock_Eureka.jpg
1125
1500
Sarah Carballo
https://fractracker.org/wp-content/uploads/2025/09/2025-Wordmark-Logo.png
Sarah Carballo2024-08-01 21:40:462024-08-02 17:54:29How Fracking Bans Protect Communities and the Environment
https://fractracker.org/wp-content/uploads/2022/04/PA_Dimock_Eureka.jpg
1125
1500
Sarah Carballo
https://fractracker.org/wp-content/uploads/2025/09/2025-Wordmark-Logo.png
Sarah Carballo2024-08-01 21:40:462024-08-02 17:54:29How Fracking Bans Protect Communities and the Environment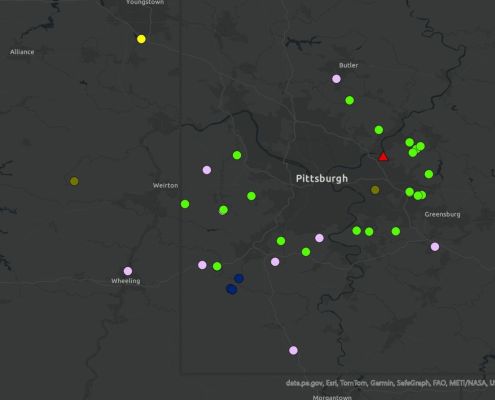 https://fractracker.org/wp-content/uploads/2024/08/Midas6M_RecvFacil_042024_Header.jpg
891
1500
Matt Kelso, BA
https://fractracker.org/wp-content/uploads/2025/09/2025-Wordmark-Logo.png
Matt Kelso, BA2024-08-01 20:41:312024-08-02 17:55:17Pennsylvania Oil and Gas Industry Trends: Drilled Wells, Violations, Production, and Waste
https://fractracker.org/wp-content/uploads/2024/08/Midas6M_RecvFacil_042024_Header.jpg
891
1500
Matt Kelso, BA
https://fractracker.org/wp-content/uploads/2025/09/2025-Wordmark-Logo.png
Matt Kelso, BA2024-08-01 20:41:312024-08-02 17:55:17Pennsylvania Oil and Gas Industry Trends: Drilled Wells, Violations, Production, and Waste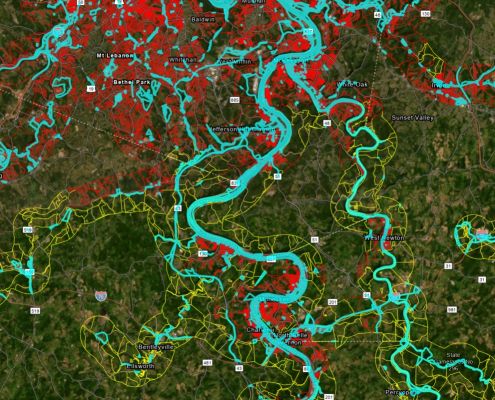 https://fractracker.org/wp-content/uploads/2025/09/2025-Wordmark-Logo.png
0
0
FracTracker Alliance
https://fractracker.org/wp-content/uploads/2025/09/2025-Wordmark-Logo.png
FracTracker Alliance2024-06-05 17:41:582024-06-06 09:18:40A Closer Look at Risks of the Appalachian Hydrogen Hub
https://fractracker.org/wp-content/uploads/2025/09/2025-Wordmark-Logo.png
0
0
FracTracker Alliance
https://fractracker.org/wp-content/uploads/2025/09/2025-Wordmark-Logo.png
FracTracker Alliance2024-06-05 17:41:582024-06-06 09:18:40A Closer Look at Risks of the Appalachian Hydrogen Hub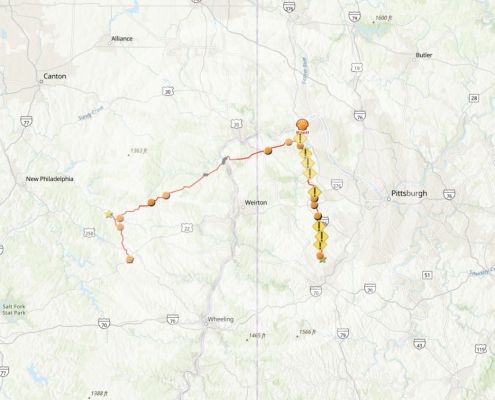 FracTracker Alliance, 2024
https://fractracker.org/wp-content/uploads/2024/06/Falcon-Pipeline-Violations-2024.jpg
844
1500
Katie Jones
https://fractracker.org/wp-content/uploads/2025/09/2025-Wordmark-Logo.png
Katie Jones2024-06-05 10:35:022024-06-05 11:36:30Falcon Pipeline Criminal Charges Explained
FracTracker Alliance, 2024
https://fractracker.org/wp-content/uploads/2024/06/Falcon-Pipeline-Violations-2024.jpg
844
1500
Katie Jones
https://fractracker.org/wp-content/uploads/2025/09/2025-Wordmark-Logo.png
Katie Jones2024-06-05 10:35:022024-06-05 11:36:30Falcon Pipeline Criminal Charges Explained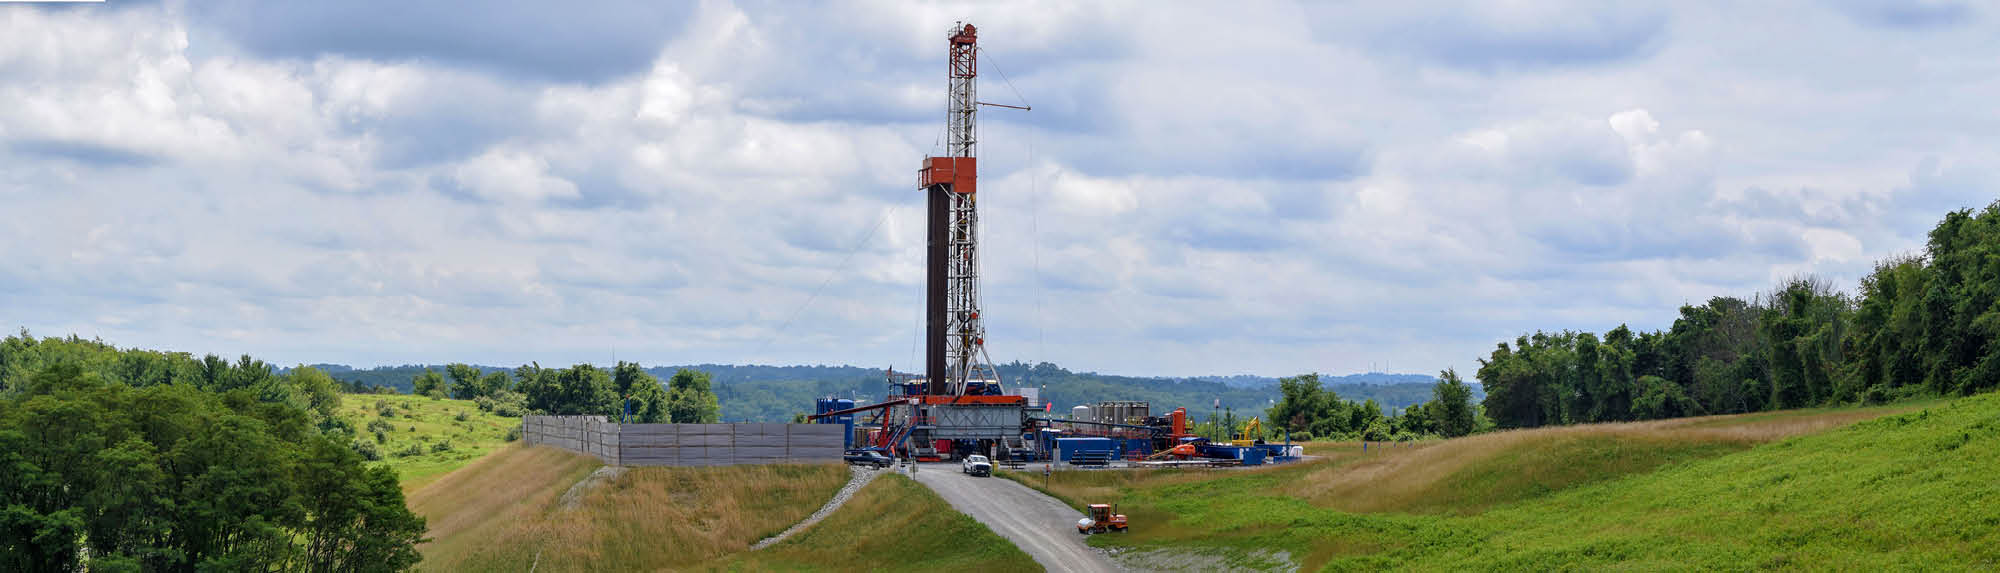 https://fractracker.org/wp-content/uploads/2019/12/Drilling-rig-in-Washington-County-Pennsylvania.jpg
573
2000
Katie Jones
https://fractracker.org/wp-content/uploads/2025/09/2025-Wordmark-Logo.png
Katie Jones2024-05-02 15:54:282025-05-21 12:33:41Not-So-Radical Transparency: An Ineffective and Unnecessary Partnership Between Pennsylvania Governor Shapiro and the Gas Company CNX
https://fractracker.org/wp-content/uploads/2019/12/Drilling-rig-in-Washington-County-Pennsylvania.jpg
573
2000
Katie Jones
https://fractracker.org/wp-content/uploads/2025/09/2025-Wordmark-Logo.png
Katie Jones2024-05-02 15:54:282025-05-21 12:33:41Not-So-Radical Transparency: An Ineffective and Unnecessary Partnership Between Pennsylvania Governor Shapiro and the Gas Company CNX https://fractracker.org/wp-content/uploads/2022/02/Delaware-River-Feature.jpg
667
1500
FracTracker Alliance
https://fractracker.org/wp-content/uploads/2025/09/2025-Wordmark-Logo.png
FracTracker Alliance2024-03-04 14:25:182024-03-04 14:25:18Staff Spotlight: Katie Jones
https://fractracker.org/wp-content/uploads/2023/12/Figure-6-Rail-Population.jpg
801
1498
Matt Kelso, BA
https://fractracker.org/wp-content/uploads/2025/09/2025-Wordmark-Logo.png
Matt Kelso, BA2023-12-14 16:26:372023-12-15 11:47:53On the Wrong Track: Risks to Residents of the Upper Ohio River Valley From Railroad Incidents
https://fractracker.org/wp-content/uploads/2022/02/Delaware-River-Feature.jpg
667
1500
FracTracker Alliance
https://fractracker.org/wp-content/uploads/2025/09/2025-Wordmark-Logo.png
FracTracker Alliance2024-03-04 14:25:182024-03-04 14:25:18Staff Spotlight: Katie Jones
https://fractracker.org/wp-content/uploads/2023/12/Figure-6-Rail-Population.jpg
801
1498
Matt Kelso, BA
https://fractracker.org/wp-content/uploads/2025/09/2025-Wordmark-Logo.png
Matt Kelso, BA2023-12-14 16:26:372023-12-15 11:47:53On the Wrong Track: Risks to Residents of the Upper Ohio River Valley From Railroad Incidents![]()
216 Franklin St, Suite 400, Johnstown, PA 15901
Phone: +1 (717) 303-0403 | info@fractracker.org
FracTracker Alliance is a 501(c)3 non-profit: Tax identification number: 80-0844297