Updated Pipeline Incident Analysis
By Matt Kelso, Manager of Data & Technology
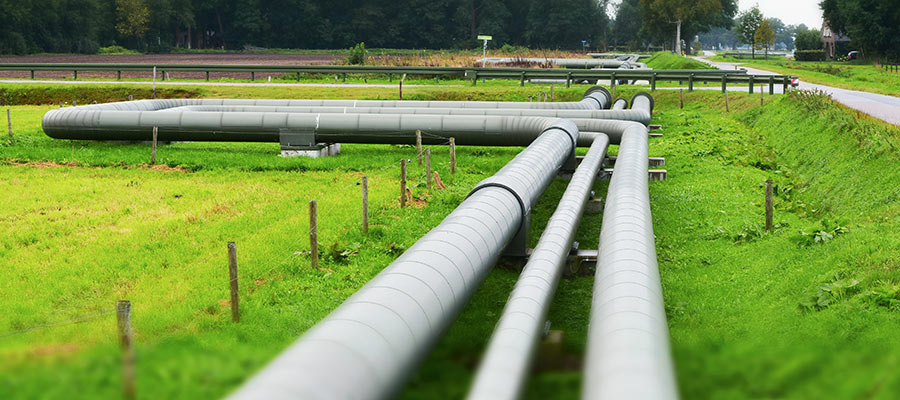
As massive new pipeline projects continue to generate news, the existing midstream infrastructure that’s hidden beneath our feet continues to be problematic on a daily basis. Since 2010, there have been 4,215 pipeline incidents resulting in 100 reported fatalities, 470 injuries, and property damage exceeding $3.4 billion.
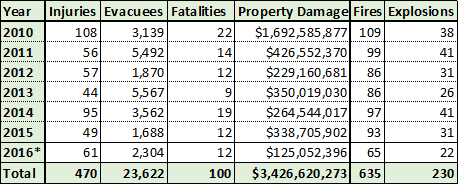
Figure 1: Cumulative impacts pipeline incidents in the US. Data collected from PHMSA on November 4th, 2016. Operators are required to submit incident reports within 30 days.
In our previous analyses, pipeline incidents occurred at a rate of 1.6 per day nationwide, according to data from the Pipeline and Hazardous Materials Safety Administration (PHMSA). Rates exceeding 1.9 incidents per day in 2014 and 2015 have brought the average rate up to 1.7 incidents per day. Incidents have been a bit less frequent in 2016, coming in at a rate of 1.43 incidents per day, or 1.59 if we roll results back to October 4th in order to capture all incidents that are reported within the mandatory 30 day window.
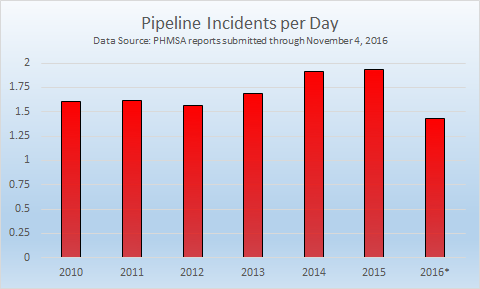
Figure 2: Pipeline incidents per day for years between 2010 and 2016. Incidents after October 4, 2016 may not be included in these figures.
These figures are the aggregation of three reports, namely natural gas transmission and gathering pipelines (828 incidents since 2010), natural gas distribution (736 incidents), and hazardous liquids (2,651 incidents). Not all of the hazardous liquids are petroleum related, but the vast majority are. 1,321 of the releases involved crude oil, and an additional 896 involved other liquid petroleum products, accounting for 84% of hazardous liquid incidents. The number could be higher, depending on the specific substances involved in the 399 highly volatile liquid (HVL) related incidents. The HVL category includes propane, butane, liquefied petroleum gases, ethylene, and propylene, as well as other volatile liquids that become gaseous at ambient conditions.
What is causing all of these pipeline incidents?
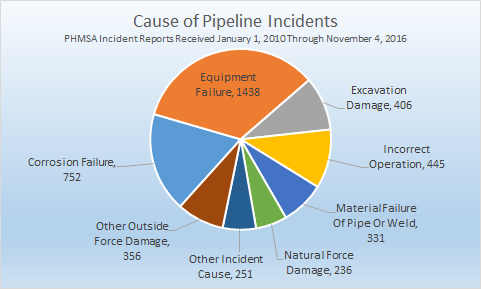
Figure 3: Cause of pipeline incidents for all reports received from January 1, 2010 through November 4, 2016.
Nonprofits, academics, and concerned citizens looking for accurate pipeline data will find that it is restricted, with the argument that releasing accurate pipeline data constitutes a threat to national security. This makes little sense for several reasons. First, with over 2.4 million miles of pipelines, they are nearly omnipresent. Additionally, similar data access restrictions only apply to midstream infrastructure such as pipelines and compressor stations, whereas the locations for wells, refineries, and power plants are all publicly available, despite the presence of the same volatile hydrocarbons at these facilities. Additionally, pipelines are purposefully marked with surface placards to help prevent unintentionally impacting the infrastructure.
In fact, a quick look at the causes of pipeline incidents reveal that it it much more dangerous to not know where the pipelines are located. In the “Other Incident Cause” category (Figure 3) there are 152 incidents that were caused by unsuspecting motor vehicles. When this is combined with incidents resulting from excavation damage, we have 558 cases where “not knowing” about the pipeline’s location likely contributed to the failure. On the other hand, there are 14 incidents (only .003%) where the cause is identified as intentional. While even one case of tampering with pipeline infrastructure is unacceptable, PHMSA incident data indicate that obfuscated pipelines are 40 times more likely to cause a problem when compared to sabotage. Equipment failures and corrosion account for more than half of all incidents.
Where do these incidents occur?
PHMSA is not allowed to make accurate pipeline location data available for download, but such rules apparently do not apply to pipeline incidents. The following map shows the 4,215 pipeline releases since 2010, highlighting those that have resulted in injuries and fatalities.
Pipeline incidents in the US. Please zoom in to access specific incident data. To see the legend and other tools, Please click here.
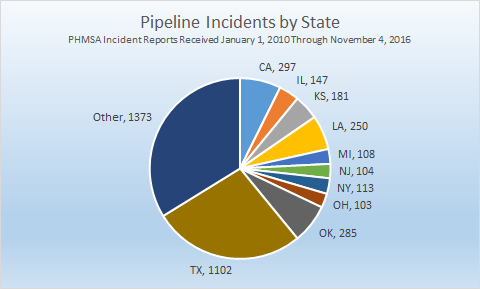
Figure 4: Pipeline incidents by state for reports received 1/1/2010 through 11/4/2016.
While operators are required to submit the incident’s location as a part of their report to PHMSA, data entry errors are common in the dataset. The FracTracker Alliance has been able to identify and correct a few of the higher profile errors, such as the February 9, 2011 explosion in Allentown, PA, the report for which had mangled the latitude and longitude values so badly that the incident was rendered in Greenland. Other errors persist in the dataset, however. Since 2010, pipeline incidents have occurred in Washington, DC, Puerto Rico, and 49 states (the exception being Vermont). Ten states have at least 100 incidents apiece during the past six years (see Figure 4), and more than a quarter of all pipeline incidents in that time frame have occurred in Texas.
Which operators are responsible?
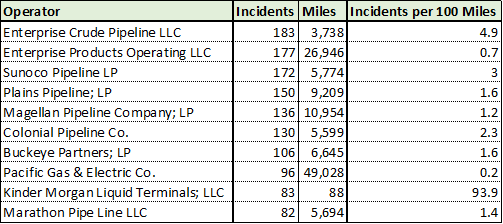
Figure 5: This table shows the ten operators with the most reported incidents, along with the length of their pipeline network.
Altogether, there are 521 pipeline operators with reported releases, although many of these are affiliated with one another in some fashion. For example, the top two results in Figure 5 are almost certainly both subsidiaries of Enterprise Products Partners, L.P.
The real outlier in Figure 5, in terms of incidents per 100 miles, is Kinder Morgan Liquid Terminals; LLC. However, this is one of ten or more companies that share the Kinder Morgan name when reporting pipeline inventories. When taken in aggregate, companies with the Kinder Morgan name accounted for 142 incidents over a reported 7,939 miles, for a rate of 1.8 incidents per 100 miles. It should be noted that this, along with all of the statistics in Figure 5, are entirely based on matching the operator name between the incident and inventory reports. Kinder Morgan’s webpage boasts of 84,000 miles of pipelines in the US — there are numerous possible explanations for the discrepancy in pipeline length, including additional Kinder Morgan subsidiaries, as well as whether gathering lines that aren’t considered to be mains are on both lists.
The operators responsible for the most deaths from pipeline incidents since 2010 include Pacific Gas & Electric (15), Washington Gas Light (9), and Consolidated Edison Co. of New York (8). Of course, the greatest variable in whether or not a pipeline explosion kills people or not is whether or not the incident happens in a populated location. In the course of this analysis, there were 230 explosions and 635 fires over 2,500 days, meaning that there is pipeline explosion somewhere in the United States every 11 days, on average, and a fire every fourth day. The fact that only 65 of the incidents resulted in fatalities indicates that we have been rather lucky with incidents in the midstream sector.
you really need to update this info. there have been more explosions, leaks and casualties lately. 2/2017
You can also see a short animation of pipeline incidents through October 8, 2016 at https://youtu.be/F1BgsYLcF2E
You’ve broken down the information into categories that make sense, and describe the entire issue in (mostly) plain English. Thank you. How can we get the Obama administration to read this?
You missed this accident, which killed 2 and injured 7 in Mississippi:
http://www.ntsb.gov/investigations/AccidentReports/Reports/PAR0901.pdf
Thank you for your comment. The reason that this incident is not included in this analysis is that it occurred in 2007, and the report that I used only went back to 2010. I hope that readers take a few moments to look at the report that you included, as it gives a much better sense of what happens on the ground than the data that I looked at does.
Matt