Global oil refineries map by FracTracker - Ted Auch

Tracking Global Oil Refineries and their Emissions

Potential Conflict Hotspots and Global Productivity Choke Points

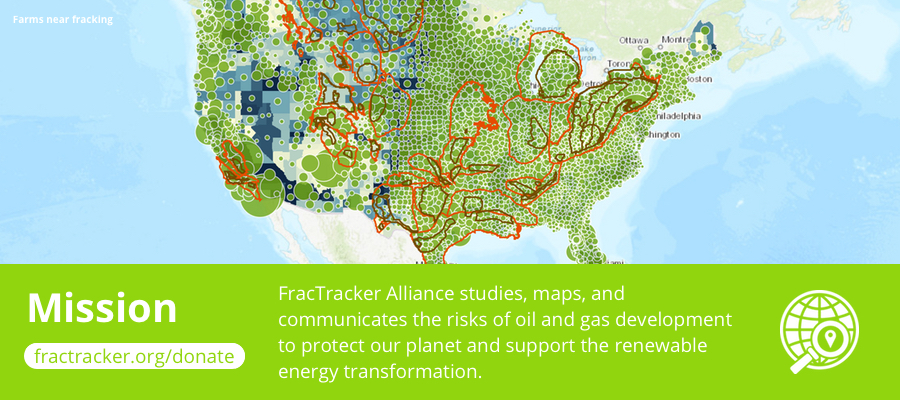
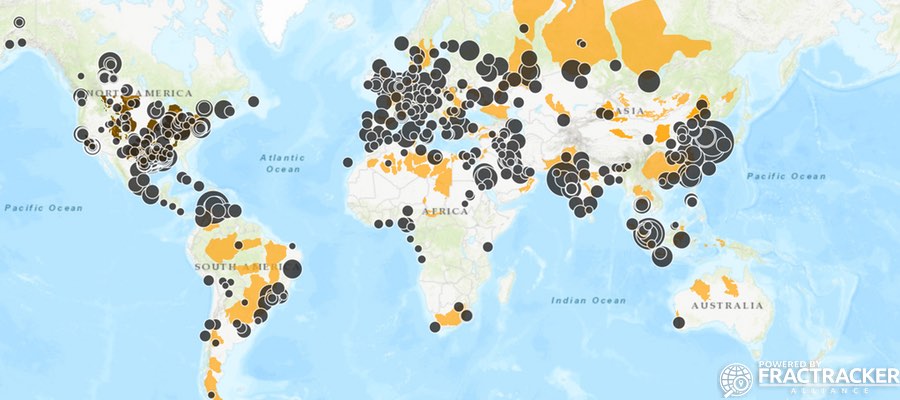
Today, FracTracker is releasing a complete inventory of all 536 global oil refineries, along with estimates of daily capacity, CO2 emissions per year, and various products. These data have also been visualized in the map below.

Total productivity from these refineries amounts to 79,372,612 barrels per day (BPD) of oil worldwide, according to the data we were able to compile. However, based on the International Energy Agency, global production is currently around 96 million BPD, which means that our capacity estimates are more indicative of conditions between 2002 and 2003 according to BP’s World Oil Production estimates. We estimate this disparity is a result of countries’ reluctance to share individual refinery values or rates of change due to national security concerns or related strategic reasons.

These refineries are emitting roughly 260-283 billion metric tons (BMT) of CO2[1], 1.2-1.3 BMT of methane and 46-51 million metric tons of nitrous oxide (N2O) into the atmosphere each year. The latter two compounds have climate change potentials equivalent to 28.2-30.7 BMT and 14.1-15.3 BMT CO2, respectively.

66 million

Assuming the planet’s 7.6 billion people emit 4.9-5.0 metric tons per capita of CO2 per year, emissions from these 536 refineries amounts to the CO2 emissions of 52-57 million people. If you include the facilities’ methane and N2O emissions, this figure rises to 61-66 million people equivalents every year, essentially the populations of the United Kingdom or France.

Map of global oil refineries


View map fullscreen | How FracTracker maps work | View static map | Download map data

BP’s data indicate that the amount of oil being refined globally is increasing by 923,000 BPD per year (See Figure 1). This increase is primarily due to improved productivity from existing refineries. For example, BP’s own Whiting, IN refinery noted a “$4-billion revamp… to boost its intake of Canadian crude oil from 85,000 bpd to 350,000 bpd.”

Figure 1. Global Oil Production 1965 to 2016 (barrels per day)

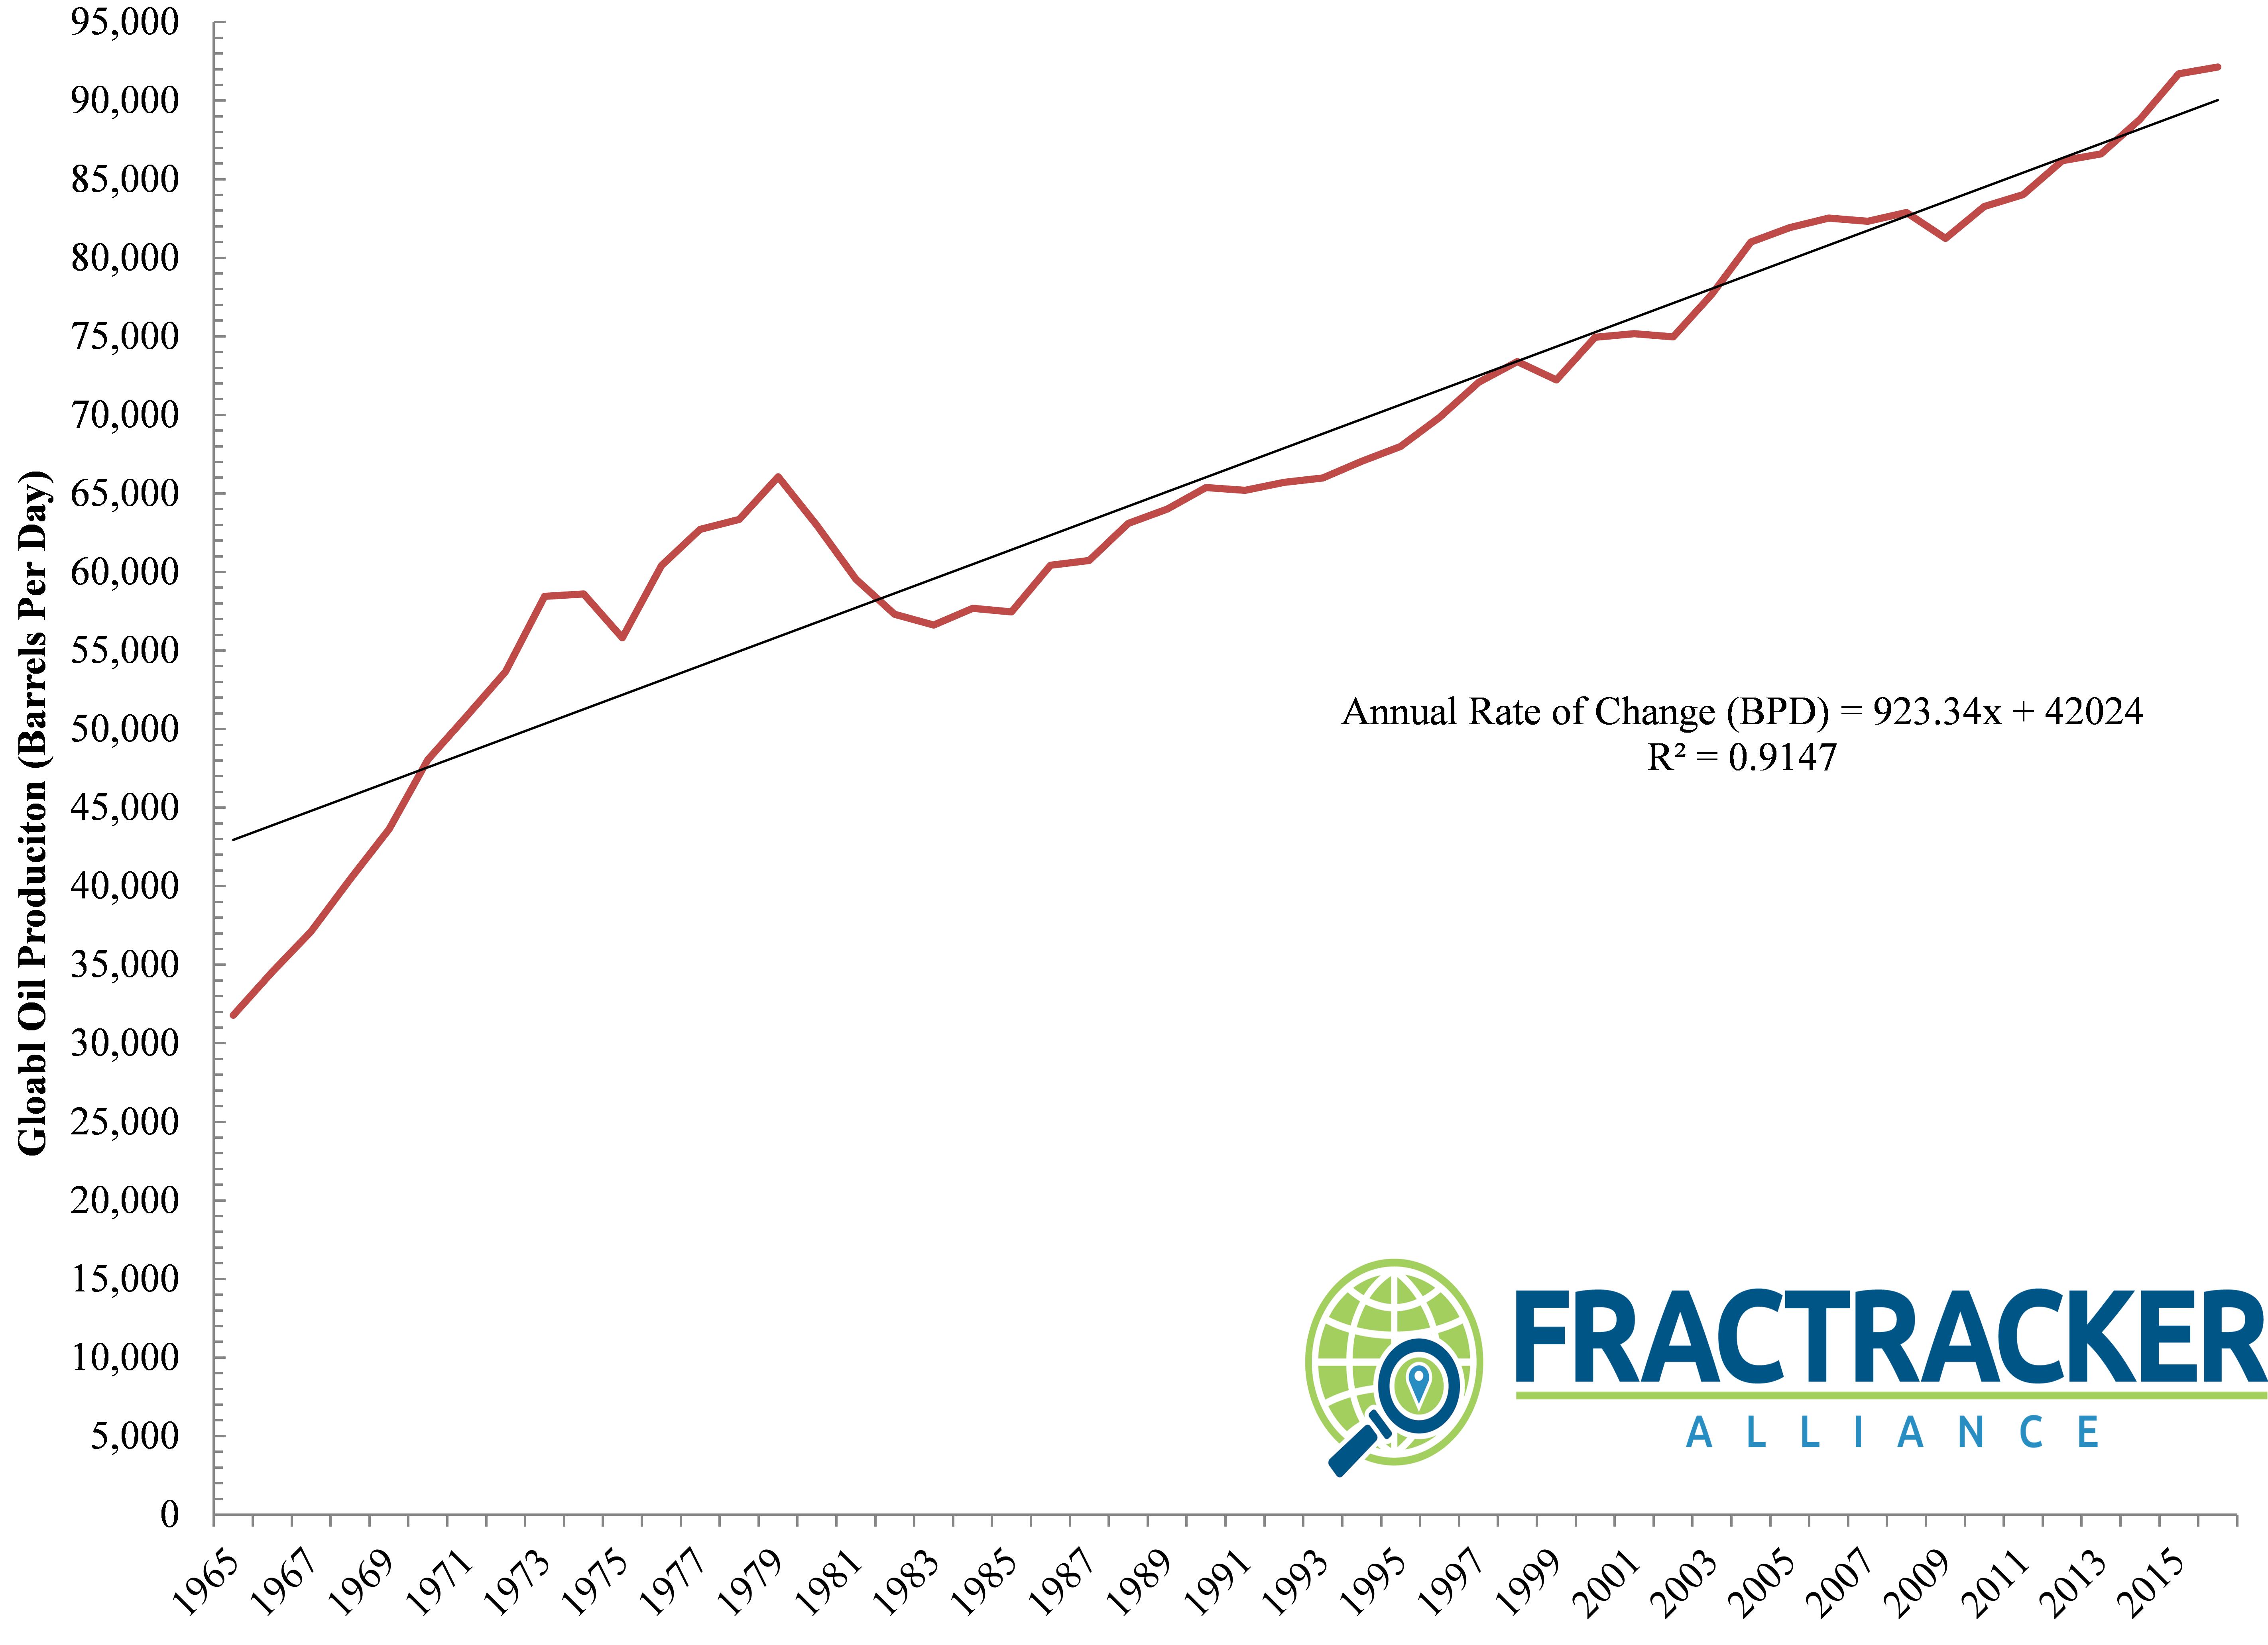
Figure 1. Global Oil Production, 1965 to 2016 (barrels per day) – Data courtesy of British Petroleum (BP) World Oil Production estimates.


Potential Hotspots and Chokepoints

Across the globe, countries and companies are beginning to make bold predictions about their ability to refine oil.

Nigeria, for example, recently claimed they would be increasing oil refining capacity by 13% from 2.4 to 2.7 million BPD. Currently, however, our data indicate Nigeria is only producing a fraction of this headline number (i.e., 445,000 BPD). The country’s estimates seem to be more indicative of conditions in Nigeria in the late 1960s when oil was first discovered in the Niger Delta. Learn more.

Is investing in – and doubling down on – oil refining capacity a smart idea for Nigeria’s people and economy, however? At this point, the country’s population is 3.5 times greater than it was in the 60’s and is growing at a remarkable rate of 2.7% per year. Yet, Nigeria’s status as one of the preeminent “Petro States” has done very little for the majority of its population – The oil industry and the Niger Delta have become synonymous with increased infant mortality and rampant oil spills.

Sadly, the probability that the situation will improve in a warming – and more politically volatile – world is not very likely. 

Such a dependency on oil price has been coupled to political instability in Nigeria, prompting some to question whether the discovery of oil was a cure or a curse given that the country depends on oil prices – and associated volatility – to balance its budget: Of all the Organization of Petroleum Exporting Countries (OPEC) countries, Nigeria is near the top of the list when it comes to the price of oil the country needs to balance its budget – Deutsche Bank and IMF estimate $123 per barrel as their breaking point. This is a valuation that oil has only exceeded or approached 4.4% of the time since 1987 (See Figure 2).

Former Central Bank of Nigeria Governor, Charles Soludo, once put this reliance in context:

… For too long, we have lived with borrowed robes, and I think for the next generation, for the 400 million Nigerians expected in this country by the year 2050, oil cannot be the way forward for the future.

Other regions are also at risk from the oil market’s power and volatility. In Libya, for example, the Ras Lanuf oil refinery (with a capacity of 220,000 BPD) and the country’s primary oil export terminal in Brega were the focal point of the Libyan civil war in 2011. Not coincidentally, Libya also happens to be the Petro State that needs the highest per-barrel price for oil to balance its budget (See Figure 2). Muammar Gaddafi and the opposition, National Transitional Council, jostled for control of this pivotal choke point in the Africa-to-Europe hydrocarbon supply chain.

The fact that refineries like these – and others in similarly volatile regions of the Middle East – produce an impressive 10% (7,166,900 BPD) of global demand speaks to the fragility of these Hydrocarbon Industrial Complex focal points, as well as the planet’s fragile dependence on fossil fuels going forward.

Weekly Spot Price of Brent Sweet Crude ($ Per Barrel) and estimates of the prices OPEC/Petro States need to balance their budgets.

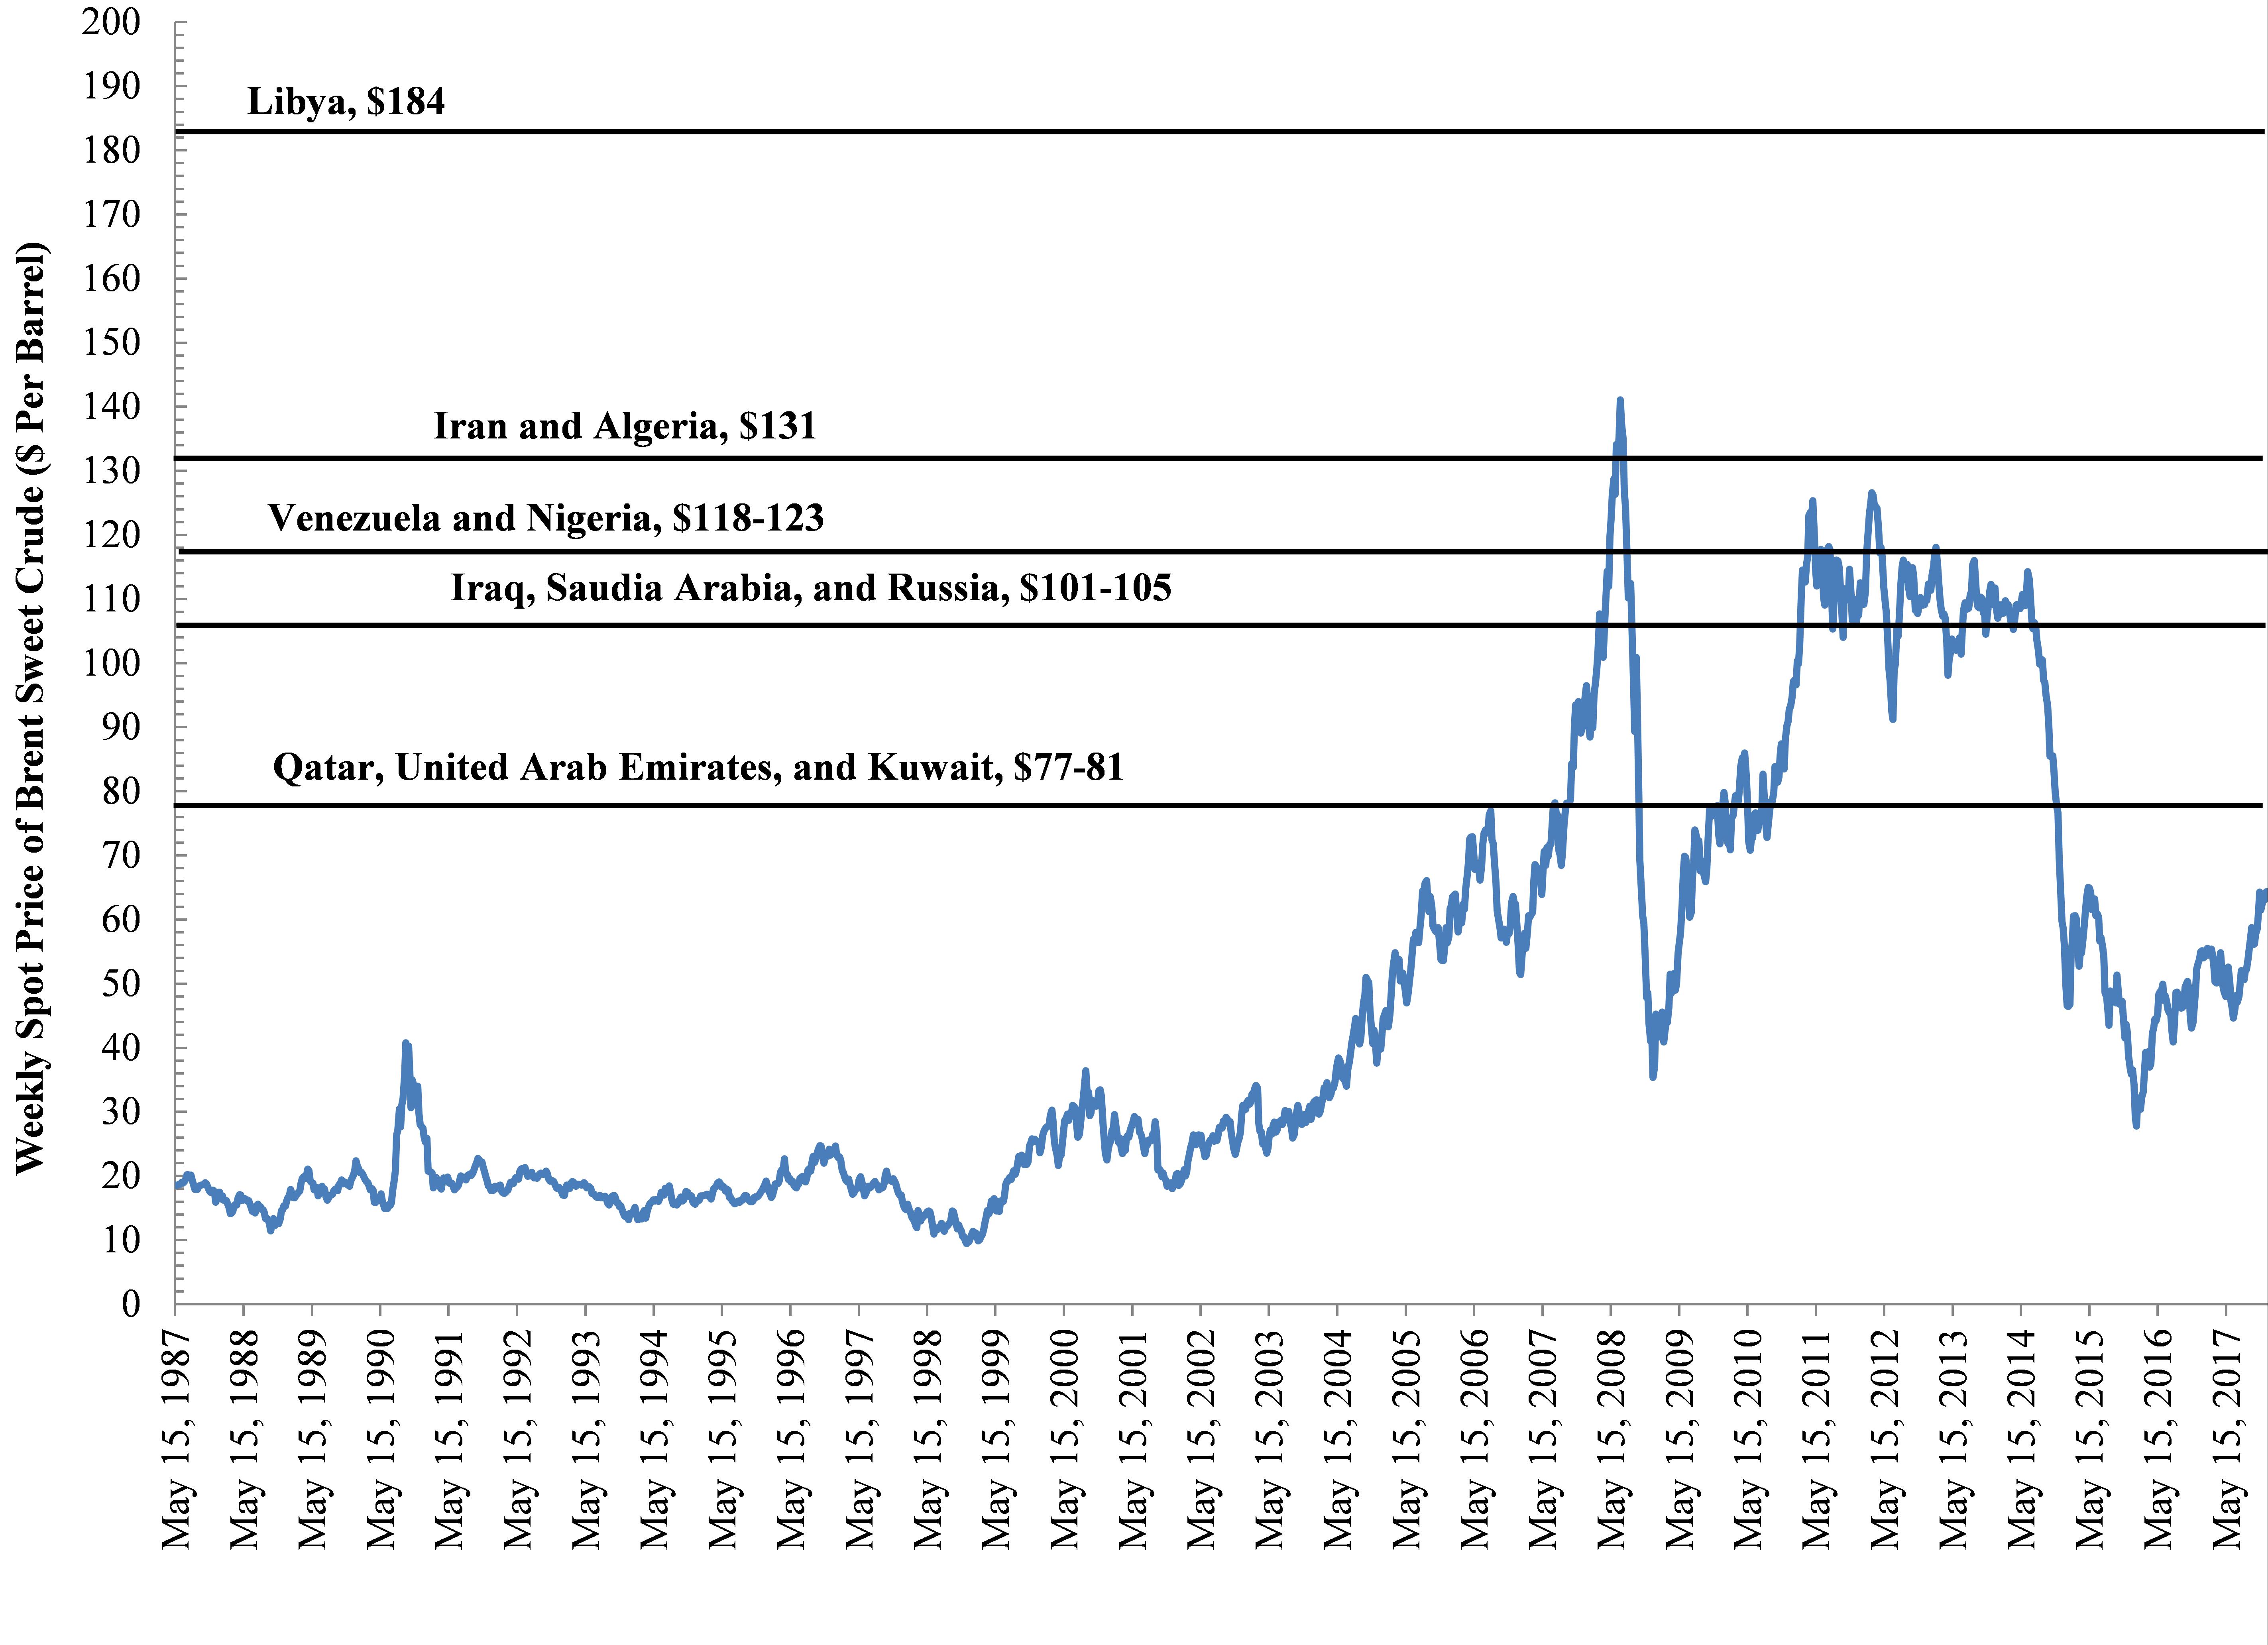
Figure 2. Weekly Spot Price of Brent Sweet Crude ($ Per Barrel) and estimates of the prices OPEC/Petro States need to balance their budgets.


Dividing Neighbors

These components of the fossil fuel industry, and their associated feedstocks and pipelines, will continue to divide neighbors and countries as political disenfranchisement and inequality grow, the climate continues to change, and resource limitations put increasing stress on food security and watershed resiliency worldwide.

Not surprisingly, every one of these factors places more strain on countries and weakens their ability to govern responsibly.

Thus, many observers speculate that these factors are converging to create a kind of perfect storm that forces OPEC governments and their corporate partners to lean even more heavily on their respective militaries and for-profit private military contractors (PMCs) to prevent social unrest while insuring supply chain stability and shareholder return.[2,3] The increased reliance on PMCs to provide domestic security for energy infrastructure is growing and evolving to the point where in some countries it may be hard to determine where a state’s sovereignty ends and a PMC’s dominance begins – Erik Prince’s activities in the Middle East and Africa on China’s behalf and his recent aspirations for Afghanistan are a case in point.

To paraphrase Mark Twain, whiskey is for drinking and hydrocarbons are for fighting over. 

The international and regional unaccountability of PMCs has added a layer of complexity to this conversation about energy security and independence. Countries such as Saudi Arabia and Venezuela provide examples of how fragile political stability is, and more importantly how dependent this stability is on oil refinery production and what OPEC is calling ‘New Optimism.’ To be sure, PMCs are playing an increasing role in political (in)stability and energy production and transport. Since knowledge and transparency are essential for peaceful resolutions, we will continue to map and chronicle the intersections of geopolitics, energy production and transport, social justice, and climate change.


By Ted Auch, Great Lakes Program Coordinator, FracTracker Alliance; and Bryan Stinchfield, Associate Professor of Organization Studies, Department Chair of Business, Organizations & Society, Franklin & Marshall College


Relevant Data

Footnotes and References

  1. Assuming a tons of CO2 to barrels of oil per day ratio of 8.99 to 9.78 tons of CO2 per barrel of oil based on an analysis we’ve conducted of 146 refineries in the United States.
  2. B. Stinchfield.  2017.  “The Creeping Privatization of America’s Armed Forces”.  Newsweek, May 28th, 2017, New York, NY.
  3. R. Gray.  “Erik Prince’s Plan to Privatize the War in Afghanistan”.  The Atlantic, August 18th, 2017, New York, NY.
Drilling on PA state lands

Energy development is happening on your state lands, Pennsylvania

Decisions to drill or mine on public lands, however, are often extremely complicated.

By Allison M. Rohrs, Saint Francis University, Institute for Energy

The Commonwealth of Pennsylvania has historically been, and continues to be, home to an abundant array of energy resources like oil, gas, coal, timber, and windy ridgetops. Expectedly, these natural resources are found both on publicly and privately held land.

In Pennsylvania, the bulk of public lands are managed by two separate state agencies: The Department of Conservation and Natural Resources (DCNR), which manages the state’s forest and park system, and the Pennsylvania Game Commission (PGC), which manages the state’s game lands. Both of these state agencies manage oil, gas, and coal extraction as well as timbering on state property. Interestingly, neither of the agencies have utility-scale renewable energy generation on their land.

Some of Pennsylvania’s best wind resources can be found on the mountain ridges in the Commonwealth’s state forests and game lands, however, all proposals to build utility-scale wind farms have been denied by state agencies.

(Note: there are other state and federal agencies managing lands in PA, however, we focused our research on these two agencies specifically.)

Surprised to see that state lands have been greatly developed for different fossil industries but denied for wind energy, The Institute for Energy set out on a yearlong endeavor to collect as much information as we could about energy development on PA public lands. Using formal PA Right to Know requests, we worked with both DCNR and PGC to examine development procedures and management practices. We reviewed hundreds of available state agency reports, scientific documents, and Pennsylvania energy laws and regulations. We also worked with FracTracker Alliance to develop interactive maps that depict where energy development has occurred on state lands.

After a comprehensive review, we realized, like so much in life, the details are much more complicated than a simple yes or no decision to develop an energy project on state lands. Below is a brief summary of our findings, organized by energy extraction method:

Land/Mineral Ownership in Pennsylvania

One of the most significant issues to understand when discussing energy resources on state lands is the complexity of land ownership in Pennsylvania. In many instances, the development of an energy resource on publicly owned land is not a decision, but instead an obligation. In Pennsylvania, property rights are often severed between surface and subsurface ownership. In many cases, surface owners do not own the mineral rights beneath them, and, by PA law, are obligated to allow reasonable extraction of such resource, whether it be coal, oil, or gas. In Pennsylvania, approximately 85% of state park mineral rights are owned by someone other than the Commonwealth (severed rights).

Fee Simple - Mineral rights on state lands

Legal Authority to Lease

It is critical to note that DCNR and PGC are two entirely separate agencies with different missions, legal structures, and funding sources. This plays a significant role in decisions to allow oil, gas, and coal development on their properties. Both agencies have explicit legal authority under their individual statutes that allow them to lease the lands for mineral extraction. This becomes more of an issue when we discuss wind development, where legal authority is less clear, particularly for DCNR.

Oil and Gas Extraction

Oil and gas wells have been spudded on state parks, state forests, and state game lands. The decision to do so is multifaceted and ultimately decided by three major factors:

  1. Mineral ownership of the land,
  2. Legal authority to lease the land, and
  3. Potential impacts to the individual agency.

There is currently a moratorium on new surface leases of DCNR Lands. Moratoriums of such nature have been enacted and removed by different governors since 2010. Although there are no new lease agreements, extraction and production is still occurring on DCNR land from previously executed lease agreements and where the state does not own the mineral rights.

The Game Commission is still actively signing surface and non-surface use agreements for oil and gas extraction when they determine the action is beneficial to achieving their overall mission.

Revenues from the oil and gas industry play a significant role in the decision to drill or not. Both agencies have experienced increasing costs and decreasing revenues, overall, and have used oil and gas development as a way to bridge the gap.

Funds raised from DCNR’s oil and gas activities go back to the agency’s conservation efforts, although from 2009 to 2017, the State Legislature had directed much of this income to the state’s general fund to offset major budget deficits. Just this year, the PA Supreme Court ruled against this process and has restored the funds back to DCNR for conservations purposes.

All revenues generated from oil and gas development on state game lands stays within the Game Commission’s authority.

Along with positive economic benefits, there remains potential health and environmental risks unique to development on these public lands. Some studies indicate that users of these public lands could have potential exposure to pollution both in the air and in the water from active oil and gas infrastructure. The ease of public access to abandoned and active oil and gas infrastructure is a potential risk, as well. On the environmental side, many have argued that habitat fragmentation from oil and gas development is contradictory to the missions of the agencies. Both agencies have independent water monitoring groups specific to oil and gas activities as well as state regulated DEP monitoring. The potential negative effects on ground and surface water quality is an issue, however, mainly due the vast size of public lands and limited dwellings on these properties.

Use the map below to explore the PA state parks, forests, and game lands that have active oil and gas infrastructure.

Oil and Gas Wells on State Lands in PA


View map fullscreen | How FracTracker maps work

Coal Mining

Thousands of acres of state forests and game lands have been mined for coal. Like oil and gas, this mineral is subject to similar fee simple ownership issues and is governed by the same laws that allow oil and gas extraction. DCNR, has not signed any virgin coal mining leases since the 1990s, but instead focuses on reclamation projects. There are coal mining operations, however, on forest land where DCNR does not own the mineral rights. The Game Commission still enters into surface and non-surface use agreements for mining.

In many circumstances, mining activity and abandoned mines were inherited by the state agencies and left to them to reclaim. Environmental and health impacts of mining specific to state land are generally attributed more to legacy mining and not to new mining operations.

Acid mine drainage and land subsidence has destroyed rivers and riparian habitats on these lands purposed for conservation.

The ease of public access and limited surveillance of public lands also makes abandoned mines and pits a dangerous health risk. Although threats to humans and water quality exist, abandoned mines have been noted for actually creating new bat habitat for endangered and threatened bat species.

Originally, we sought to quantify the total acreage of public lands affected by coal mining and abandoned mines; however, the dataset required to do so is not yet complete.

The Pennsylvania Department of Environmental Protection is currently in the process of digitizing over 84,000 hand drawn maps of mined coal seams in PA, an expected 15-year project.

Today, they have digitized approximately 30,000. The static map below demonstrates the areas with confirmed coal mining co-located on state lands:
Public lands and coal mining map - PA

Renewables

The discussion about renewable energy development in PA is almost as complex as the fossil industries. There are no utility-scale renewables on state owned land. Both DCNR and the Game Commission have been approached by developers to lease state land for wind development, however all proposals have been denied.

Even when DCNR owns the surface rights, they still cite the lack of legal authority to lease the land for wind, as their statute does not explicitly state “wind turbines” as a lawful lease option.

The Game Commission does have the legal authority to lease its land for wind development, but has denied 19 out of 19 requests by developers to do so, citing many environmental and surface disturbances as the primary reason.

Infographic regarding state land potential for wind energy

The development of wind projects in PA has slowed in the past five years, with only one new commercial wind farm being built. This is due to a variety of reasons, including the fact that many of windiest locations on private lands have been developed.

We estimate that 35% of the state’s best wind resource is undevelopable simply because it is on public land.

Like all energy development, wind energy has potential environmental and health impacts, too. Wind could cause habitat fragmentation issues on land purposed for conservation. The wind energy industry also has realized negative effects on bird and bat species, most notably, the endangered Indiana bat. Health impacts unique to public lands and wind development include an increased risk of injury to hunters and recreators related to potential mechanical failure or ice throw off the blades. Unlike fossil energies, however, wind energy has potential to offset air emissions.

We estimate that wind development on PA public lands could offset and estimated 14,480,000 tons of CO2 annually if fully developed.

Commercial wind turbines are currently being installed at hub heights of 80-100 meters where the annual average wind resource is 6.5 m/s or greater. The following map demonstrates areas of Pennsylvania where the wind speeds are 6.5 m/s or greater at 100 meters, including areas overlapping state lands, where no utility scale development has occurred.

PA Wind Potential on State Lands


View map fullscreen | How FracTracker maps work

Additional Renewables

Biomass is organic material, such as wood, that is considered renewable because of its ability to be replenished. The harvesting of such wood (timber) occurs on both DCNR and PGC lands and provides funding for these agencies.

Small-scale wind, solar, hydro, geothermal, and biomass projects do exist on PA public lands for onsite consumption, however no renewables exist on a commercial or utility scale.

Both the fossil and renewable energy industries are forecasted to grow in Pennsylvania in the years to come. The complex decisions and obligations to develop energy resources on PA public lands should include thoughtful management and fair use of these public lands for all energy resources.


For more information and details, check out the entire comprehensive report on our website: www.francis.edu/energy.

This work was supported by The Heinz Endowments.

FracTracker banner and mission - Please consider a donation this holiday season

Please consider supporting FracTracker Alliance this holiday season

Often times it can be difficult to clearly communicate the impact that FracTracker has had on communities concerned about the impacts of the oil and gas industry, or the benefits the data we provide offer to researchers and journalists investigating the links between this activity and a variety of issues. As such, I will let these recent testimonials say it better – and more concisely – than I can:

I came across the FracTracker Alliance website and related maps about a month ago and have found them really useful in developing a new research project… In particular, the work on silica mining is really fascinating.
G. Pickren, Chicago, IL

Thanks for all that FracTracker does… the Mariner East 2 spill map is so very helpful for small struggling grass roots groups like Lebanon Pipeline Awareness!
– A. Pinca, Annville, PA

Your work at the FracTracker Alliance is first-rate. Your presence on the panel brought your unique insights and experience to the audience in a truly meaningful way… You empowered and inspired those in attendance.
– D. Shields, Pittsburgh, PA

Whether it was the spring launch of our powerful mobile app, the summer release of a national map of farming vs. fracking, or our fall event to bestow three heroes with the Community Sentinel Award for Environmental Stewardship, every day and every season FracTracker is there providing insights that empower action.

To perpetuate our invaluable services, will you consider a year-end gift? Please donate today and help us nurture a clean, hope-filled future for all.

Thank you for entrusting us with your gift. Best wishes for a peaceful, joyous holiday season!

Appreciatively,
Brook Lenker
Executive Director

Support FracTracker