
Fracking’s Freshwater Supply and Demand in Eastern Ohio
Mapping Hydraulic Fracturing Freshwater Supply and Demand in Ohio
Below is a map of annual and cumulative water withdrawal volumes by the hydraulic fracturing industry across Ohio between 2010 and 2016. It displays 312 unique sites, as well as water usage per lateral. The digital map, which can be expanded fullscreen for more features, includes data up until May 2017 for 1,480 Ohio laterals (vertical wells can host more than one lateral well).
View map fullscreen | How FracTracker maps work
The primary take-home message from this analysis and the resulting map is that we can only account for approximately 73% of the industry’s more than 13-billion-gallon freshwater demand by considering withdrawals alone. Another source or sources must be supplying water for these hydraulic fracturing operations.

Hydraulic fracturing rig on the banks of the Ohio River in Marshall County, West Virginia, Winter 2018 (Flight provided by SouthWings)
When Leatra Harper at Freshwater Accountability Project and Thriving Earth Exchange and I brought up this issue with Ohio Division of Water Resources Water Inventory and Planning Program Manager, Michael Hallfrisch, the following correspondence took place on January 24, 2018:
Mr. Hallfrisch: “Where did the water usage per lateral data come from? Does the water usage include reused/recycled water? I know that many of the larger operators reuse a significant amount of their flow back because of the high cost of disposal in class II injection wells.”
FracTracker: “[We’]ve been looking at Class II disposal economics in several states and frankly the costs here in Ohio are quite cheap and many of the same players in Ohio operate in the other states [We]’ve looked at. Granted they usually own their own Class II wells in those other states (i.e., OK, or CO) but the fact that they are “vertically integrated” still doesn’t excuse the fact that the cost of disposing of waste in Ohio is dirt cheap. As for recycling that % was always a rounding error and last [we] checked the data it was going down by about 0.25-0.35% per year from an average of about 5.5-8.0%. [We respectfully] doubt the recycling % would fill this 25% gap in where water is coming from. This gap lends credence to what Lea and [FracTracker] hear time and again in counties like Belmont, Monroe, Noble etc with people telling us about frequent trenches being dug in 1st and 2nd order streams with operators topping off their demands in undocumented ways/means. Apologies for coming down hard on this thing but we’ve been looking/mapping this thing since 2012 and increasingly frustrated with the gap in our basic understanding of flows/stocks of freshwater and waste cycling within Ohio and coming into the state from PA and WV.”
Broader Implications
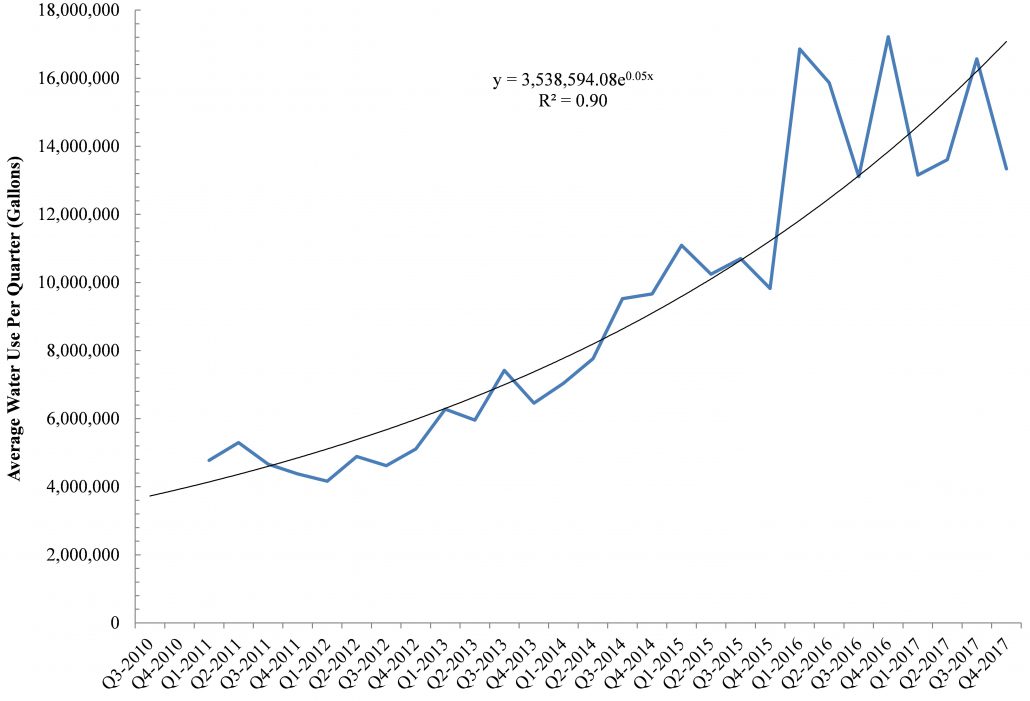
The fracking industry in Ohio uses roughly 10-14 million gallons per well, up from 4-5 million gallon demands in 2010, which means that freshwater demand for this industry is increasing 15% per year (Figures 1 and 2). (This rate is more than double the volumes cited in a recent publication by the American Chemical Society, by the way.) If such exponential growth in hydraulic fracturing’s freshwater demand in Appalachia continues, by 2022 each well in Ohio and West Virginia will likely require[1*] at least 43 million gallons of freshwater (Table 1).
Table 1. Projected annual average freshwater demand per well (gallons) for the hydraulic fracturing industry in Ohio and West Virginia based on a 15% increase per year.
| Year | Water Use Per Well (gallons) | |
| Ohio | West Virginia | |
| 2019 | 19,370,077 | 19,717,522 |
| 2020 | 23,658,666 | 23,938,971 |
| 2021 | 28,896,760 | 29,064,215 |
| 2022 | 35,294,582 | 35,286,756 |
| 2023 | 43,108,900 | 42,841,519 |
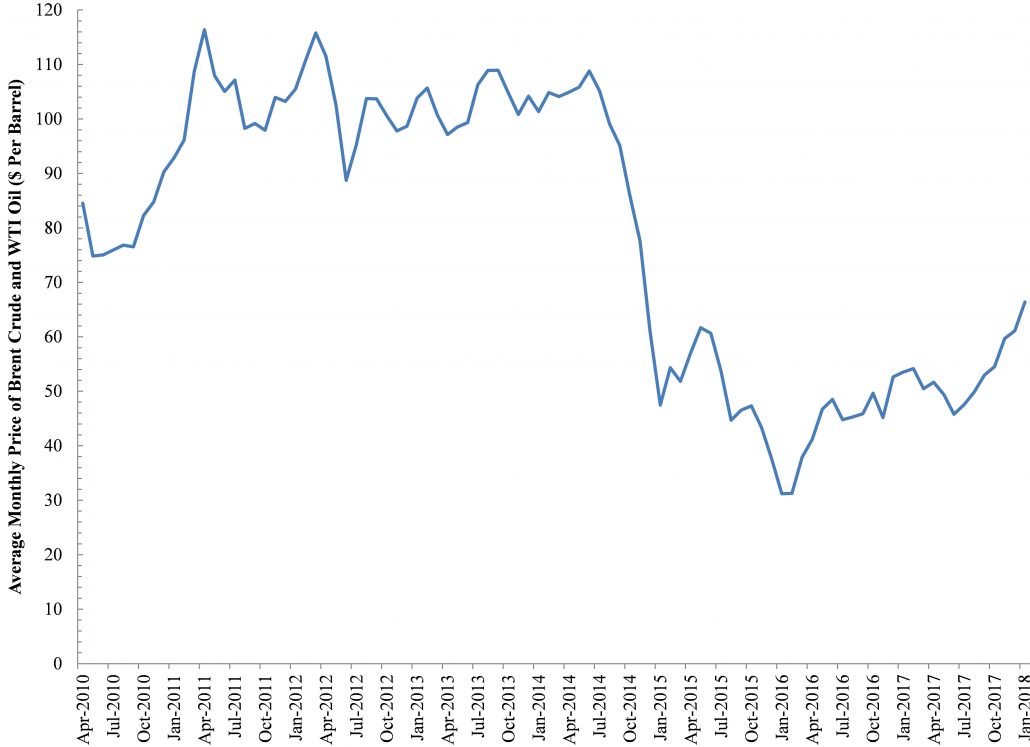
Water quantity and associated watershed security issues are both acute and chronic concerns at the local level, where fracking’s freshwater demands equal 14% of residential demands across Ohio. These quantities actually exceed 85% of residential demand in several Ohio counties (e.g., Carroll and Harrison), as well as West Virginia (e.g., Doddridge, Marshall, and Wetzel). Interestingly the dramatic uptick in Ohio freshwater demand that began at the end of 2013 coincides with a 50% decline in the price of oil and gas (Figure 3). The implication here is that as the price of gas and oil drops and/or unproductive wells are drilled at an unacceptable rate, the industry uses more freshwater and sand to ensure acceptable financial returns on investments.
Figures 1-3
Note: Data from U.S. Energy Information Administration (EIA) Petroleum & Other Liquids Overview
Total Water Used
To date, the fracking industry has taken on average 90 million gallons of freshwater per county out of Ohio’s underlying watersheds, resulting in the production of 9.6 million gallons of brine waste that cannot be reintroduced into waterways. This massive waste stream is destined for one of Ohio’s Class II Injection wells, but the industry spends less than 1.25% of available capital on water demand(s) and waste disposal. All of this means that the current incentive (cost) to become more efficient is too low. Sellers of water to the industry like the Muskingum Watershed Conservancy District, which we’ve chronicled frequently in the past[2], have actually dropped their price for every 1,000 gallons of water – from roughly $9 to now just $4-6 – for the fracking industry in recent years.

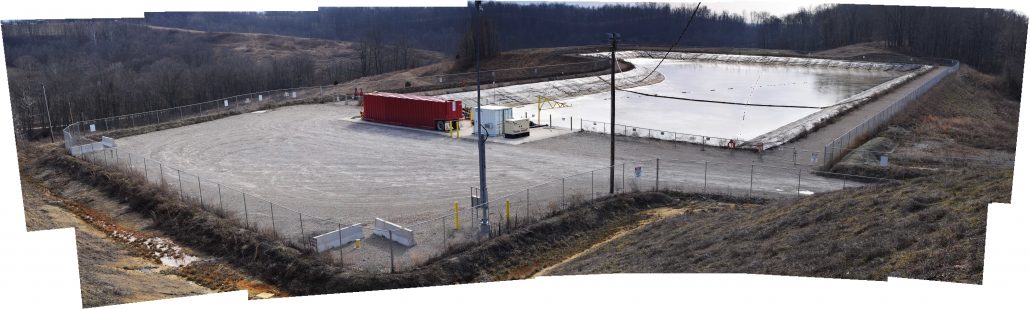
Gulfport Energy’s Barnesville Reservoir freshwater withdrawal pumping station, Belmont County, Ohio, Summer, 2017

Gulfport Energy’s Seneca Lake Reservoir freshwater withdrawal pump in Belmont County, Ohio, Fall, 2015

Gulfport Energy’s Barnesville Reservoir freshwater withdrawal pumping station, Belmont County, Ohio, Spring, 2017

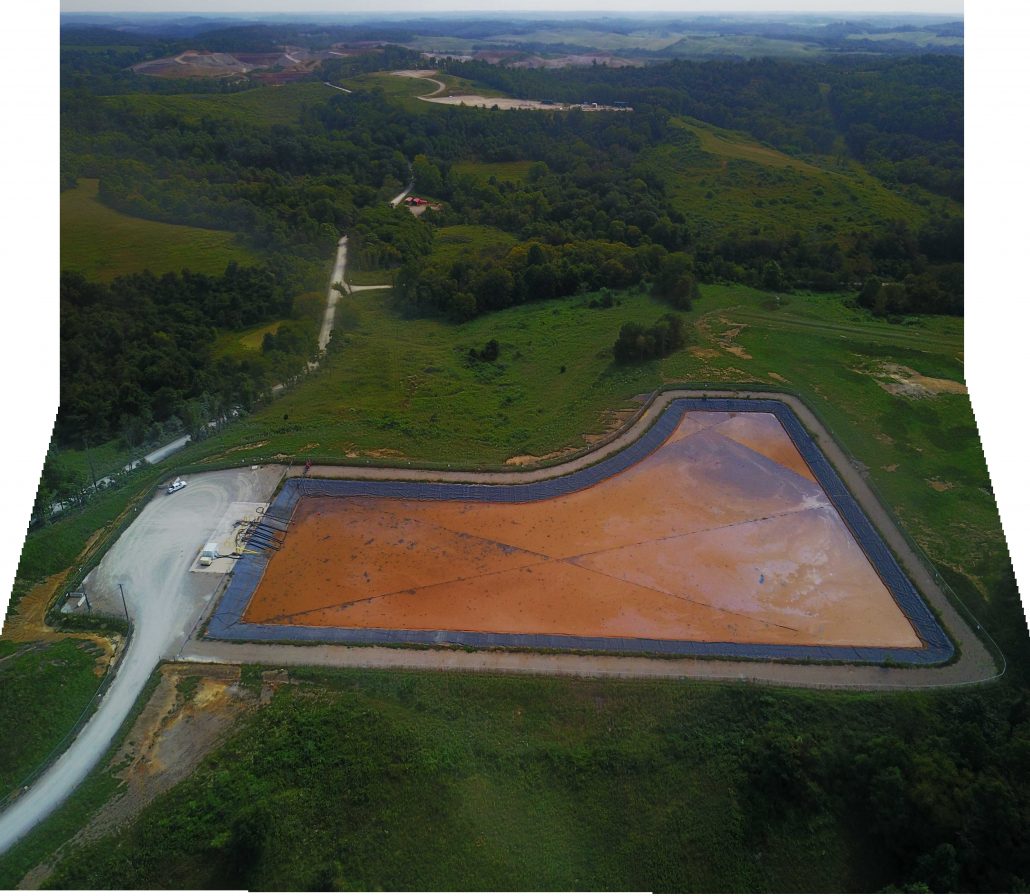
Freshwater Impoundment adjacent to a Hydraulically Fractured Well Pad in Belmont County, Ohio, Fall, 2017
Hydraulic fracturing’s demand is becoming an increasingly larger component of total water withdrawals in Ohio, as other industries, agriculture, and mining become more efficient. Oil and gas wells drilled at the perimeter of the Utica Shale are utilizing 1.25 to 2.5 times more water than those that are staged in the shale “Sweet Spots.” Furthermore, the rise in permitting of so called “Super Laterals” would render all of our water utilization projections null and void. Laterals are the horizontal wells that extend out underground from the vertical well. Most well pads are home to multiple laterals in the range of 4-7 laterals per pad across Ohio and West Virginia.
These laterals, which can reach up to 21,000 feet or almost 4 miles, demand as much as 87 million gallons of freshwater each.
Even accounting for the fact that the super laterals are 17-21,000 feet in length – vs. an average of 7,452 feet – such water demand would dwarf current demands and their associated pressures on watershed security and/or resilience; typically, Ohio’s hydraulically fractured laterals require 970-1,080 gallons of freshwater per lateral foot (GPLF), but super laterals would need an astounding 4,470 GLPF.
Conclusions and Next Steps
The map above illustrates the acute pressures being put upon watersheds and public water supplies in the name of “energy independence.” Yet, Ohio regulators and county officials aren’t putting any pressure on the high volume hydraulic fracturing (HVHF) industry to use less water and produce less waste. We can’t determine exactly how water demand will change in the future. The problem is not going away, however, especially as climate change results in more volatile year-to-year fluctuations in temperature and precipitation. This means that freshwater that was/is viewed as a surplus “commodity” will become more valuable and hopefully priced accordingly.
Furthermore, the Appalachian Ohio landscape is undergoing dramatic transformations at the hands of the coal and more recently the HVHF industry with strip-mines, cracking plants, cryogenic facilities, compressor stations, gas gathering lines – and more – becoming ubiquitous.

Freshwater Impoundment and Hydraulically Fractured Well Pad in Wetzel County, West Virginia, Winter, 2018

Freshwater Impoundment and Hydraulically Fractured Well Pad in Wetzel County, West Virginia, Winter, 2018

Forest clearing in prepration for hydraulic fracturing well pad establishment, Belmont County, Ohio, Spring, 2017

Freshwater Impoundment, hydraulically fractured well pad, and access road in Noble County, Ohio, Spring, 2016
We are seeing significant acreage of deciduous forests, cropland, or pasture that once covered the region replaced with the types of impervious surfaces and/or “clean fill” soil that has come to dominate HVHF landscapes in other states like North Dakota, Texas, and Oklahoma.
This landscape change in concert with climate change will mean that the region will not be able to receive, processes, and store water as effectively as it has in the past.
It is too late to accurately and/or more holistically price the HVHF’s current and past water demand in Ohio, however, such holistic pricing would do wonders for how the industry uses freshwater in the future. After all, for an industry that believes so devotedly in the laws of supply and demand, one would think they could get on board with applying such laws to their #1 resource demand in Appalachia. The water the HVHF industry uses is permanently removed from the hydrological cycle. Now is the time to act to prevent long term impacts on Ohio’s freshwater quantity and quality.
Relevant Data
- Ohio hydraulic fracturing lateral freshwater demand by individual well between 2010 and the end of 2016. Download
- Ohio hydraulic fracturing lateral freshwater withdrawals by site between 2010 and the end of 2016. Download
Endnotes
- *Certainty, with respect to this change in freshwater demand, is in the range of 86-90% assuming the exponential functions we fit to the Ohio and West Virginia data persist for the foreseeable future. Downing, Bob, 2014, “Ohio Drillers’ Growing Use of Fresh Water Concerns Environmental Activists”, March 19th, Akron, Ohio
- Downing, Bob, 2014, “Group Reacts to Muskingum Watershed Leasing Deal with Antero”, April 22nd, Akron, Ohio
By Ted Auch, Great Lakes Program Coordinator, FracTracker Alliance