Ohio Shale Activity, Waste Disposal, and Public Water Supplies
Ohio is unique relative to its Appalachian neighbors in the Marcellus and Utica Shale Basins in that The Buckeye State chose to “diversify” when it came to planning for the hydraulic fracturing revolution. One of the first things financial advisers tell their clients is to “diversify, diversify, diversify.” However, this strategy is usually meant to buffer investors when certain sectors of the economy underperform. Columbus legislators took this strategy to mean that we should drill and hydraulically fracture our geology to extract oil and gas (O&G), as well as taking in vast quantities of liquid and solid O&G waste from Pennsylvania and West Virginia.
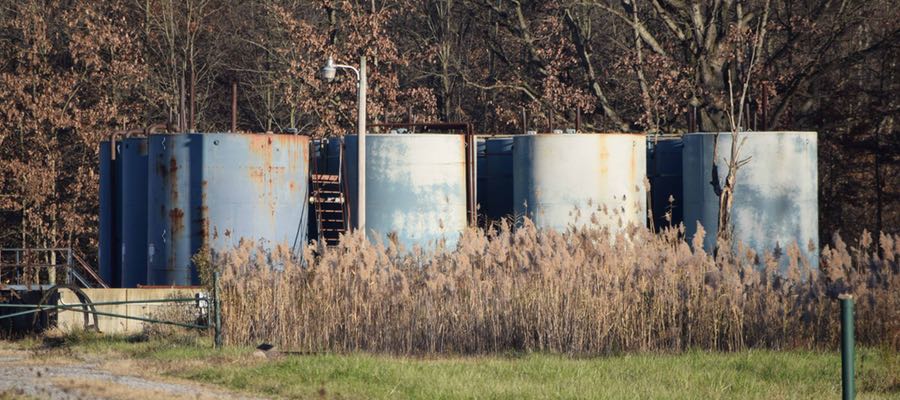
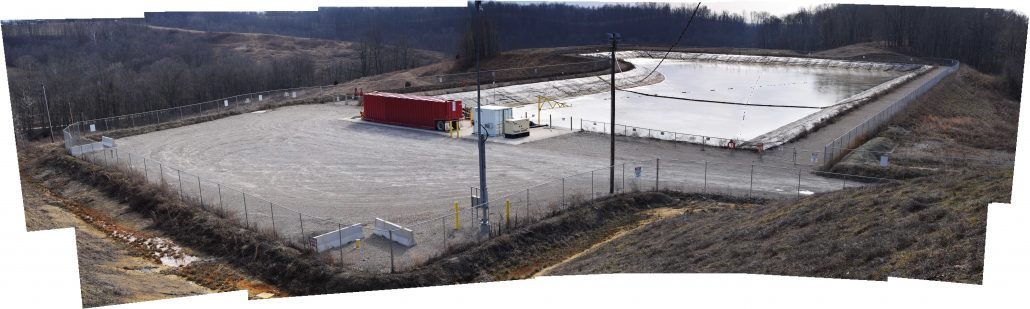
Accepting significant quantities of out-of-state waste raises several critical questions, however. How will these materials will be contained? Will such volumes require more and larger waste landfills? And will the injection of liquid brine waste into our geology (photo below) make Ohio the “Oklahoma of Appalachia” with respect to induced seismicity?


Above: Example Class II salt water disposal (SWD) wells in Ohio
Risks to Public Water Supplies
There are also mounting concerns about public water supply (PWS) security, quality, and resilience. These concerns stem from the growing uncertainty surrounding the containment of hydraulically fractured and Class II injection wells.
To begin to assess the risks involved in locating these wells near PWS’s, we compiled and incorporated as many of the state’s PWS’s into our primary Ohio maps. In this post, we explore PWS proximity to Utica drilling activity and Class II salt water disposal (SWD) wells in Ohio.
Waste Disposal & Drilling Near PWS’s
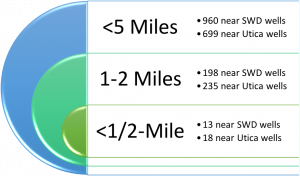 Just how close are public water supplies to Class II waste disposal wells and permitted Utica wells? As of January 15, 2017, there are 13 PWS’s within a half-mile of Ohio’s Class II SWD wells, and 18 within a half-mile of permitted Utica wells. These facilities serve approximately 2,000 Ohioans each, with an average of 112-153 people per PWS (Tables 1 and 5). Within one mile from these wells there are 64 to 66 PWSs serving 18 to 61 thousand Ohioans. That’s an average of 285-925 residents.


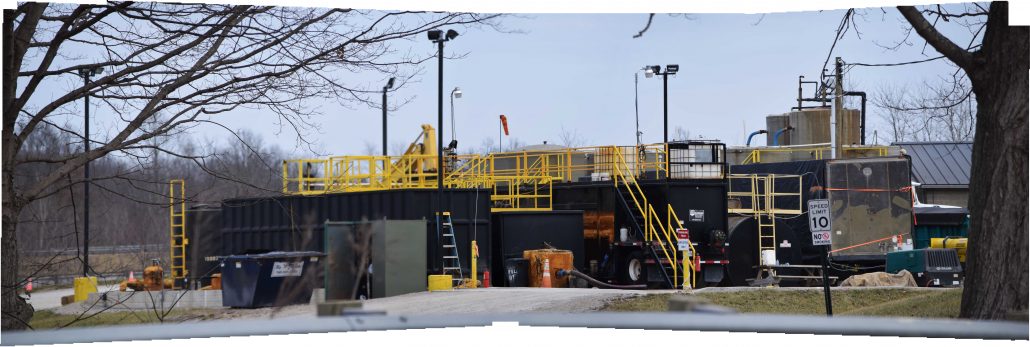
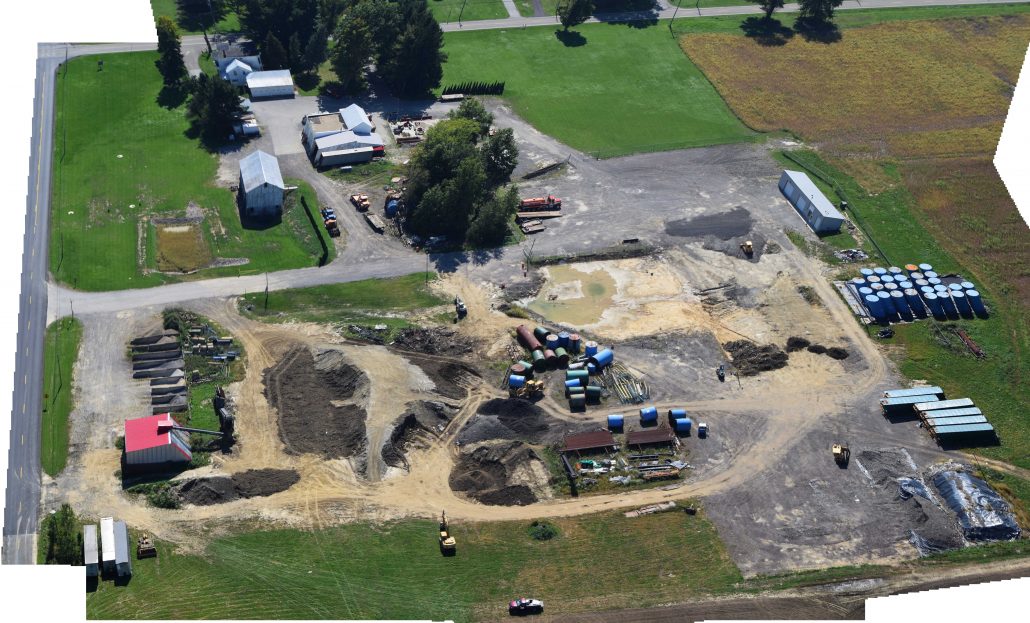
Above: Photos of SWD wells from the sky
While PWSs on the 5-mile perimeter of our analysis don’t immediately conjure up water quality/quantity concerns, they may in the future; the rate of Utica and Class II permitting is likely to accelerate under a new White House administration more friendly to industry and averse to enforcing or enhancing regulatory hurdles.
A total of 960 and 699 PWSs are currently within five miles of Ohio Class II and Utica wells. These facilities service roughly 1.5 million and one-half million Ohioans each day, which is ~13% and 4% of the state, respectively. The average PWS within range of Class II wells is 37% to 330 times the average PWS within range of Utica wells.
Roland Marily Kemble Class II Salt Water Disposal Well, Muskingum County, Ohio, Muskingum River Watershed, 39.975, -81.845, 1,984,787 Barrels of Waste Disposed Between 2010 and Q3-2016
Fifty-eight (58%) to 69% of the PWSs within range of Class II wells are what the Ohio EPA calls Transient Non-Community (TNC) (Table 2). TNC’s are defined by the OH EPA and OH Department of Agriculture as serving[1]:
…at least 25 different persons over 60 days per year. Examples include campgrounds, restaurants and gas stations. In addition, drinking water systems associated with agricultural migrant labor camps, as defined by the Ohio Department of Agriculture, are regulated even though they may not meet the minimum number of people or service connections.
Meanwhile 60-89% of PWS’s in the shadow of Ohio’s permitted Utica wells are of the TNC variety. Even larger percentages of these PWS’s are either Groundwater or Purchased Groundwater types. Most of the PWS’s within the range gradient we looked at are privately owned, with only handful owned by federal or state agencies (Table 6).


Above: Example Class II salt water disposal (SWD) wells in Ohio
Of the 24 hydrologic unit codes (HUCs)/watersheds that contain Class II SWD wells, the lion’s share of PWS’s within the shadow of injection wells are the Tuscarawas, Mahoning, and Walhonding (Table 3). Even the Cuyahoga River, which feeds directly in the Great Lakes, is home to up to 138 PWS’s within 5 miles of Class II SWD wells. Conversely, only 13 HUCs currently contain Ohio’s Utica wells. Like Class II-affected HUCs, we see that the Mahoning, Tuscarawas, and Cuyahoga PSW’s contain most of the PWSs of interest (Table 7).
Conclusion
Watershed security/resilience concerns are growing in Eastern Ohio. Residential and agricultural water demands are increasingly coming into conflict with the drilling industry’s growing freshwater demand. Additionally, as oil and gas drilling uses more water, we will see more brine produced (Figures 1 and 2).


This, in turn, will create more demand – on top of an already exponential trend (Figure 3) – for Ohio’s existing Class II wells from across Northern Appalachia, stretching from Southeast Ohio and West Virginia to North Central Pennsylvania.


An understanding of the links between watershed security, O&G freshwater demand, brine production, and frack waste disposal is even more critical in areas like Southeast Ohio’s Muskingum River Watershed (Figure 4).
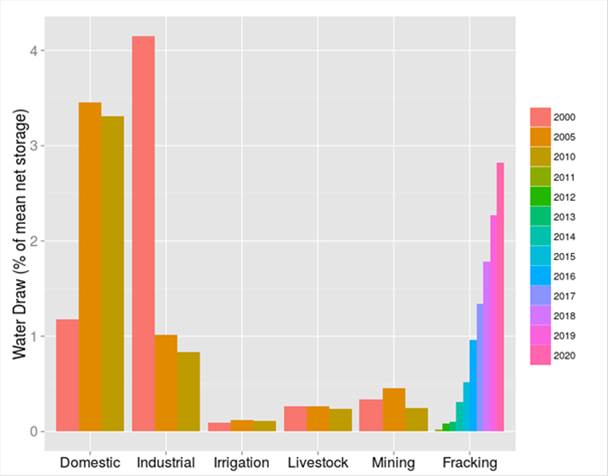
Figure 4. A Dynamic Model of Water Demand Between 2000 and 2020 within the Muskingum River Watershed, Southeast Ohio, Kurtz and Auch 2015
This is a region of the state where we have seen new water withdrawal agreements like the one below between the Muskingum River Watershed Conservancy District (MWCD) and Antero described in last week’s Caldwell Journal-Leader, Noble County, Ohio:
The [MWCD], which oversees 10 lakes in east central Ohio, approved a second short-term water sale from Seneca Lake last week. The deal, with Antero Resources, Inc., could net the district up to $9,000 a day over about a three month period, and allows Antero to draw up to 1.5 million gallons of water a day during the months of August, September and October for a total of 135 million gallons; less than one percent of the lake’s estimated volume of 14.2 billion gallons. Antero plans to use the water in its fracking operations in the area and will pay $6 per 1000 gallons drawn.
Consol Energy’s Cowgill Road Impoundment, Sarahsville, Wills Creek, Muskingum River Watershed, Noble County, Ohio, 39.8212, -81.4061
This agreement will mean an increase in new Class II SWD permits and/or discussion about converting Ohio’s thousands of other Class II wells into SWD wells. What does this change means for communities that have already seen the industry extract the equivalent of nearly 14% – and even 25-80% in several counties – of residential water from their watersheds, only to inject it 6,000+ feet into the state’s geology is unknown? (Figure 5)


It is critical that we establish and frequently revisit the spatial relationship between oil and gas infrastructure the water supplies of Appalachian Ohio. The state of national politics, federal agency oversight and administrations, growing concerns around climate change, and the fact that Southeast Ohio is experiencing more intense and infrequent precipitation events are testaments to that fact. We will be tracking these changes to Ohio’s landscape as they develop. Stay tuned.
Kleese Disposal Class II Salt Water Disposal well from the sky, Trumbull County, Shenango/Mahoning River, 41.244, -80.641. Data suggest 3,548,104 barrels of waste have been disposed of there between 2010 and Q3-2016.
Supplemental Tables
Public Water and Class II Wells
Table 1. Number of Ohio public water supplies and population served at several intervals from Class II Injection wells
| Well Distance (Miles) | # | Total Population | Ave Served Per Well | Max People Per Well |
| 0.5 | 13 | 1,992 | 153 (±120) | 446 |
| <1 | 66 | 60,539 | 917 (±4,702) | 37,456 |
| <2 | 198 | 278,402 | 1,406 (±4,374) | 37,456 |
| <3 | 426 | 681,969 | 1,601(±8,187) | 148,000 |
| <4 | 681 | 1,086,463 | 1,596 (±8,284) | 148,000 |
| <5 | 960 | 1,450,865 | 1,511 (±7,529) | 148,000 |
Table 2. Ohio public water supplies by system type, source, and ownership at several intervals from Class II Injection wells
|
Well Distance (Miles) |
System Type† | Source†† | Ownership | ||||||||
|
NTNC |
TNC |
C |
G |
GP |
S |
SP |
Private |
Local |
Fed |
State |
|
| 0.5 | 3 | 9 | 1 | 13 | 13 | ||||||
| <1 | 11 | 47 | 8 | 65 | 1 | 61 | 5 | ||||
| <2 | 30 | 118 | 50 | 177 | 16 | 5 | 164 | 34 | |||
| <3 | 76 | 245 | 105 | 385 | 32 | 8 | 351 | 75 | |||
| <4 | 122 | 392 | 167 | 628 | 40 | 12 | 574 | 106 | 1 | ||
| <5 | 162 | 564 | 234 | 878 | 30 | 32 | 19 | 823 | 135 | 1 | 1 |
† NTNC = Non-Transient Non-Community; TNC = Transient Non-Community; C = Community
†† G = Groundwater; GP = Purchased Groundwater; S = Surface Water; SP = Purchased Surface Water
Table 3. Ohio public water supplies by hydrologic unit code (HUC) at several intervals from Class II Injection wells
|
HUC Name |
Well Distance (Miles) | |||||
| 0.5 | <1 | <2 | <3 | <4 | <5 | |
| Ashtabula-Chagrin, 799 | 1 | 5 | 18 | 18 | 22 | |
| Black-Rocky, 859 | 1 | 1 | 2 | 2 | 9 | |
| Cuyahoga, 832 | 1 | 8 | 20 | 92 | 92 | 138 |
| Grand, 811 | 12 | 30 | 71 | 71 | 81 | |
| Hocking, 1081 | 4 | 18 | 18 | 22 | ||
| Licking, 1010 | 1 | 2 | 17 | 17 | 29 | |
| Little Muskingum-Middle Island, 1062 | 1 | 2 | 2 | 6 | ||
| Lower Maumee, 856 | 2 | 2 | 4 | |||
| Lower Scioto, 1091 | 6 | 6 | 9 | |||
| Mahoning, 831 | 9 | 17 | 48 | 129 | 129 | 161 |
| Mohican, 919 | 1 | 3 | 3 | 4 | ||
| Muskingum, 1006 | 1 | 3 | 15 | 15 | 33 | |
| Raccoon-Symmes, 1128 | 1 | |||||
| Sandusky, 862 | 3 | 19 | 19 | 27 | ||
| Shenango, 815 | 1 | 2 | 6 | 10 | 10 | 11 |
| St. Mary’s, 934 | 3 | 5 | 5 | 7 | ||
| Tiffin, 837 | 4 | 4 | 7 | |||
| Tuscarawas, 889 | 1 | 9 | 76 | 147 | 147 | 213 |
| Upper Ohio, 901 | 3 | 15 | 15 | 23 | ||
| Upper Ohio-Shade, 1120 | 4 | 8 | 8 | 9 | ||
| Upper Ohio-Wheeling, 984 | 1 | 1 | 4 | 4 | 5 | |
| Upper Scioto, 959 | 5 | 13 | 13 | 23 | ||
| Walhonding, 906 | 1 | 11 | 26 | 69 | 69 | 101 |
| Wills, 1009 | 2 | 3 | 12 | 12 | 14 | |
Table 4. Ohio public water supplies by county at several intervals from Class II Injection wells
|
County |
Well Distance (Miles) | |||||
| 0.5 | <1 | <2 | <3 | <4 | <5 | |
| Ashtabula | 4 | 9 | 16 | 19 | 22 | |
| Athens | 1 | 2 | 2 | 3 | ||
| Auglaize | 3 | 5 | 5 | 7 | ||
| Belmont | 1 | 4 | 5 | 6 | ||
| Carroll | 2 | 9 | 20 | |||
| Columbiana | 1 | 2 | 6 | 13 | 20 | 32 |
| Coshocton | 7 | 8 | 10 | 13 | ||
| Crawford | 1 | |||||
| Cuyahoga | 1 | |||||
| Delaware | 1 | |||||
| Fairfield | 4 | |||||
| Franklin | 1 | 3 | 7 | |||
| Fulton | 2 | 4 | 8 | |||
| Gallia | 1 | |||||
| Geauga | 8 | 19 | 33 | 60 | 71 | |
| Guernsey | 2 | 4 | 10 | 11 | 11 | |
| Harrison | 1 | 1 | ||||
| Henry | 2 | 3 | 3 | |||
| Henry | 2 | 3 | ||||
| Hocking | 3 | 10 | 11 | 13 | ||
| Holmes | 1 | 11 | 34 | 25 | 38 | 47 |
| Jefferson | 1 | 3 | 3 | 5 | ||
| Knox | 2 | 6 | 8 | 9 | ||
| Lake | 1 | 4 | 7 | 17 | 18 | |
| Licking | 1 | 2 | 10 | 14 | 26 | |
| Lorain | 1 | 4 | ||||
| Mahoning | 3 | 4 | 13 | 25 | 37 | 48 |
| Medina | 1 | 1 | 1 | 2 | 5 | |
| Meigs | 4 | 5 | 6 | 7 | ||
| Morgan | 1 | 1 | 1 | 6 | 17 | |
| Morrow | 3 | 8 | 11 | 11 | ||
| Muskingum | 3 | 8 | 15 | |||
| Noble | 1 | 2 | 2 | 3 | ||
| Perry | 5 | 6 | 8 | |||
| Pickaway | 2 | 3 | 7 | 10 | ||
| Portage | 3 | 12 | 41 | 62 | 90 | 113 |
| Seneca | 1 | 12 | 17 | 21 | ||
| Stark | 1 | 4 | 20 | 52 | 121 | 161 |
| Summit | 2 | 12 | 26 | 51 | ||
| Trumbull | 3 | 7 | 24 | 32 | 45 | 61 |
| Tuscarawas | 6 | 10 | 22 | 24 | 26 | |
| Washington | 1 | 2 | 4 | 9 | ||
| Wayne | 1 | 1 | 9 | 18 | 24 | 54 |
| Wyandot | 2 | 2 | 2 | 3 | ||
Public Water and Hydraulically Fractured Wells
Table 5. The number of Ohio public water supplies and population served at several intervals from hydraulically fractured Utica Wells
| Well Distance (Miles) | # | Total Population | Ave Served Per Well | Max People Per Well |
| 0.5 | 18 | 2,010 | 112 (±72) | 31 |
| <1 | 64 | 17,879 | 279 (±456) | 2,598 |
| <2 | 235 | 116,682 | 497 (±1,237) | 8,728 |
| <3 | 433 | 257,292 | 594 (±2,086) | 29,787 |
| <4 | 572 | 380,939 | 666 (±2,404) | 29,787 |
| <5 | 699 | 496,740 | 711 (±2,862) | 47,348 |
Table 6. Ohio public water supplies by system type, source, and ownership at several intervals from hydraulically fractured Utica Wells
|
Well Distance (Miles) |
System Type† | Source†† | Ownership | ||||||||
|
NTNC |
TNC |
C |
G |
GP |
S |
SP |
Private |
Local |
Fed |
State |
|
| 0.5 | 1 | 16 | 1 | 17 | 1 | 18 | |||||
| <1 | 9 | 45 | 10 | 59 | 3 | 1 | 1 | 58 | 6 | ||
| <2 | 50 | 137 | 48 | 216 | 6 | 3 | 10 | 206 | 29 | ||
| <3 | 83 | 265 | 85 | 400 | 14 | 5 | 14 | 381 | 51 | 1 | |
| <4 | 109 | 352 | 111 | 534 | 16 | 7 | 15 | 504 | 67 | 1 | |
| <5 | 141 | 421 | 137 | 652 | 19 | 9 | 18 | 621 | 77 | 1 | |
† NTNC = Non-Transient Non-Community; TNC = Transient Non-Community; C = Community
†† G = Groundwater; GP = Purchased Groundwater; S = Surface Water; SP = Purchased Surface Water
Table 7. Ohio public water supplies by hydrologic unit code (HUC) at several intervals from hydraulically fractured Utica wells
|
HUC Name |
Well Distance (Miles) | |||||
| 0.5 | <1 | <2 | <3 | <4 | <5 | |
| Black-Rocky, 859 | 1 | 4 | 4 | 4 | ||
| Cuyahoga, 832 | 2 | 12 | 31 | 54 | 82 | |
| Grand, 811 | 1 | 15 | 18 | 23 | ||
| Licking, 1010 | 2 | 2 | 3 | 3 | ||
| Little Muskingum-Middle Island, 1062 | 2 | 5 | 10 | 11 | 11 | |
| Mahoning, 831 | 2 | 5 | 48 | 105 | 142 | 175 |
| Muskingum, 1006 | 3 | 7 | 9 | 11 | ||
| Shenango, 815 | 2 | 5 | 10 | 13 | 14 | |
| Tuscarawas, 889 | 8 | 28 | 87 | 140 | 178 | 220 |
| Upper Ohio, 901 | 7 | 20 | 45 | 66 | 72 | 73 |
| Upper Ohio-Wheeling, 984 | 1 | 13 | 23 | 27 | 28 | |
| Walhonding, 906 | 10 | 15 | 34 | 47 | ||
| Wills, 1009 | 2 | 3 | 5 | 7 | 8 | |
Table 8. Ohio public water supplies by county at several intervals from hydraulically fractured Utica wells
|
County |
Well Distance (Miles) | |||||
| 0.5 | <1 | <2 | <3 | <4 | <5 | |
| Ashtabula | 1 | 1 | ||||
| Belmont | 1 | 2 | 7 | 14 | 15 | 16 |
| Carroll | 6 | 20 | 36 | 43 | 43 | 43 |
| Columbiana | 4 | 15 | 45 | 72 | 80 | 81 |
| Coshocton | 7 | 10 | 10 | |||
| Geauga | 14 | 20 | 25 | |||
| Guernsey | 1 | 1 | 2 | 4 | 5 | |
| Harrison | 2 | 6 | 16 | 16 | 16 | 16 |
| Holmes | 5 | 13 | 31 | 43 | ||
| Jefferson | 2 | 3 | 11 | 22 | 25 | 25 |
| Knox | 1 | 1 | 2 | 2 | ||
| Licking | 1 | 1 | 1 | 1 | ||
| Mahoning | 2 | 10 | 32 | 44 | 55 | |
| Medina | 1 | 4 | 5 | 7 | ||
| Monroe | 2 | 4 | 6 | 6 | 6 | |
| Muskingum | 1 | 1 | 1 | 2 | 3 | |
| Noble | 2 | 2 | 2 | 2 | ||
| Portage | 2 | 8 | 25 | 49 | 84 | |
| Stark | 2 | 5 | 40 | 85 | 110 | 122 |
| Summit | 6 | 10 | ||||
| Trumbull | 3 | 23 | 36 | 53 | 65 | |
| Tuscarawas | 1 | 2 | 15 | 22 | 28 | 43 |
| Washington | 3 | 10 | 12 | 13 | ||
| Wayne | 5 | 5 | 7 | 21 | ||
Footnote
- Community (C) = serve at least 15 service connections used by year-round residents or regularly serve at least 25 year-round residents. Examples include cities, mobile home parks and nursing homes; Non-Transient, Non-Community (NTNC) = serve at least 25 of the same persons over six months per year. Examples include schools, hospitals and factories.
By Ted Auch, Great Lakes Program Coordinator, FracTracker Alliance
Trackbacks & Pingbacks
[…] Contaminated water disposal, potential seismic activity, these threats and more are highlighted in the Fractracker Alliance’s recent report, which can be read here. […]
[…] Contaminated water disposal, potential seismic activity, these threats and more are highlighted in the Fractracker Alliance’s recent report, which can be read here. […]
Comments are closed.