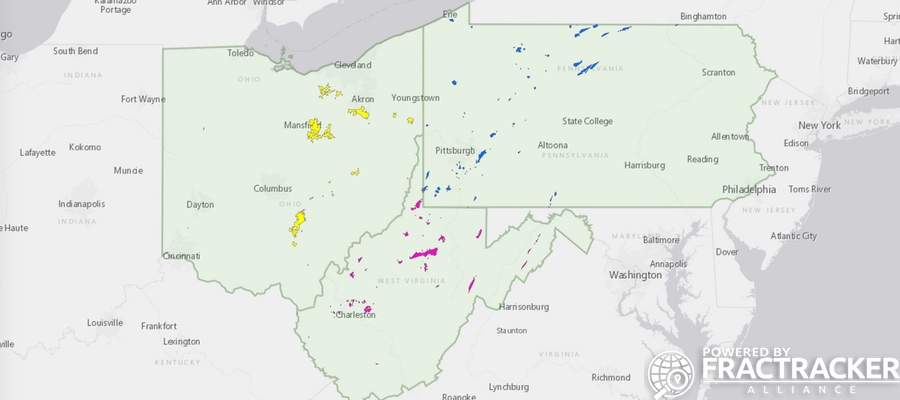
FracTracker has received numerous requests to compile a regional map of natural gas storage wells. In response, we have built the dynamic map below covering storage wells in Pennsylvania, Ohio, and West Virginia:
The colored areas on the map above (pink, blue, and yellow) correspond to gas storage wells in one of the three states. When you first view the map in fullscreen mode you will notice that these wells have been “generalized” into one large layer. That feature allows the map to load more quickly in your browser.
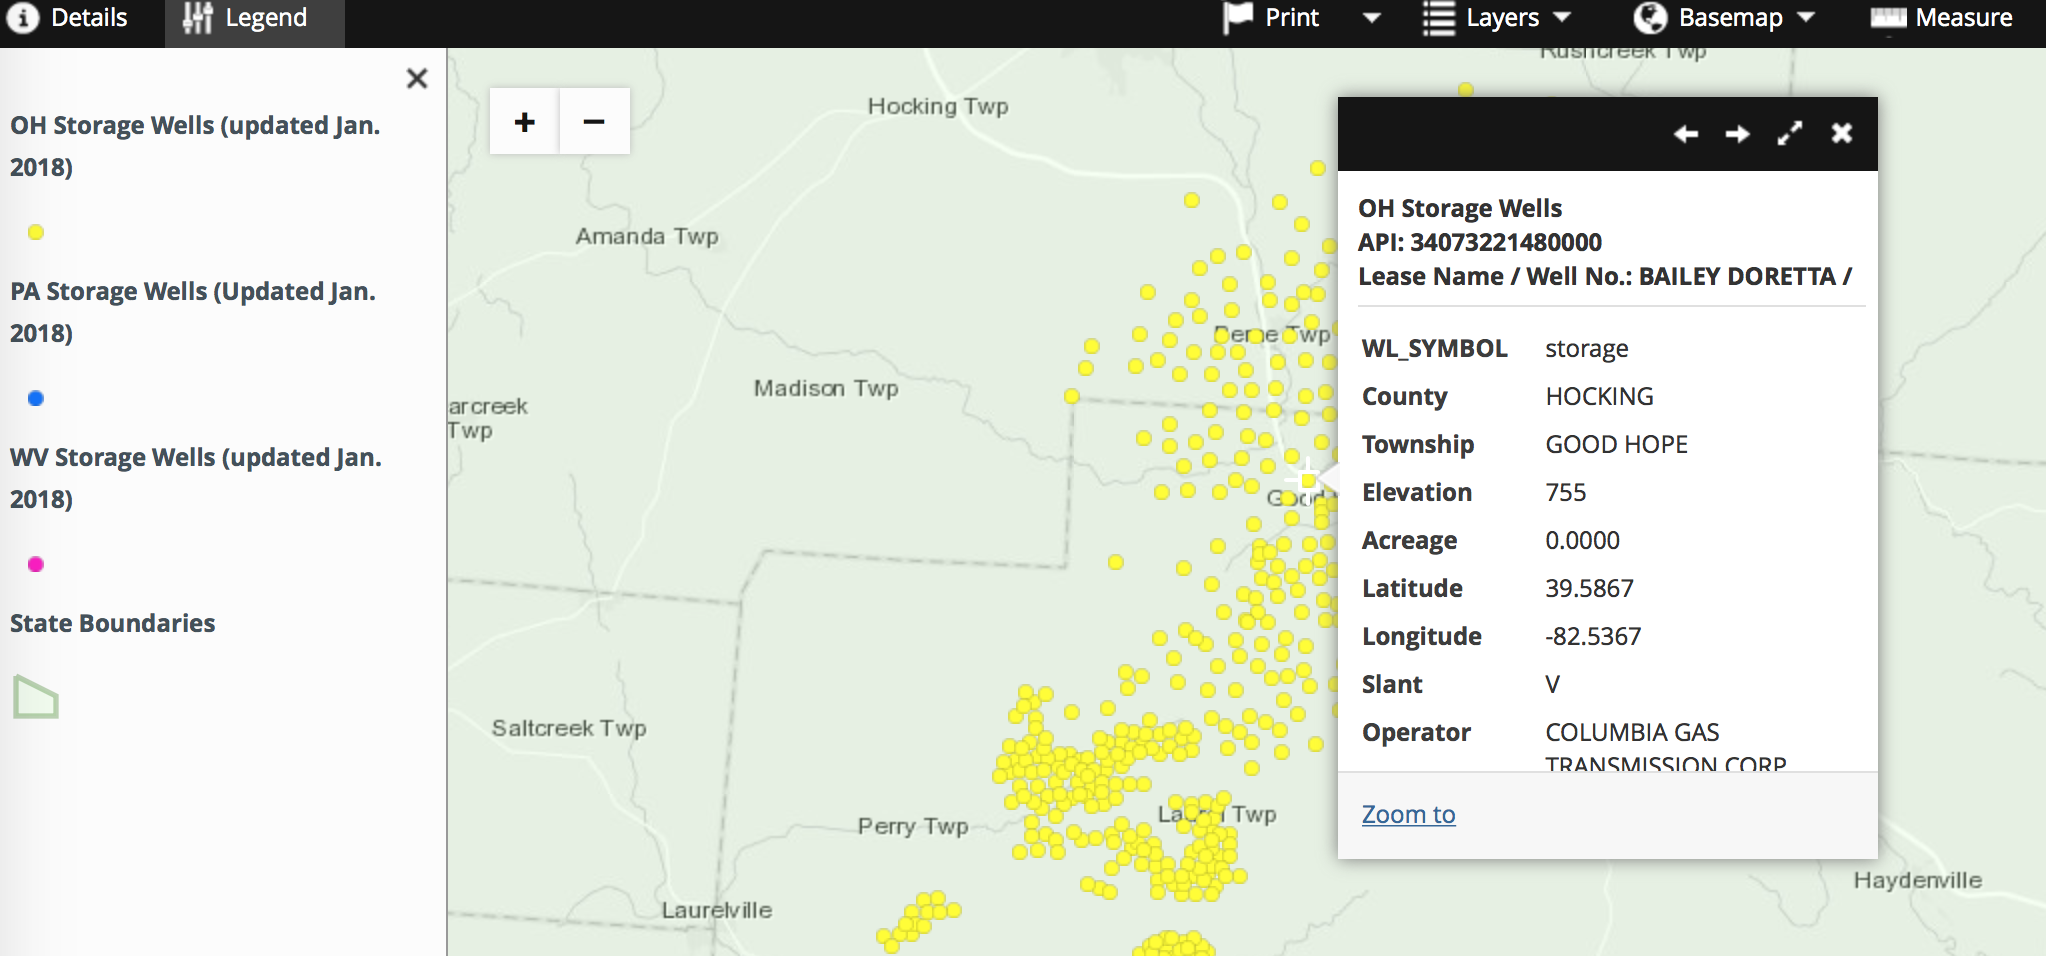
Zoom in further to where the generalized layers change to individual points in order to explore the wells more in depth, as shown in the screenshot below:
Map Metadata: Upper Appalachian Gas Storage Wells
This map shows gas storage wells in Ohio, Pennsylvania, and West Virginia. Due to the large amount of data, generalized layers were created to show the location of the storage fields at statewide zoom levels. To access well data, viewers must zoom in beyond the scale of 1:500,000, or about the size of a large county. Each state’s data includes slightly different data fields.
Data Layers include:
Name: OH Storage Wells
Date: January 2018
Source: Ohio DNR
Notes: Gas storage wells in Ohio. Storage wells selected from a broader dataset by FracTracker Alliance.
Name: PA Storage Wells
Date: January 2018
Source: Pennsylvania DEP
Notes: Gas storage wells in Pennsylvania. Storage wells selected from a broader dataset by FracTracker Alliance.
Name: WV Storage Wells
Date: January 2018
Source: West Virginia DEP
Notes: Gas storage wells in West Virginia. Storage wells selected from a broader dataset by FracTracker Alliance.
Name: State Boundaries
Date: 2018
Source: USDA Geospatial Data Gateway
Notes: State boundaries of states with gas storage wells on this map.
https://www.fractracker.org/a5ej20sjfwe/wp-content/uploads/2018/04/StorageWells-Appalachia-Feature.jpg400900FracTracker Alliancehttps://www.fractracker.org/a5ej20sjfwe/wp-content/uploads/2021/04/2021-FracTracker-logo-horizontal.pngFracTracker Alliance2018-04-11 13:41:432021-04-15 15:01:19New map available showing Upper Appalachian gas storage wells
The city of Los Angeles is considering a 2,500-foot setback safety buffer between residences and oil and gas wells. Support for the proposal is being led by the grassroots group Stand Together Against Neighborhood Drilling (STAND-LA). The push for a setback follows a recent report by the Los Angeles County Department of Public Health. According to Stand LA:
The report, requested by both the Los Angeles County Supervisors and the Los Angeles City Council, outlines the health impacts faced by residents living, attending school or worshiping near one of Los Angeles County’s 3,468 active oil wells, 880 of which operate in the City of Los Angeles.
The Department outlines the clear health impacts on residents living near active oil wells, including: adverse birth outcomes, increased cancer risk, eye, nose and throat irritation, exacerbation of asthma and other respiratory illnesses, neurological effects such as headaches and dizziness, gastrointestinal effects such as nausea and abdominal pain, and mental health impacts such as depression, anxiety or fatigue.
This information is, of course, nothing new. Living near oil and gas extraction activities, and specifically actively producing wells, has been shown in the literature to increase risks of various health impacts – including asthma and other respiratory diseases, cardiovascular disease, cancer, birth defects, nervous disorders and dermal irritation, among others.1
Spatial Assessment
While Los Angeles would benefit the most from any type of setback regulation due to the county and city’s high population density, the rest of the state would also benefit from the same.
We conducted an assessment of the number of California citizens living proximal to active oil and gas production wells to see who all would be affected by such a change. Population counts were estimated for individuals living within 2,500 feet of an oil and gas production well for the entire state. An interactive map of the wells that fall within 2,500 feet of a residence in California is shown just below in Figure 1.
Figure 1. California 2,500’ oil and gas well buffer, above. The map shows a 2,500’ buffer around active oil and gas wells in California. Wells that are located within 1,000’; 1,500’; and 2,500’ from a residence, hospital or school are also shown in the map. The counts of individuals located within 2,500’ of an active well are displayed for census tracts.
Population Statistics
The number and percentage of California residents living within 2,500 feet of an active (producing) oil and gas well are listed below:
Total At-Risk Population
859,699 individuals in California live within 2,500 feet of an active oil and gas well
% Non-White
Of the total, 385,067 are “Non-white” (45%)
% Hispanic
Of the total, 341,231 are “Hispanic” (40%) as defined by the U.S. Census Bureau2
We calculated population counts within the setbacks for smaller census-designated areas, including counties and census tracts. The results of the calculations are presented in Table 1 below.
Table 1. Population Counts by County
County
Total Pop.
Impacted Pop.
Impacted % Non-White
Impacted % Hispanic
Los Angeles
9,818,605
541,818
0.54
0.46
Orange
3,010,232
202,450
0.25
0.19
Kern
839,631
71,506
0.34
0.43
Santa Barbara
423,895
8,821
0.44
0.71
Ventura
823,318
8,555
0.37
0.59
San Bernardino
2,035,210
6,900
0.42
0.59
Riverside
2,189,641
5,835
0.46
0.33
Fresno
930,450
2,477
0.34
0.50
San Joaquin
685,306
2,451
0.55
0.42
Solano
413,344
2,430
0.15
0.15
Colusa
21,419
1,920
0.39
0.70
Contra Costa
1,049,025
1,174
0.35
0.30
Table 1 presents the counts of individuals living within 2,500 feet of an active oil and gas well, aggregated by county. Only the top 12 counties with the highest population counts are shown. “Impacted Population” is the count of individuals estimated to live within 2,500 feet of an oil and gas well. The “% Non-white” and “% Hispanic” columns report the estimated percentage of the impacted population of said demographic. There may be some overlap in these categories.
Conclusions
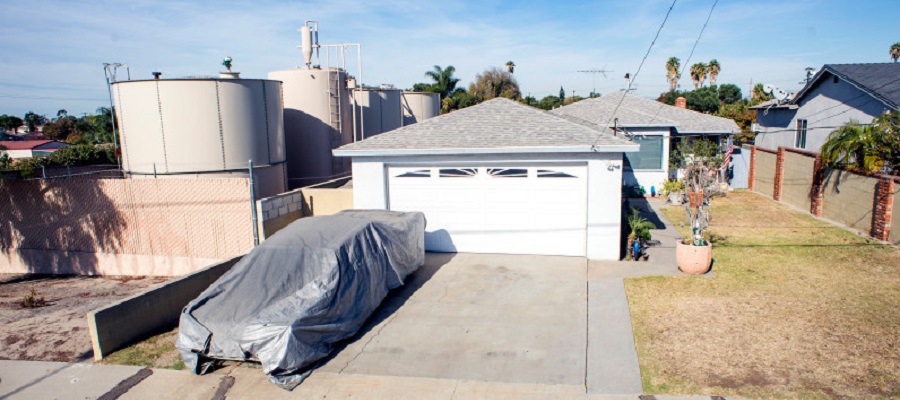
California is unique in many ways, beautiful beaches and oceans, steep mountains, massive forests, but not least of all is the intensity of the oil and gas industry. Not only are some of the largest volumes of oil extracted from this state, but extraction occurs incredibly close to homes, sometimes within communities – as shown in the photo at the top of this post.
The majority of California citizens living near active production wells are located in Los Angeles County – well over half a million people. LA County makes up 61% of Californians living within 2,500 feet of an oil and gas well, and half of them are non-white minority, people of color.
Additionally, the well sample population used in this analysis is limited to only active production wells. Much more of California’s population is exposed to pollutants from the oil and gas support activities and wells. These pollutants include acidic vapors, hydrocarbons, and diesel particulate matter from exhaust.
Our numbers are, therefore, a conservative estimate of just those living near extraction wells. Including the other activities would increase both the total numbers and the demographic percentages because of the high population density in Los Angeles.
For many communities in California, therefore, it is essentially impossible for residents to escape oil and gas pollution.
The Analysis – How it was done!
Since the focus of this assessment was the potential for impacts to public health, the analysis was limited to oil and gas wells identified as active – meaning they are producing or are viable to produce oil and/or natural gas. This limitation on the dataset was justified to remain conservative to the most viable modes of exposure to contaminants from well sites. Under the assumption that “plugged,” “buried,” or “idle” wells that are not producing (or at least reporting production figures to DOGGR) do not purvey as much as a risk of air emissions, the main route of transport for pollutants to the surrounding communities is via air emissions from “producing” oil and gas wells. The status of wells was taken from DOGGR’s “AllWells.zip” dataset (downloaded 3/7/18).
Analysis Steps:
The first step was to identify oil and gas wells in California affected by 2,500’ and shorter setbacks from occupied dwellings. To achieve this, the footprints of occupied dwellings were identified, and where there was not a data source available the footprints were digitized.
Using GIS tools, 2,500’ buffers were generated from the boundary of the occupied dwellings and a subset of active oil and gas wells located within the buffer zone were generated.
A combination of county and city zoning data and county parcel data was used to direct the selection of building footprint GIS data and the generation of additional building footprint data. Building footprint data is readily available for a number of California cities, but was not available for rural areas.
Existing footprint data was vetted using zoning codes.
Areas located within 2,500’ of well-heads were prioritized for screening satellite imagery in areas zoned for residential use.
Analytical Considerations
Buildings and facilities housing vulnerable populations were also included. Vulnerable populations include people such as children, the elderly, and the immunocompromised. These areas pose an elevated risk for such sensitive populations when they live near hazardous sites, such as oil fields in LA. A variety of these types of sites were included in the GIS analysis, including schools and healthcare facilities.
GIS techniques were used to buffer active oil and gas wells at 2,500 feet. GIS shapefiles and 2010 Decennial census data was downloaded from American Fact Finder via Census.gov for the entire state of California at the census block level.2 Census block GIS layers were clipped to the 2,500-foot buffers. Population data found in Summary File 1 for the 2010 census was attached to the clipped census block GIS layers. Adjusted population counts were calculated according to the proportion of the area of the census block falling within the 2,500’ buffer.
In August 2016, Shell Pipeline announced plans to develop the Falcon Ethane Pipeline System, a 97-mile pipeline network that will carry more than 107,000 barrels of ethane per day through Pennsylvania, West Virginia, and Ohio, to feed Shell Appalachia’s petrochemical facility currently under construction in Beaver County, PA.
FracTracker has covered the proposed Falcon pipeline extensively in recent months. Our Falcon Public EIA Project explored the project in great detail, revealing the many steps involved in risk assessments and a range of potential impacts to public and environmental health.
Shell’s response to these events has invariably focused on their intent to build and operate a pipeline that exceeds safety standards, as well as their commitments to being a good neighbor. In this article, we investigate these claims by looking at federal data on safety incidents related to Shell Pipeline.
Contrary to claims, records show that Shell’s safety record is one of the worst in the nation.
The “Good Neighbor” Narrative
Maintaining a reputation as a “good neighbor” is paramount to pipeline companies. Negotiating with landowners, working with regulators, and getting support from implicated communities can hinge on the perception that the pipeline will be built and operated in a responsible manner. This is evident in cases where Shell Pipeline has sold the Falcon in press releases as an example of the company’s commitment to safety in public comments.
Figure 1. Shell flyer
A recent flyer distributed to communities in the path of the Falcon, seen in Figure 1, also emphasizes safety, such as in claims that “Shell Pipeline has a proven track record of operating safely and responsibility and remains committed to engaging with local communities regarding impacts that may arise from its operations.”
Shell reinforced their “good neighbor” policy on several occasions at a recent Shell-sponsored information meeting held in Beaver County, stating that, everywhere they do business, Shell was committed to the reliable delivery of their product. According to project managers speaking at the event, this is achieved through “planning and training with first responders, preventative maintenance for the right-of-way and valves, and through inspections—all in the name of maintaining pipeline integrity.”
Shell Pipeline also recently created an informational website dedicated to the Falcon pipeline to provide details on the project and emphasize its minimal impact. Although, curiously, Shell’s answer to the question “Is the pipeline safe?” is blank.
U.S. Pipeline Incident Data
Every few years FracTracker revisits data on pipeline safety incidents that is maintained by the Pipeline and Hazardous Materials Safety Administration (PHMSA). In our last national analysis we found that there have been 4,215 pipeline incidents resulting in 100 reported fatalities, 470 injuries, and property damage exceeding $3.4 billion.
These numbers were based on U.S. data from 2010-2016 for natural gas transmission and gathering pipelines, natural gas distribution pipelines, and hazardous liquids pipelines. It is also worth noting that incident data are heavily dependent on voluntary reporting. They also do not account for incidents that were only investigated at the state level.
Shell Pipeline has only a few assets related to transmission, gathering, and distribution lines. Almost all of their pipeline miles transport highly-volatile liquids such as crude oil, refined petroleum products, and hazardous liquids such as ethane. Therefore, to get a more accurate picture of how Shell Pipeline’s safety record stacks up to comparable operators, our analysis focuses exclusively on PHMSA’s hazardous liquids pipeline data. We also expanded our analysis to look at incidents dating back to 2002.
Shell’s Incident Record
In total, PHMSA data show that Shell was responsible for 194 pipeline incidents since 2002. These incidents spilled 59,290 barrels of petrochemical products totaling some $183-million in damages. The below map locates where most of these incidents occurred. Unfortunately, 34 incidents have no location data and so are not visible on the map. The map also shows the location of Shell’s many refineries, transport terminals, and off-shore drilling platforms.
Open the map fullscreen to see more details and tools for exploring the data.
PHMSA’s hazardous liquid pipeline data account for more than 350 known pipeline operators. Some operators are fairly small, only maintaining a few miles of pipeline. Others are hard to track subsidiaries of larger companies. However, the big players stand out from the pack — some 20 operators account for more than 60% of all pipeline miles in the U.S., and Shell Pipeline is one of these 20.
Comparing Shell Pipeline to other major operators carrying HVLs, we found that Shell ranks 2nd in the nation in the most incidents-per-mile of maintained pipeline, seen in table 1 below. These numbers are based on the total incidents since 2002 divided by the number of miles maintained by each operator as of 2016 miles. Table 2 breaks Shell’s incidents down by year and number of miles maintained for each of those years.
Table 1: U.S. Pipeline operators ranked by incidents-per-mile
Operator
HVL Incidents
HVL Pipeline Miles
Incidents Per Mile (2016)
Kinder Morgan
387
3,370
0.115
Shell Pipeline
194
3,490
0.056
Chevron
124
2,380
0.051
Sunoco Pipeline
352
6,459
0.049
ExxonMobile
240
5,090
0.048
Colonial Pipeline
244
5,600
0.044
Enbride
258
6,490
0.04
Buckeye Pipeline
231
7,542
0.031
Magellan Pipeline
376
12,928
0.03
Marathan Pipeline
162
5,755
0.029
Table 2: Shell incidents and maintained pipeline miles by year
Year
Incidents
Pipeline Miles
Total Damage
Notes
2002
15
no PHMSA data
$2,173,704
2003
20
no PHMSA data
$3,233,530
2004
25
5,189
$40,344,002
Hurricane Ivan
2005
22
4,830
$62,528,595
Hurricane Katrina & Rita
2006
10
4,967
$11,561,936
2007
5
4,889
$2,217,354
2008
12
5,076
$1,543,288
2009
15
5,063
$11,349,052
2010
9
4,888
$3,401,975
2011
6
4,904
$2,754,750
2012
12
4,503
$17,268,235
2013
4
3,838
$10,058,625
2014
11
3,774
$3,852,006
2015
12
3,630
$4,061,340
2016
6
3,490
$6,875,000
2017
9
no PHMSA data
$242,800
2018
1
no PHMSA data
$47,000
As of 3/1/18
Cause & Location of Failure
What were the causes of Shell’s pipeline incidents? At Shell’s public informational session, it was said that “in the industry, we know that the biggest issue with pipeline accidents is third party problems – when someone, not us, hits the pipeline.” However, PHMSA data reveal that most of Shell’s incidents issues should have been under the company’s control. For instance, 66% (128) of incidents were due to equipment failure, corrosion, welding failure, structural issues, or incorrect operations (Table 3).
Table 3. Shell Pipeline incidents by cause of failure
Cause
Incidents
Equipment Failure
51
Corrosion
37
Natural Forces
35
Incorrect Operation
25
Other
20
Material and/or Weld Failure
15
Excavation Damage
11
Total
194
However, not all of these incidents occurred at one of Shell’s petrochemical facilities. As Table 4 below illustrates, at least 57 incidents occurred somewhere along the pipeline’s right-of-way through public areas or migrated off Shell’s property to impact public spaces. These numbers may be higher as 47 incidents have no mention of the property where incidents occurred.
Table 4. Shell Pipeline incidents by location of failure
Location
Incidents
Contained on Operator Property
88
Pipeline Right-of-Way
54
Unknwon
47
Originated on Operator Property, Migrated off Property
3
Contained on Operator-Controlled Right-of-Way
2
Total
194
On several occasions, Shell has claimed that the Falcon will be safely “unseen and out of mind” beneath at least 4ft of ground cover. However, even when this standard is exceeded, PHMSA data revealed that at least a third of Shell’s incidents occurred beneath 4ft or more of soil.
Many of the aboveground incidents occurred at sites like pumping stations and shut-off valves. For instance, a 2016 ethylene spill in Louisiana was caused by lightning striking a pumping station, leading to pump failure and an eventual fire. In numerous incidents, valves failed due to water seeping into systems from frozen pipes, or large rain events overflowing facility sump pumps. Table 5 below breaks these incidents down by the kind of commodity involved in each case.
Table 5. Shell Pipeline incidents by commodity spill volumes
Commodity
Barrels
Crude Oil
51,743
Highly Volatile Liquids
6,066
Gas/Diesel/Fuel
1,156
Petroleum Products
325
Total
59,290
Impacts & Costs
None of Shell’s incidents resulted in fatalities, injuries, or major explosions. However, there is evidence of significant environmental and community impacts. Of 150 incidents that included such data, 76 resulted in soil contamination and 38 resulted in water contamination issues. Furthermore, 78 incidents occurred in high consequence areas (HCAs)—locations along the pipeline that were identified during construction as having sensitive environmental habitats, drinking water resources, or densely populated areas.
Table 6 below shows the costs of the 194 incidents. These numbers are somewhat deceiving as the “Public (other)” category includes such things as inspections, environmental cleanup, and disposal of contaminated soil. Thus, the costs incurred by private citizens and public services totaled more than $80-million.
Table 6. Costs of damage from Shell Pipeline incidents
Private Property
Emergency Response
Environmental Cleanup
Public (other)
Damage to Operator
Total Cost
$266,575
$62,134,861
$11,024,900
$7,308,000
$102,778,856
$183,513,192
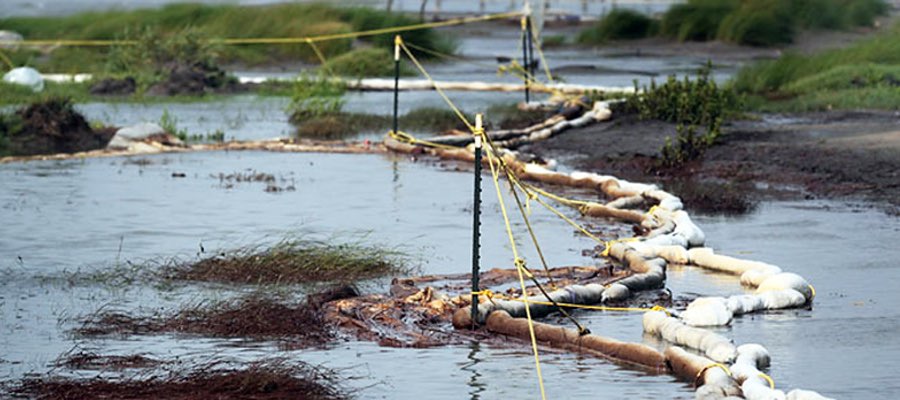
A number of significant incidents are worth mention. For instance, in 2013, a Shell pipeline rupture led to as much as 30,000 gallons of crude oil spilling into a waterway near Houston, Texas, that connects to the Gulf of Mexico. Shell’s initial position was that no rupture or spill had occurred, but this was later found not to be the case after investigations by the U.S. Coast Guard. The image at the top of this page depicts Shell’s cleanup efforts in the waterway.
Another incident found that a Shell crude oil pipeline ruptured twice in less than a year in the San Joaquin Valley, CA. Investigations found that the ruptures were due to “fatigue cracks” that led to 60,000 gallons of oil spilling into grasslands, resulting in more than $6 million in environmental damage and emergency response costs. Concerns raised by the State Fire Marshal’s Pipeline Safety Division following the second spill in 2016 forced Shell to replace a 12-mile stretch of the problematic pipeline, as seen in the image above.
Conclusion
These findings suggest that while Shell is obligated to stress safety to sell the Falcon pipeline to the public, people should take Shell’s “good neighbor” narrative with a degree of skepticism. The numbers presented by PHMSA’s pipeline incident data significantly undermine Shell’s claim of having a proven track record as a safe and responsible operator. In fact, Shell ranks near the top of all US operators for incidents per HVL pipeline mile maintained, as well as damage totals.
There are inherent gaps in our analysis based on data inadequacies worth noting. Incidents dealt with at the state level may not make their way into PHMSA’s data, nor would problems that are not voluntary reported by pipeline operators. Issues similar to what the state of Pennsylvania has experienced with Sunoco Pipeline’s Mariner East 2, where horizontal drilling mishaps have contaminated dozens of streams and private drinking water wells, would likely not be reflected in PHMSA’s data unless those incidents resulted in federal interventions.
Based on the available data, however, most of Shell’s pipelines support one of the company’s many refining and storage facilities, primarily located in California and the Gulf states of Texas and Louisiana. Unsurprisingly, these areas are also where we see dense clusters of pipeline incidents attributed to Shell. In addition, many of Shell’s incidents appear to be the result of inadequate maintenance and improper operations, and less so due to factors beyond their control.
As Shell’s footprint in the Appalachian region expands, their safety history suggests we could see the same proliferation of pipeline incidents in this area over time, as well.
NOTE: This article was amended on 4/9/18 to include table 2.