In the fleeting passage of days, FracTracker enjoyed a long history with Dr. Ben Stout. The infamous biology professor at Wheeling Jesuit University served on our board since the inception of the organization in 2012. While we didn’t get to spend as much time with him as we would have liked, each reunion was a pleasure, a reconnection with an old friend.
Ben was wily and wiry, casual and confident. He exuded a passion for protecting people and nature from industry run amok. As a scientist and educator, he was thorough and curious, yet always bold and engaged; he genuinely cared about the Appalachian communities he knew so well. The Intelligencer in Wheeling noted how he was viewed as an environmental hero. He was too humble to accept such a label, but his revelatory research and staunch advocacy warrant the honor.
On August 3rdat age 60, Ben died from recurring cancer. Even heroes can’t live forever, but this one’s legacy won’t soon fade away. Godspeed, Ben Stout – you did a whole lot of good in this world!
As part of FracTracker’s staff spotlight series, learn more about the newest member of the FracTracker team, Erica Jackson, and what she’ll be working on in the Pittsburgh tri-state region with us.
Time with FracTracker: Today is Erica’s fourth day
Title: Community Outreach and Communications Specialist
Spotlight Interview
What will you actually do in that role?
Erica Jackson, Community Outreach and Communications Specialist. View bio
I’ll be working to share FracTracker’s resources with the public. This includes developing online content, providing tools and trainings for communities affected by fossil fuels, and partnering with other environmental organizations and researchers in the area. Much of my work will be on the community-scale, focusing on oil and gas development in Pennsylvania, Ohio, and West Virginia.
I’m also here to assist with grant reporting, data analysis, mapping, and the many other activities that keep FracTracker running. Since today is my first day, I suspect I’ll have a better idea of these projects pretty soon!
Previous Position and Organization
Predoctoral Fellow in the Center for Healthy Environments and Communities (CHEC), at the University of Pittsburgh Graduate School of Public Health (Pittsburgh, PA)
How did you first get involved working on oil and gas issues / fracking?
I’ve always been interested in fossil fuel issues due to their connection with climate change, however it was not until I began researching their public health impacts that I was inspired to pursue opportunities to work in this field. Living in Pennsylvania where fracking occurs in backyards, it’s hard to ignore the risks oil and gas pose to the public, or the amount of activism and interest this topic generates. Working at CHEC was a great opportunity to familiarize myself with this issue and the data out there, as well as gain a better understanding of environmental health concerns. I’m always looking for ways to protect natural resources while also promoting healthy and sustainable communities, and working on oil and gas issues is a perfect way to do that.
What is one of the most impactful projects you are excited to be involved in with FracTracker?
I’m excited to partner with and support communities in the Ohio River Valley impacted by oil and gas. This region is at a critical point in its history, where the decisions being made now will shape the wellbeing and sustainability of the area over the next century. It’s challenging and contentious, but at a point where open data and clear communication of risks involved is vital – I’m looking forward to enhancing these efforts as a part of FracTracker.
https://www.fractracker.org/a5ej20sjfwe/wp-content/uploads/2018/08/Erica-Jackson-Feature.jpg400900FracTracker Alliancehttps://www.fractracker.org/a5ej20sjfwe/wp-content/uploads/2021/04/2021-FracTracker-logo-horizontal.pngFracTracker Alliance2018-08-23 11:29:252021-04-15 14:57:39Staff Spotlight: Erica Jackson
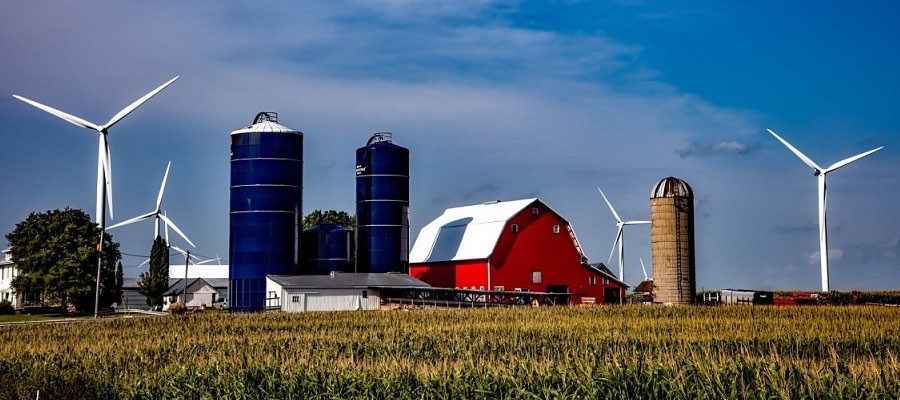
Talking about fracking all day, every day, can be a bit of a downer. Here at FracTracker, we find hope in the advances of clean energy across the country and around the world. This time around, let’s see how Missouri’s clean energy sector is fairing. Long story short – while it seems their clean energy is a bit behind in the game, at least they are trying.
In collaboration with our partners at Environmental Entrepreneurs (E2), FracTracker Alliance produced a series of maps investigating current clean energy businesses and sites where renewable energy is and can be generated. They aim to describe Missouri’s clean energy economy – and how much room it has to grow. Here is a sneak peak at some of these maps, below:
Map 1, above, shows clean renewable energy generation in Missouri. Solar and wind are the most dominant forms of renewable energy in Missouri. Missouri’s clean energy generating capacity is highest in the northwest corner of the state, where several large wind-energy projects are located. The state has 6 wind farms in this region including the newly-announced 100 MW Hawthorne Wind Farm and 49 MW High Prairie Wind Farm. In total, Missouri produces 1,000 MW of wind energy from about 500 turbines. Solar power is more dominant across the rest of the state, especially with schools’ solar energy generation around Kansas City and St. Louis and solar farms throughout the rest of the state, including Pulaski, Macon, and Bates counties. All in all, about 702 megawatts of wind and solar capacity are installed currently, with another 458 megawatts currently proposed to be built.
However, much more potential remains to be tapped as shown in Map 2, above. This holds true across solar, wind, and other renewable energy sources – particularly in the southwest corner of the state, where solar energy potential is the highest.
Missouri has up to 275,000 MW of wind potential energy, and these maps of energy potential show that overall, approximately 75% of the state has above-average potential for solar power. This is an important statistic since coal fueled 81% of Missouri’s electricity in 2017; only two other states burned more in 2017. Also, the new addition of bidirectional natural gas flow to the Rockies Express Pipeline means stiffer competition for renewables from the natural gas market.
It looks like the transition to clean energy in Missouri is happening, but there is always work to be done (nerdy “energy” joke). According to the E2 Missouri Clean Jobs Report, there is a lot of room for the clean energy sector to develop.
The potential does exist for the sector to drive economic growth in the state by being a major contributor to job growth. According the Environmental Entrepreneur’s Midwest Advocate Micaela Preskill, the industry in Missouri is slated to grow another 4.5% through 2019. Recent hires in the sector show that the workforce is very ethnically diverse, with the percentage of minority new hires doubling the average state demographics. Also 14% of new hires are veterans. Map 3, above, displays over 400 businesses, including energy efficiency contractors and renewable energy installers, which cover all 34 state senate districts. Surveys indicate that 80 percent of businesses working in clean energy in Missouri employ fewer than 25 individuals, illustrating the importance of small businesses in the clean-energy sector.
With the new state policies that support the transition from fossil fuels and the growing clean energy economy, Missouri is on a path to becoming more sustainably focused. This is particularly important because of the state’s past and present reliance on coal, and the availability of natural gas. More investment of state and federal resources in the clean energy sector could provide the boost that benefits state’s health, environment and economy through new jobs and manufacturing.
Behind in the Game Feature Image: Wind and farm. Creative Commons license.
https://www.fractracker.org/a5ej20sjfwe/wp-content/uploads/2018/08/FarmWind-Feature.jpg400900Kyle Ferrar, MPHhttps://www.fractracker.org/a5ej20sjfwe/wp-content/uploads/2021/04/2021-FracTracker-logo-horizontal.pngKyle Ferrar, MPH2018-08-22 11:30:442021-04-15 14:57:40Missouri’s clean energy is behind in the game, but at least they’re trying
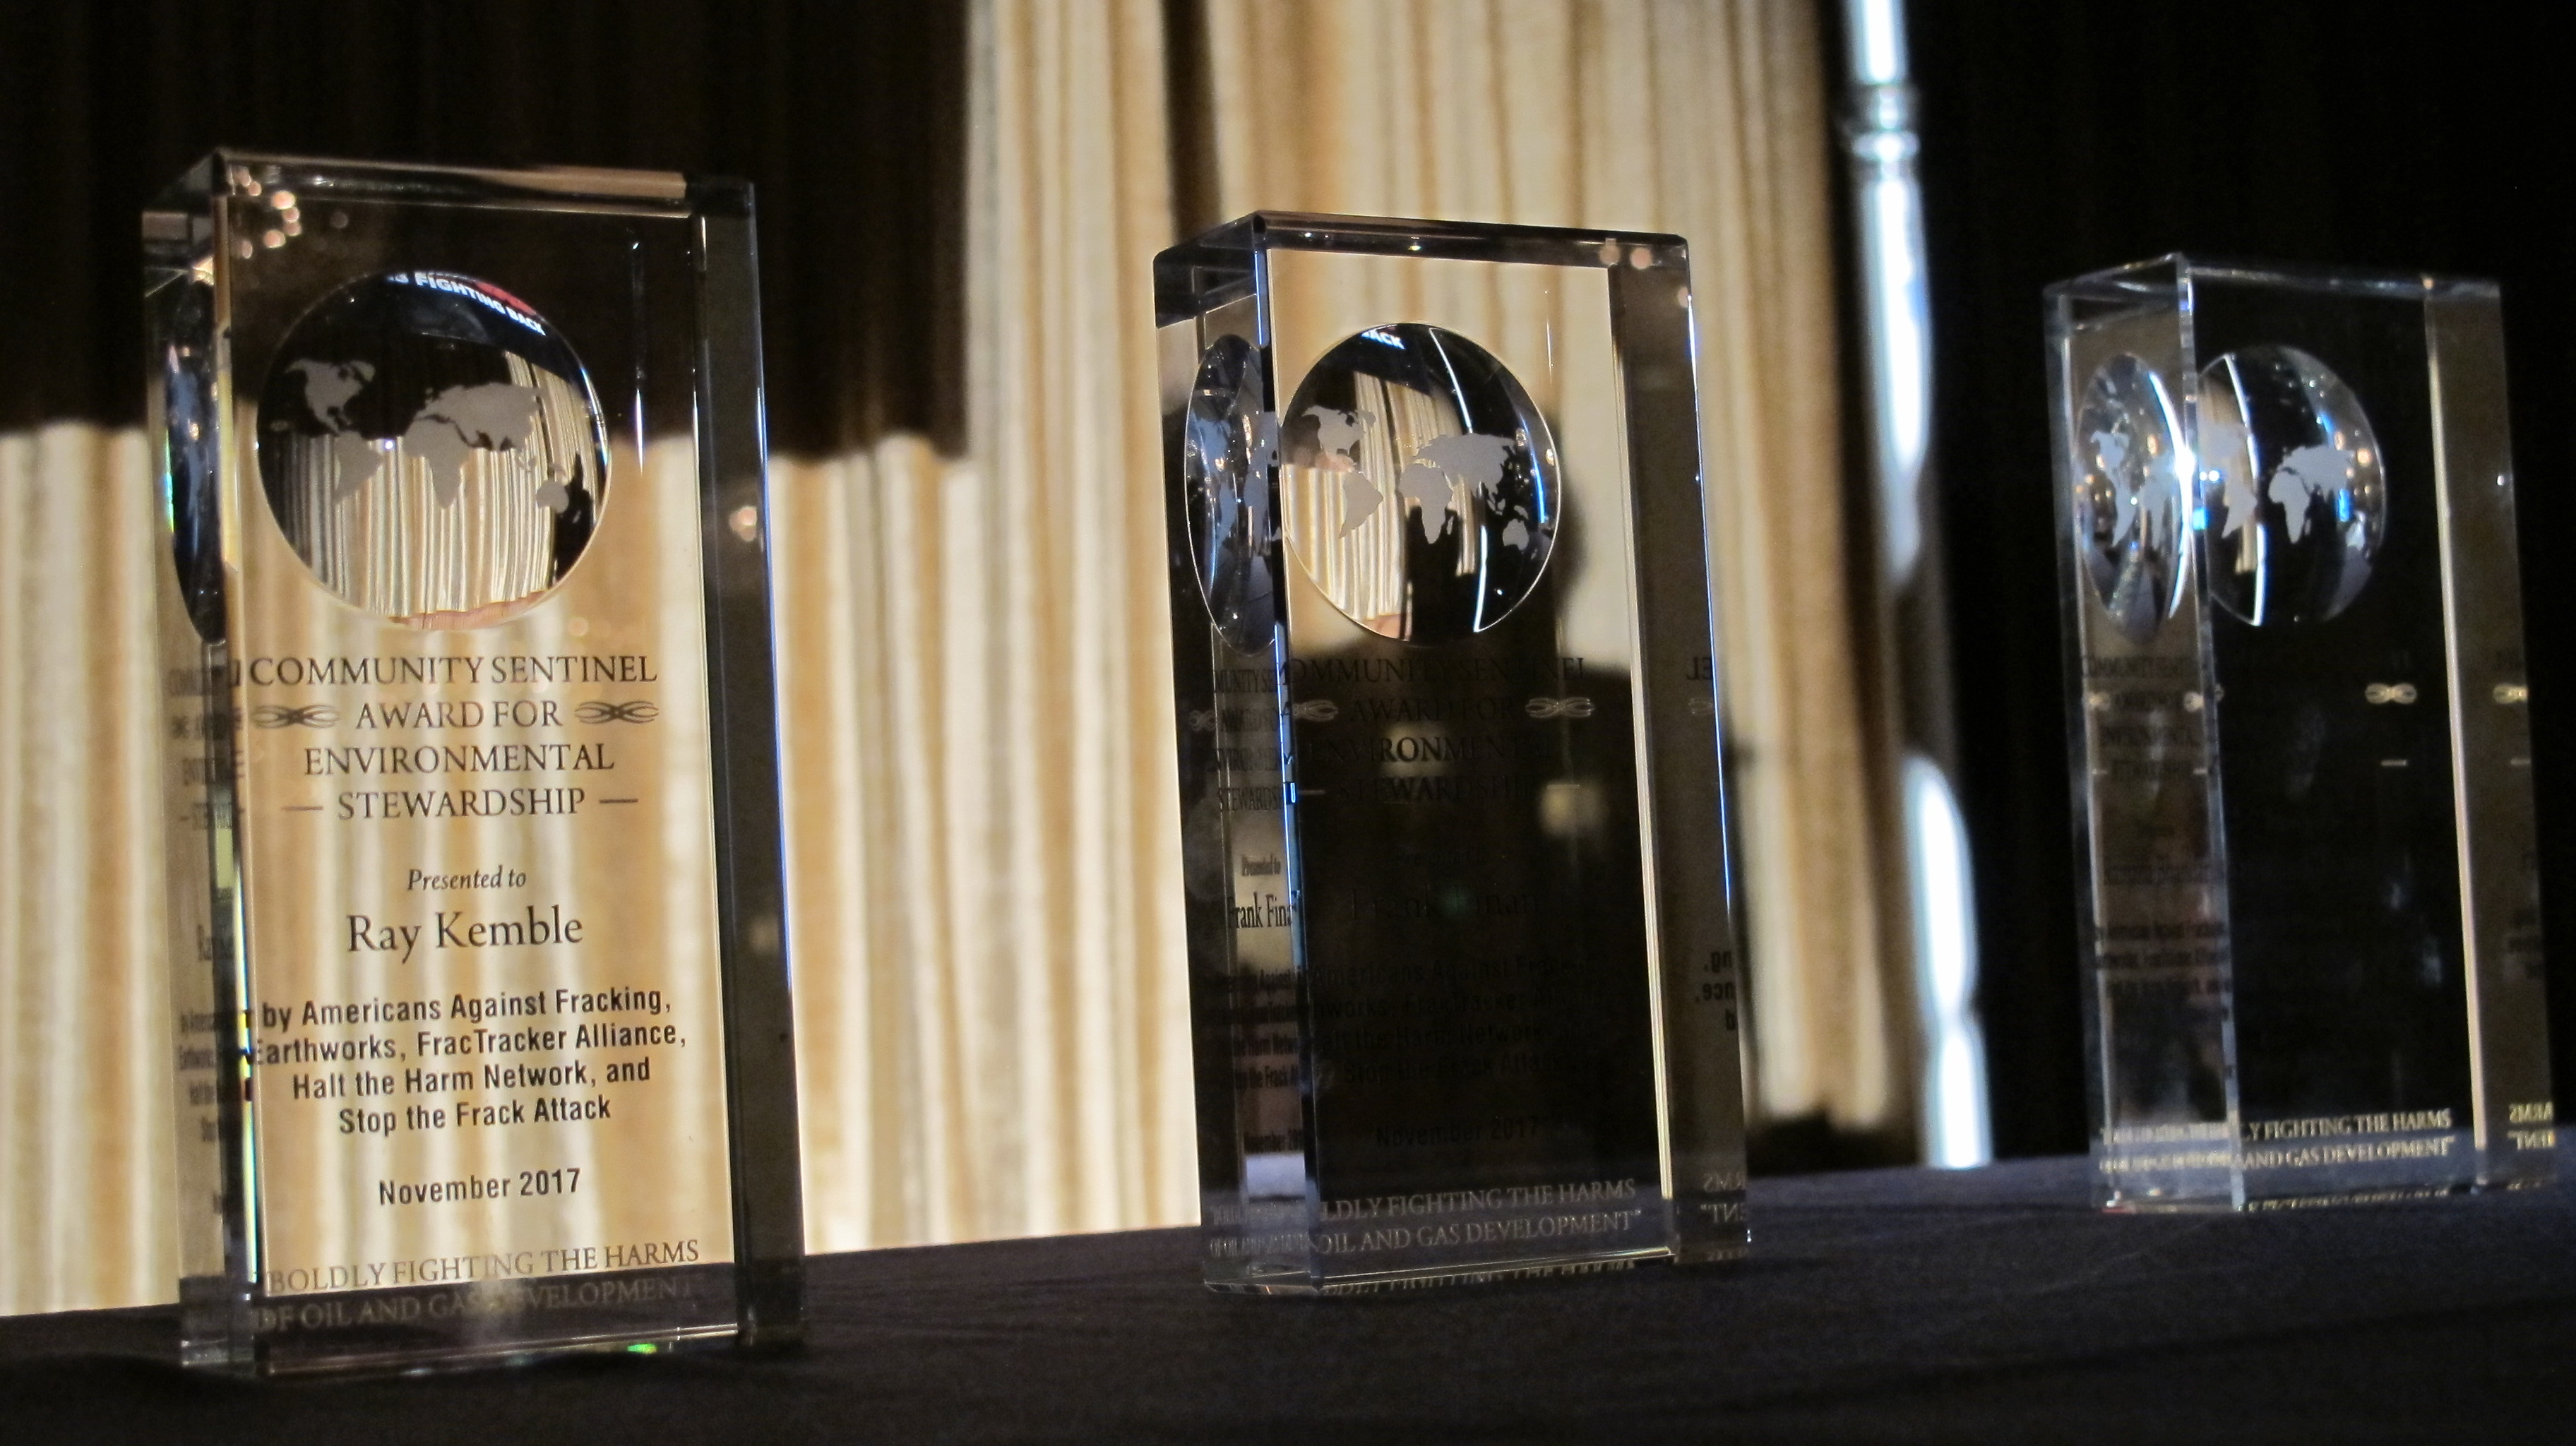
The impacts of the oil and gas industry are visible across the United States: farms sliced by dangerous pipelines, neighborhoods invaded with fracked wells, towns choked by petrochemical emissions, streams littered with throwaway plastics, regions plagued by extreme weather and a changed climate. But hope abounds in the thousands of volunteers working in their communities and cherished places to document, report, and confront such fossil fuel harms.
Awards presented to the recipients of the 2017 Community Sentinel Award for Environmental Stewardship
About the Community Sentinel Award
To honor these environmental heroes, FracTracker Alliance created the Community Sentinel Award for Environmental Stewardship, now in its fourth year, to celebrate individuals whose noble actions exemplify the transformative power of caring, committed, and engaged people. In collaboration with a supportive lineup of sponsors and partners, the award is presented to multiple recipients at a festive reception before a group of fellow activists and others who champion a healthy, sustainable future.
This year, each awardee will receive $1,000 to perpetuate their efforts and will be recognized at an evening reception in Pittsburgh, PA on November 26, 2018 hosted by FracTracker Alliance and the sponsors and partners listed below. Please nominate a community sentinel for this prestigious award through the online form by September 14th, midnight ET.
In the event an activist has passed away in the last year, we would still like to recognize them for their efforts within a Legacy of Heroes presentation during the award ceremony in Pittsburgh. Last year was the first time we included the Legacy of Heroes component on the agenda of the annual award ceremony, and we will be including it again this year. The deadline to request we include an individual in this presentation is October 12, 2018, midnight ET. Legacy of Heroes nominations are not subject to the judging panel, but please be sure you have the family’s permission to nominate a lost environmental steward before filling out the online form.
September 14: Sentinel nomination period closes and judging begins
September 28: Judging ends, Winners notified
October 12: Deadline to submit nominations for the Legacy of Heroes presentation
November 26: Award ceremony and reception in Pittsburgh, PA (tickets available soon)
If you have any questions about the Community Sentinel award, the Legacy of Heroes nomination, or the award ceremony to be held on November 26th, please contact FracTracker at: info@fractracker.org.
Read about the 2017 Community Sentinel Award program. Learn more.
Sponsors and Partners
This work would not be possible without several incredible supporters. As of today, the 2018 Community Sentinel Award for Environmental Stewardship is made possible through the generosity of the following sponsors: 11th Hour Project, Foundation for Pennsylvania Watersheds, and The Heinz Endowments. Partners currently include: Breathe Project, Crude Accountability, Earthworks, FracTracker, Halt the Harm Network, Ohio Valley Environmental Coalition, Property Rights and Pipeline Center, and Viable Industries. Thank you for helping us honor these environmental stewards!
https://www.fractracker.org/a5ej20sjfwe/wp-content/uploads/2016/06/SentinelAward-Feature.jpg400900FracTracker Alliancehttps://www.fractracker.org/a5ej20sjfwe/wp-content/uploads/2021/04/2021-FracTracker-logo-horizontal.pngFracTracker Alliance2018-08-20 13:00:282021-04-15 14:57:402018 Community Sentinel Award nominations now being accepted
The small city of Arvin, CA has succeeded in taking a brave step forward to protect the public health of its community.
On July 17, 2018 the Arvin City Council voted 3-0 (two members were absent) in support of a setback ordinance. This is the first California oil and gas ordinance that has an actual effect, as it is the first in a region where drilling and fracking are actively occurring. The Arvin, CA setback ordinance prevents wells from being drilled in residential or commercially-zoned spaces. Also, setback distances of 300 feet for new development and 600 feet for new drilling operations have been established for sensitive sites, such as parks, hospitals, and schools.
(To see where other local actions have been taken in California, check out our coverage of local actions and map, which was recently updated.)
More details and maps of the setback ordinance and its development can be found in the initial FracTracker coverage of the proposal, below:
The measure was supported by Arvin Mayor Jose Gurrola. He described the front-lines experience of Arvin citizens:
The road to the update has been difficult for this community. Eight Arvin families were evacuated after a toxic gas leak from an underground oilfield production pipeline located near their homes in 2014. Some have now been re-occupied by concerned residents with no other options; other homes still stand empty. Meanwhile, a short distance away an older pump jack labors day and night next to homes pumping oil mixed with water to a nearby tank. Despite multiple complaints to state agencies of odors and noise by the residents, they are told by the agencies that there is nothing that can be done under the current regulations. The pump jack continues to creak along as children walk nearby on their way to school, covering their faces as the smell occasionally drifts their direction. – Jose Gurrola, Mayor of the City of Arvin
Fugitive Emissions Monitoring
In anticipation of the city council’s vote, FracTracker collaborated with Earthworks and the grassroots organization Central California Environmental Justice Network to visit the urban well sites within the city limits. Using Infrared FLIR technology, the sites were assessed for fugitive emissions and leaks. Visualizing emissions of volatile organic compounds (VOCs) at these sites provides a glimpse to what the community living near these wells are continually exposed. The infrared cameras used in these videos are calibrated to the wavelengths of the infrared spectrum where VOC hydrocarbons of interest are visible.
The map below shows the locations that were visited, as indicated by the three stars. Videos of each site are shown below the map.
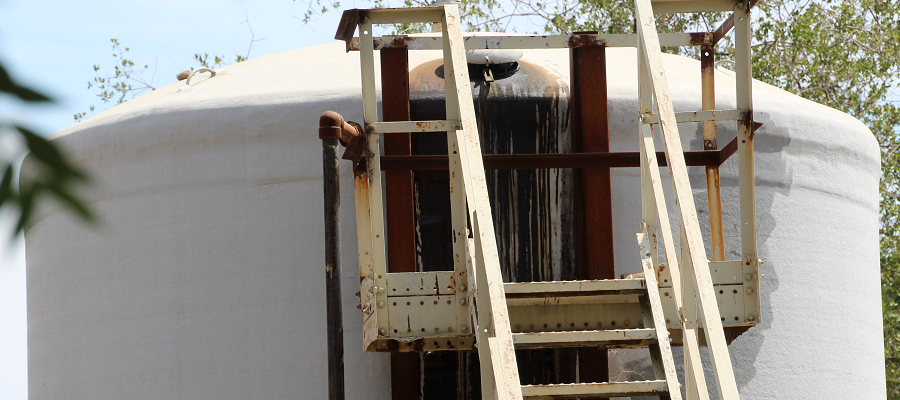
In this FLIR video of Sun Mountain Simpson-1, fugitive emissions are obvious. The emissions are coming from the PV vent at the top of the produced water tank. These emissions are a mixture of a variety of volatile organic compounds, such as BTEX compounds and methane. This well site is located between homes, a small apartment complex, and a playground. While on the ground operating the FLIR camera I felt light headed, dizzy, and developed a headache. The emissions were reported to the San Joaquin Valley Air District (SJVAD), who sampled and found VOC concentrations at dangerous levels. The well operator was notified but refused to respond. Unfortunately, because this particular well produces under 50 barrels of oil/day, the site is exempt from any health related emissions regulations.
Sun Mountain Jewett 1-23 Lease
This well site is located near a number of single family homes and next two a park. The well site is also on the future location of the Arvin Community College. The FLIR video below is particularly interesting because it shows fugitive emissions from four different locations. The leaks include one at the well head that is potentially underground, one on separator equipment, and leaks from each of the tank PV hatches. When regulators were notified, they visited the site and fixed two of the leaks immediately. Fugitive emissions from the PV hatches were not addressed because this site is also exempt from regulations.
ABA Energy Corporation Richards Facility Tank Farm
The Richards Facility Tank Farm is a well site located outside the city limits on farmland. The facility is regulated as a point source of air pollution, therefore enforcement action can require the operator to fix leaks even from PV hatches on tanks. This FLIR video shows leaks from PV hatches, and a major leak from a broken regulator valve. A complaint was submitted to the SJVAD, and the operator was required to replace the broken regulator valve.
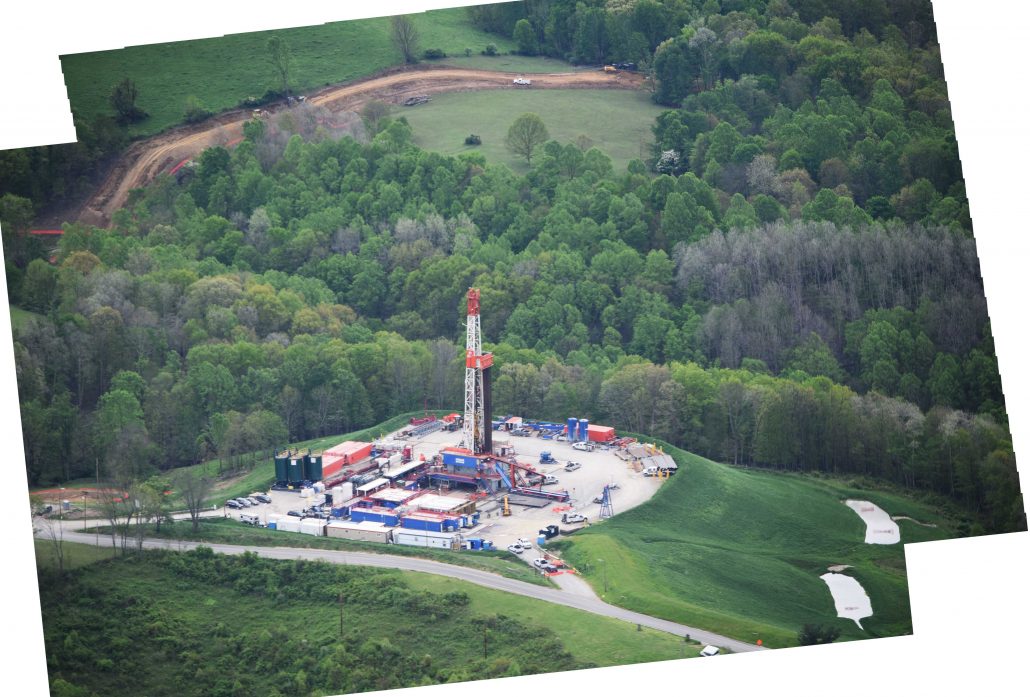
“The aeroplane has unveiled for us the true face of the earth.” by French writer and aviator Antoine de Saint-Exupéry author of Le Petit Prince (The Little Prince)
I always tell people that you can’t really understand or appreciate the enormity, heterogeneity, and complexity of the unconventional oil and gas industry’s impact unless you look at the landscape from the cockpit of a Cessna 172. This bird’s-eye-view allows you to see the grandeur and nuance of all things beautiful and humbling. Conversely, and unfortunately more to the point of what I’ve seen in the last year, a Cessna allows one to really absorb the extent, degree, and intensity of all things destructive.
I’ve had the opportunity to hop on board the planes of some amazing pilots like Dave Warner, a forester formerly of Shanks, West Virginia (Note: More on our harrowing West Virginia flight with Dave later!!), Tim Jacobson Esq. out of La Crosse, Wisconsin, northern Illinois retired commodity and tree farmer Doug Harford, and Target corporate jet pilot Fred Muskol out of the Twin Cities area of Minnesota.
Since joining FracTracker I’ve been fortunate to have completed nearly a dozen of these “morning flights” as I like to call them, and five of those have taken place since August 2017. I’m going to take the next few paragraphs to share what I’ve found in my own words and by way of some of the photos I think really capture how hydraulic fracturing, and all of its tentacles, has impacted the landscape.
The following is by no means an empirical illustration. I’m increasingly aware, however, that often times tables, charts, and graphs fail to capture much of the scale and scope of fossil fuel’s impact. Photos, if properly georeferenced and curated, are as robust a source of data as a spreadsheet or shapefile, both of which are the traditional coins of the realm here at FracTracker.
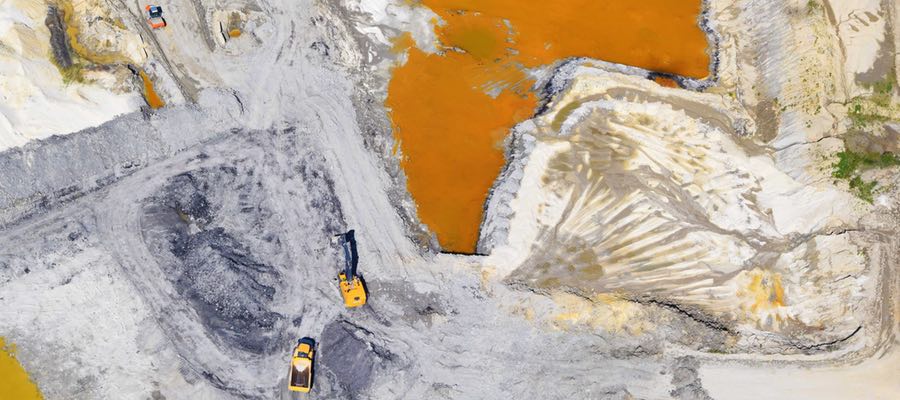
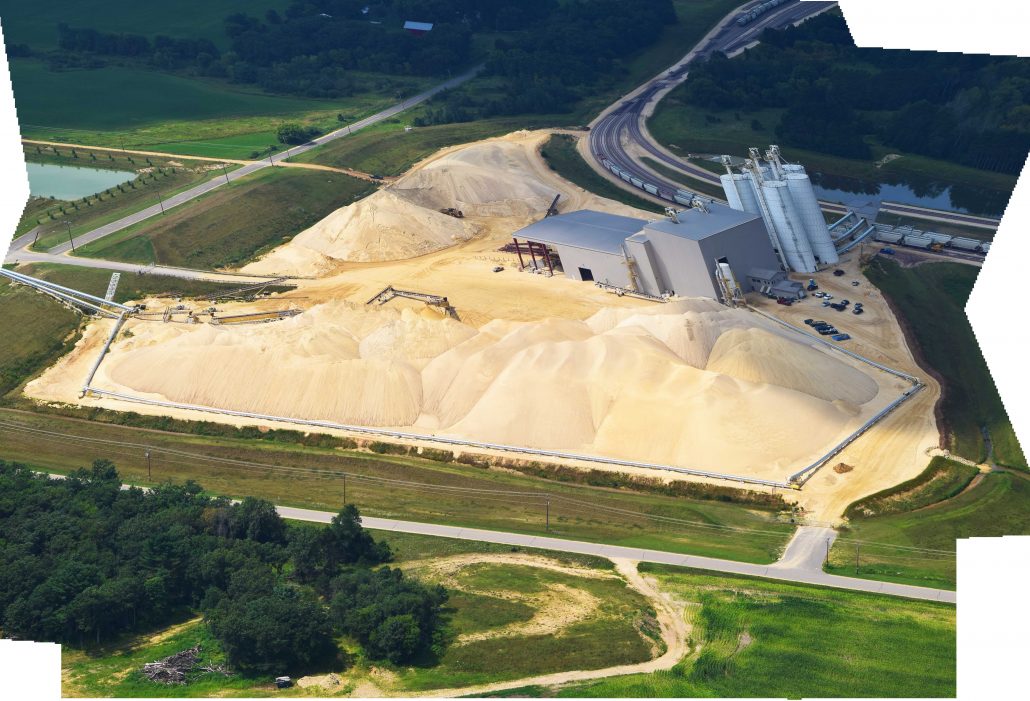
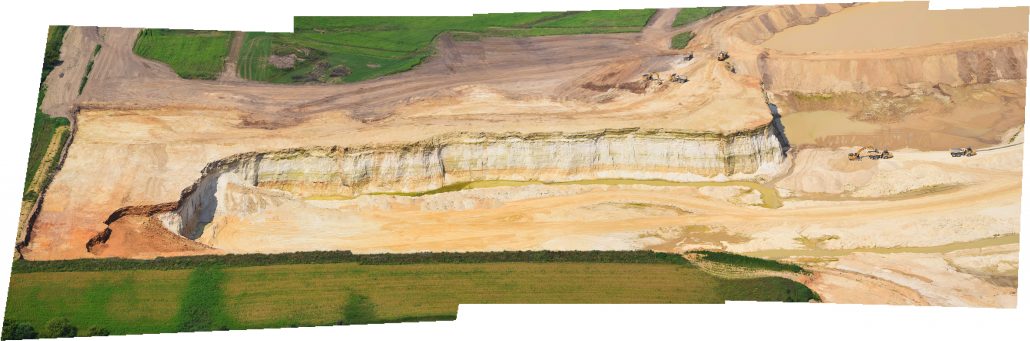
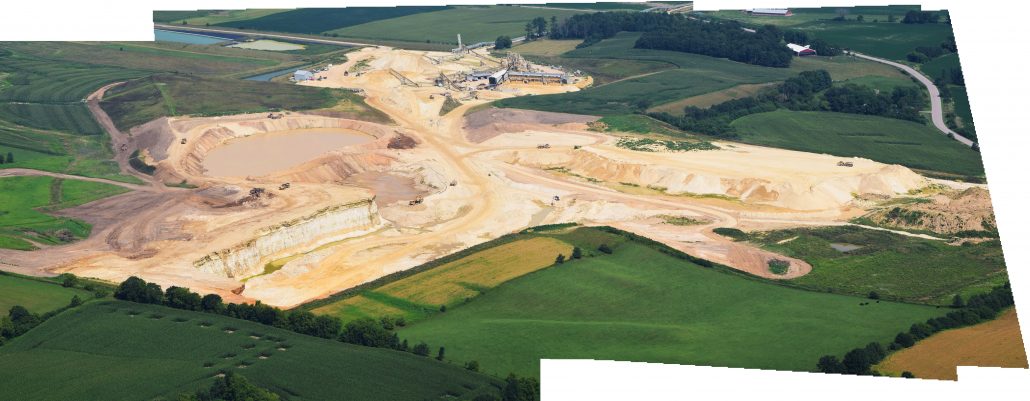
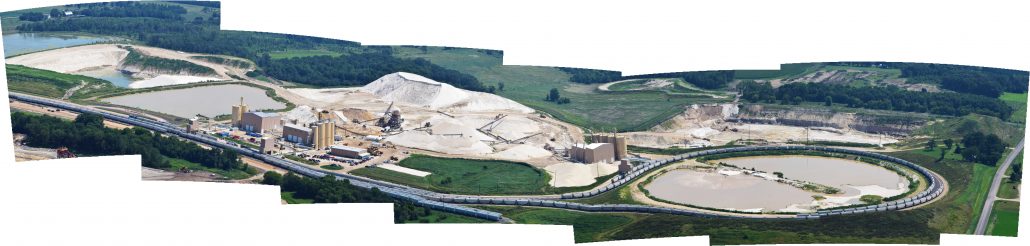
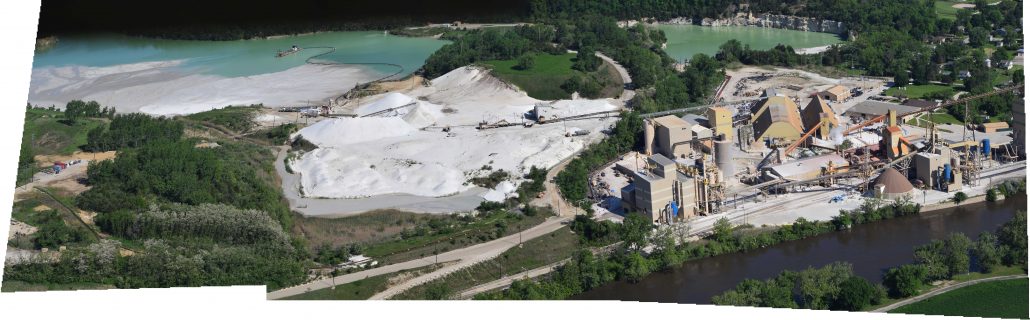
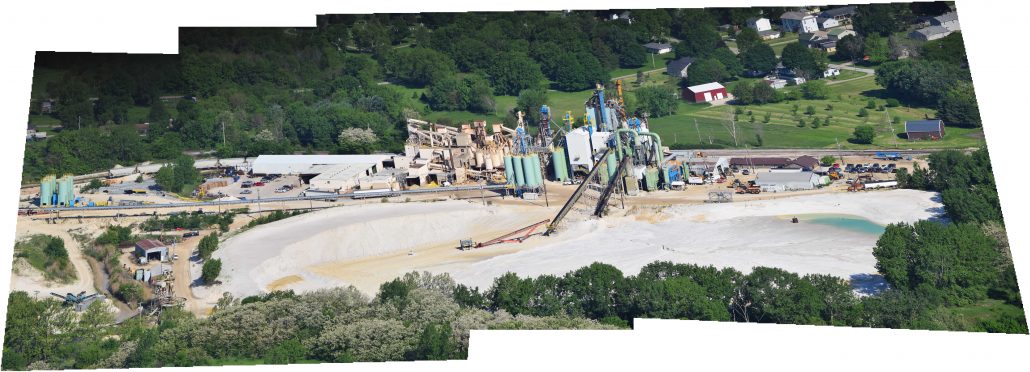
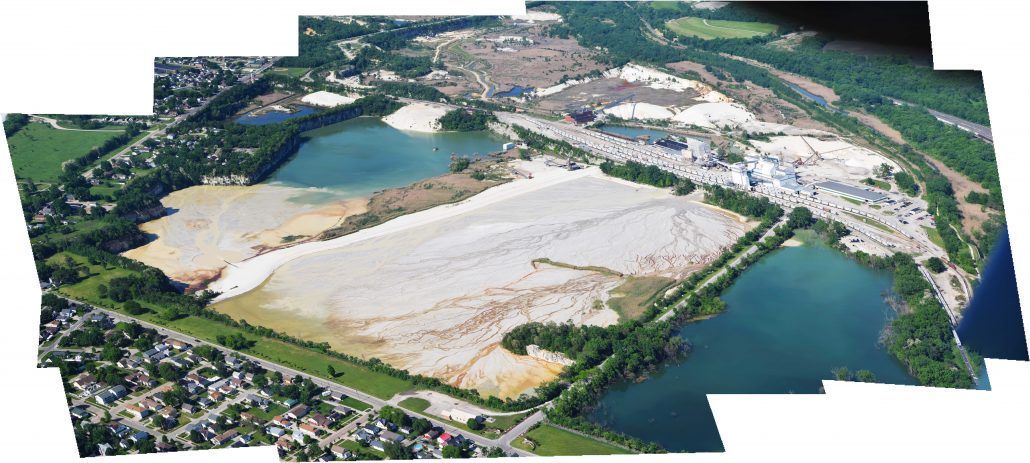
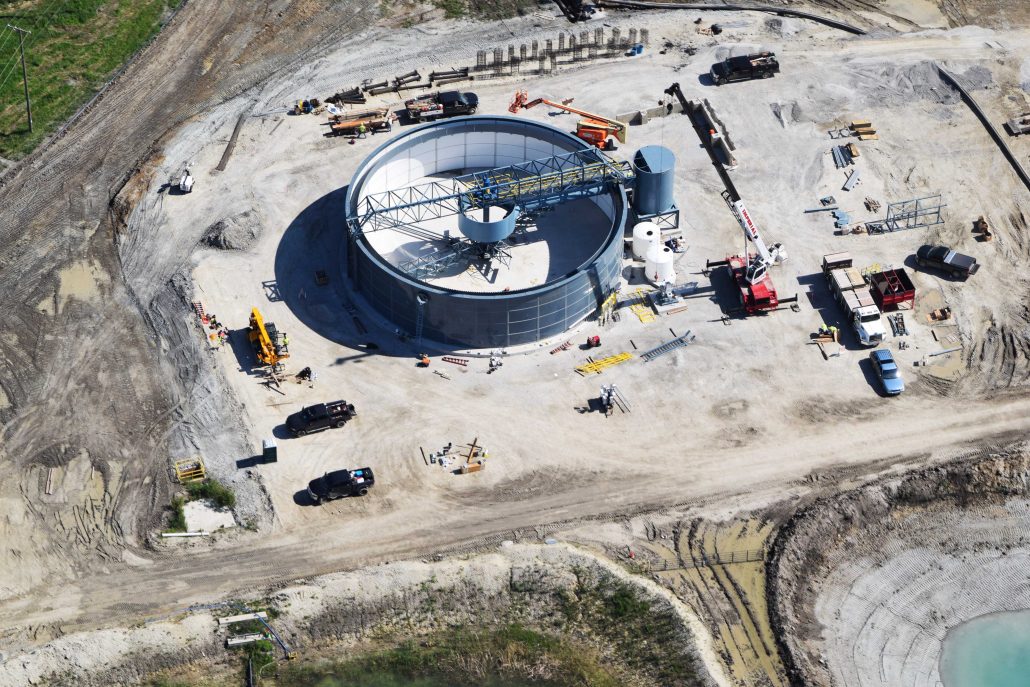
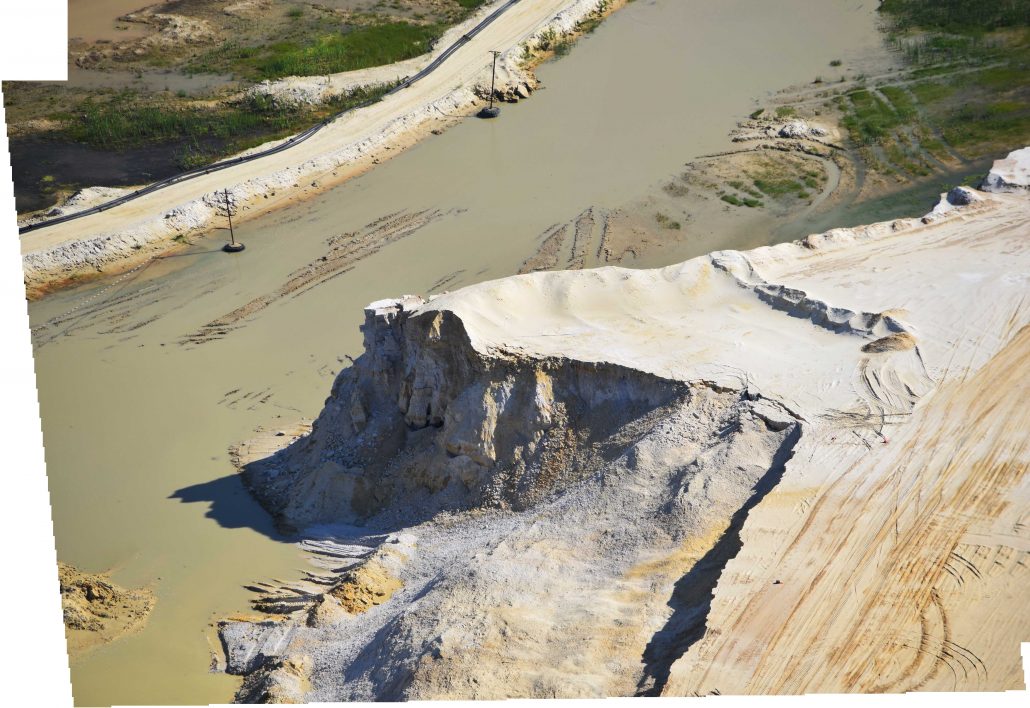
West Central Wisconsin Frac Sand Mines
August 2, 2017
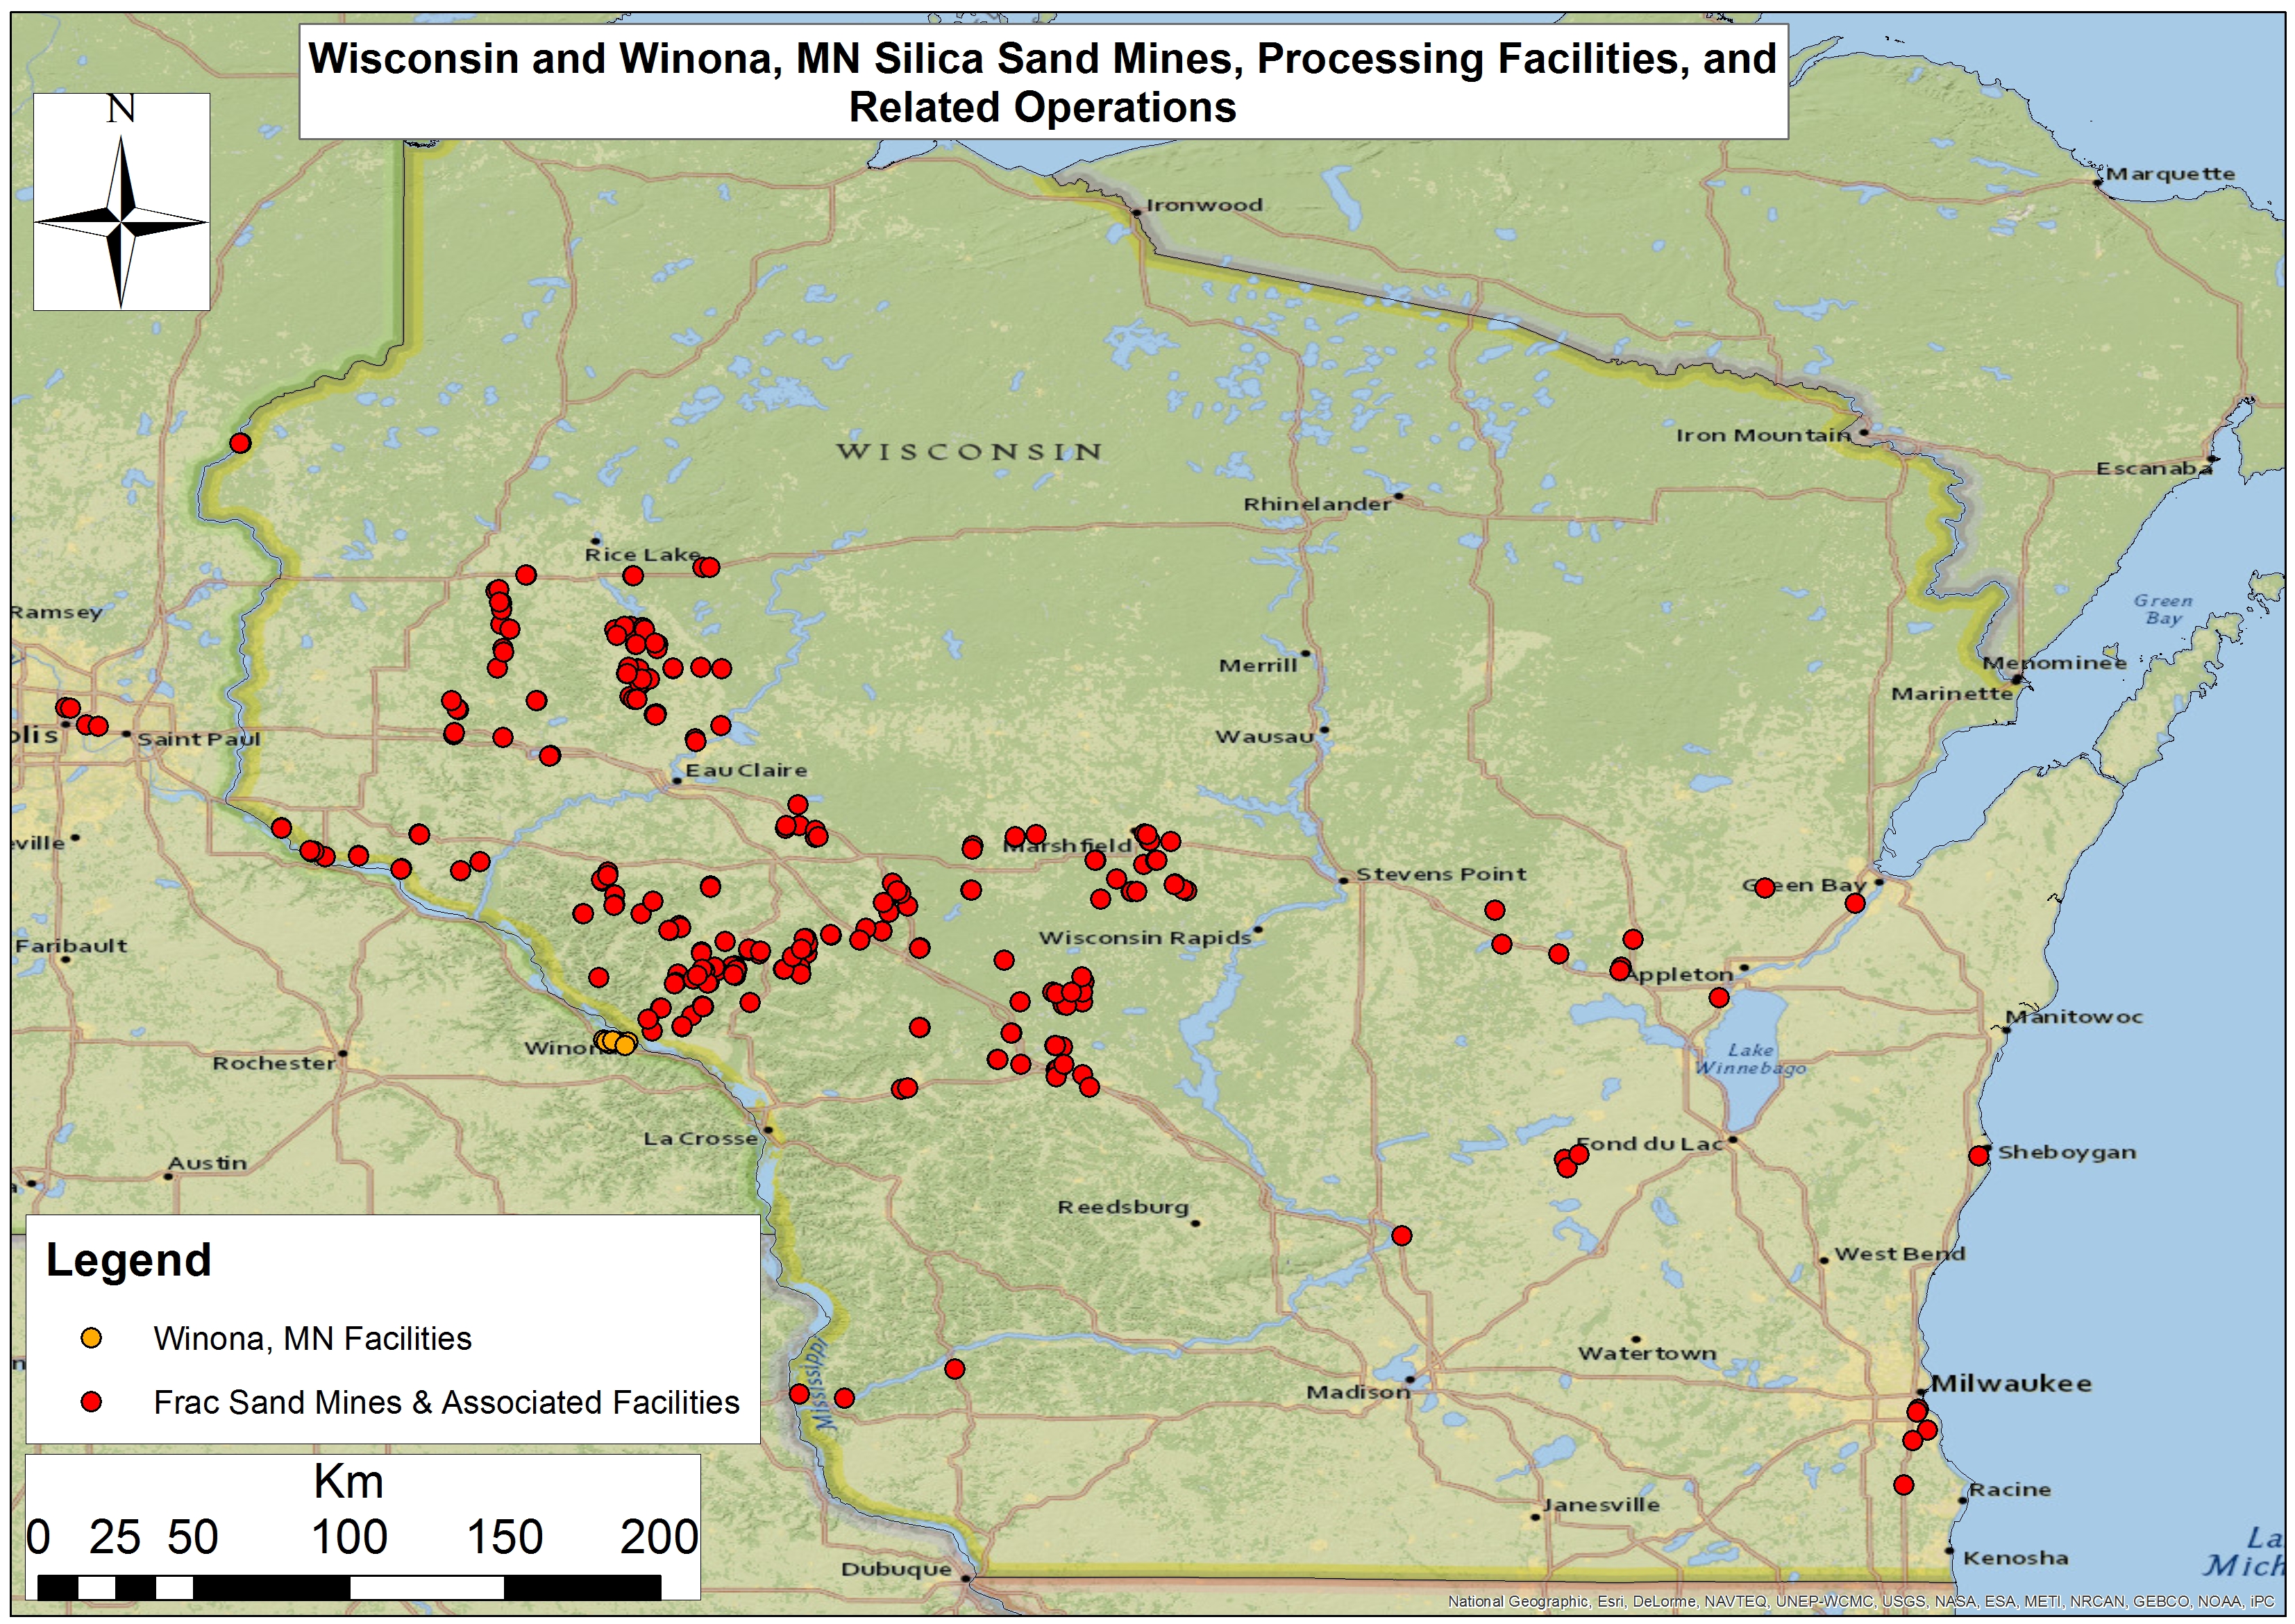
Figure 1. Wisconsin and Winona, Minnesota silica sand mines, processing facilities, and related operations
It was nearly a year ago today that I met Bloomer, Wisconsin dairy farmer Ken Schmitt at the Chippewa Valley Regional Airport (KEAU) and soon thereafter jumped into Tim Jacobson’s Cessna 172 to get a bird’s-eye-view of the region’s many frac sand mines and their impacts (Figure 1). These sites are spread out over a 12-county region known as West Central Wisconsin (WCW). Ken hadn’t been up to see these mines since October of 2016 and was eager to see how they had “progressed,” knowing what he did about their impact on his neck of the woods in northern Chippewa County.
Ken is one of the smartest guys I’ve ever met, and – befitting a dairy farmer – he is also one of the most conservative and analytical folks I’ve ever met. However, that morning it was clear that his patience with county administrators and the frac sand mining industry had long since run out. He was tired of broken promises, their clear and ubiquitous bullying tactics, and a general sense that his livelihood and the farm he was hoping to leave his kids were at risk due to sand mining’s complete capture of WCW’s residents and administrators.
Meanwhile Mr. Jacobson Esq. was intimately familiar with some of the legal tools residents were using to fight the spread of sand mining in the WCW. This is something he referred to as “anticipatory nuisance” lawsuits, which he and his colleagues were pursuing on behalf of several landowners against OmniTrax’s (f/k/a Terracor) “sand mine, wet and dry processing, a conveyor system to a rail load out with manifest yard” proposal in Jackson County, Wisconsin. I, too, have worked with Tim to inform some of his legal work with respect to the nuisance stories and incidents I’ve documented in my travels, as well as research into the effects of sand mining across Michigan, Illinois, Minnesota, and Wisconsin.
Explore details from our sand mining tour by clicking on the images below:
Our flight lasted nearly 2.5 hours and stretched out over 4,522 square miles. It included nearly 20 sand mines – and related infrastructure – in the counties of Jackson, Wood, Clark, Eau Claire, Monroe, Trempealeau, and Buffalo. What we saw was a sizeable expansion of the mining complex in the region since the last time I flew the area – nearly four years earlier on October 8, 2013. The number and size of mines that had popped up since that trip were far greater than any of us had expected.
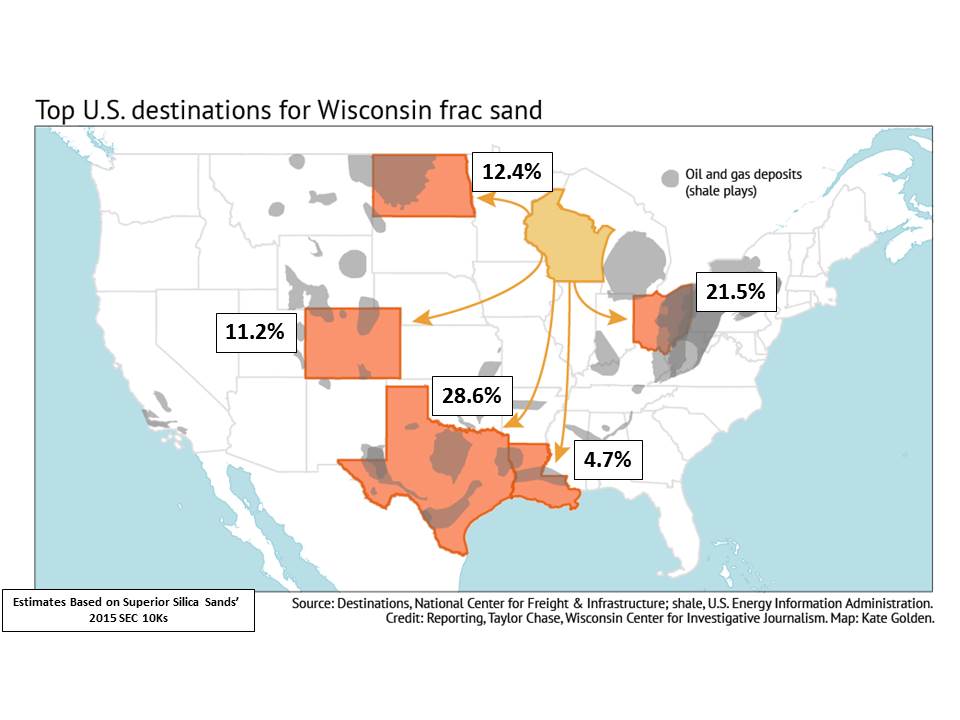
This expansion paralleled the relative – and total –increase in demand for “proppant” from the High Volume Hydraulic Fracturing (HVHF) all across the country (Figure 2).
Figure 2. A map of the likely destination for Wisconsin’s frac sand mines silica sand based on an analysis of Superior Silica Sand’s 2015 SEC 10Ks.
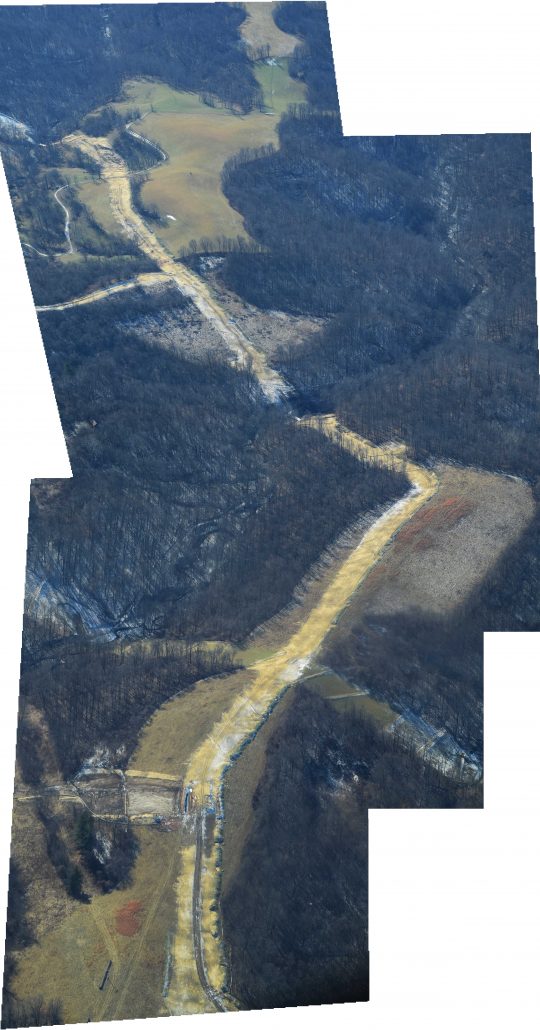
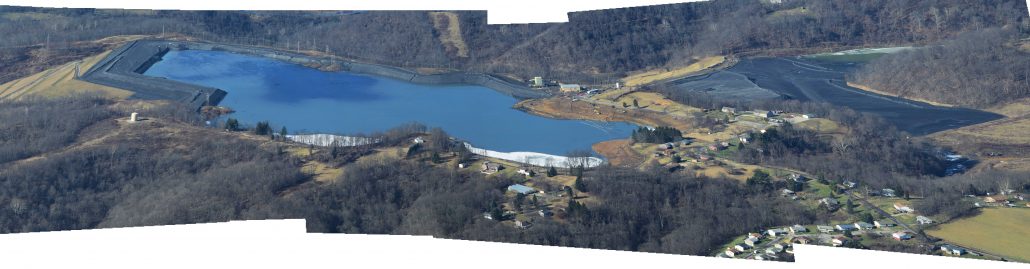
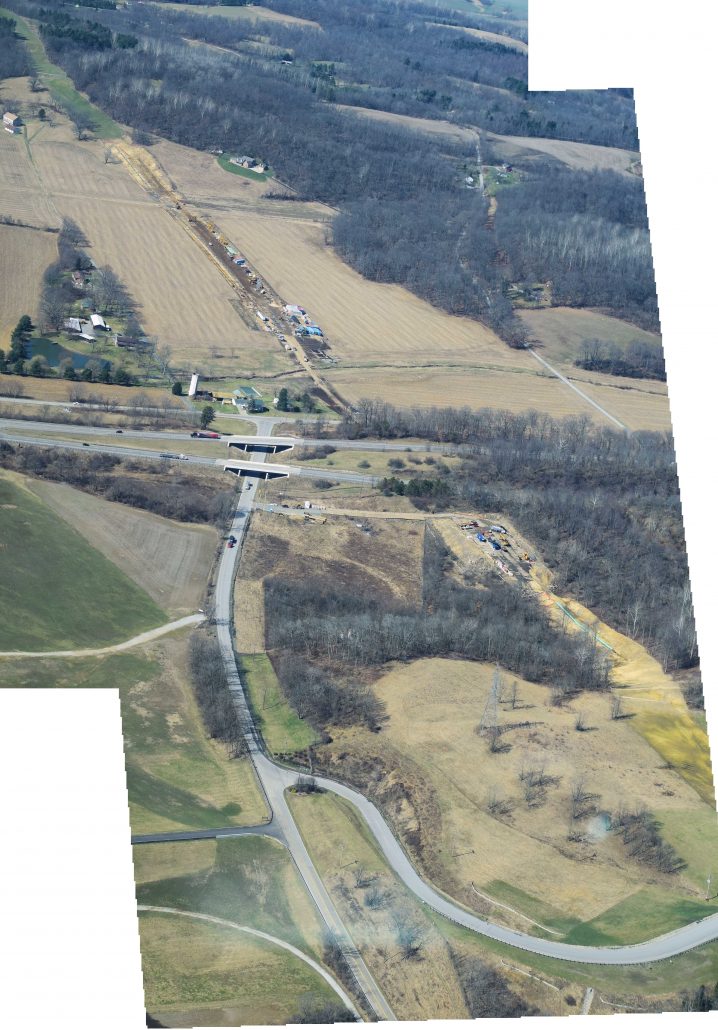
West Virginia Panhandle & Southeastern Ohio
January 26, 2018
On the morning of January 26th, I woke up on the west side of Cleveland thinking there was very little chance we were going to get up in the air for our flight with SouthWings’ pilot Dave Warner due to inclement weather. There was a part of me that was optimistic, however, so I decided to make the three hour drive down to the Marshall County Airport (KMPG) in Moundsville, West Virginia from Cleveland in the hopes that the “cold rain and snow” we’d been receiving was purely lake effect stuff and the West Virginia panhandle had not been in the path of the same cold front.
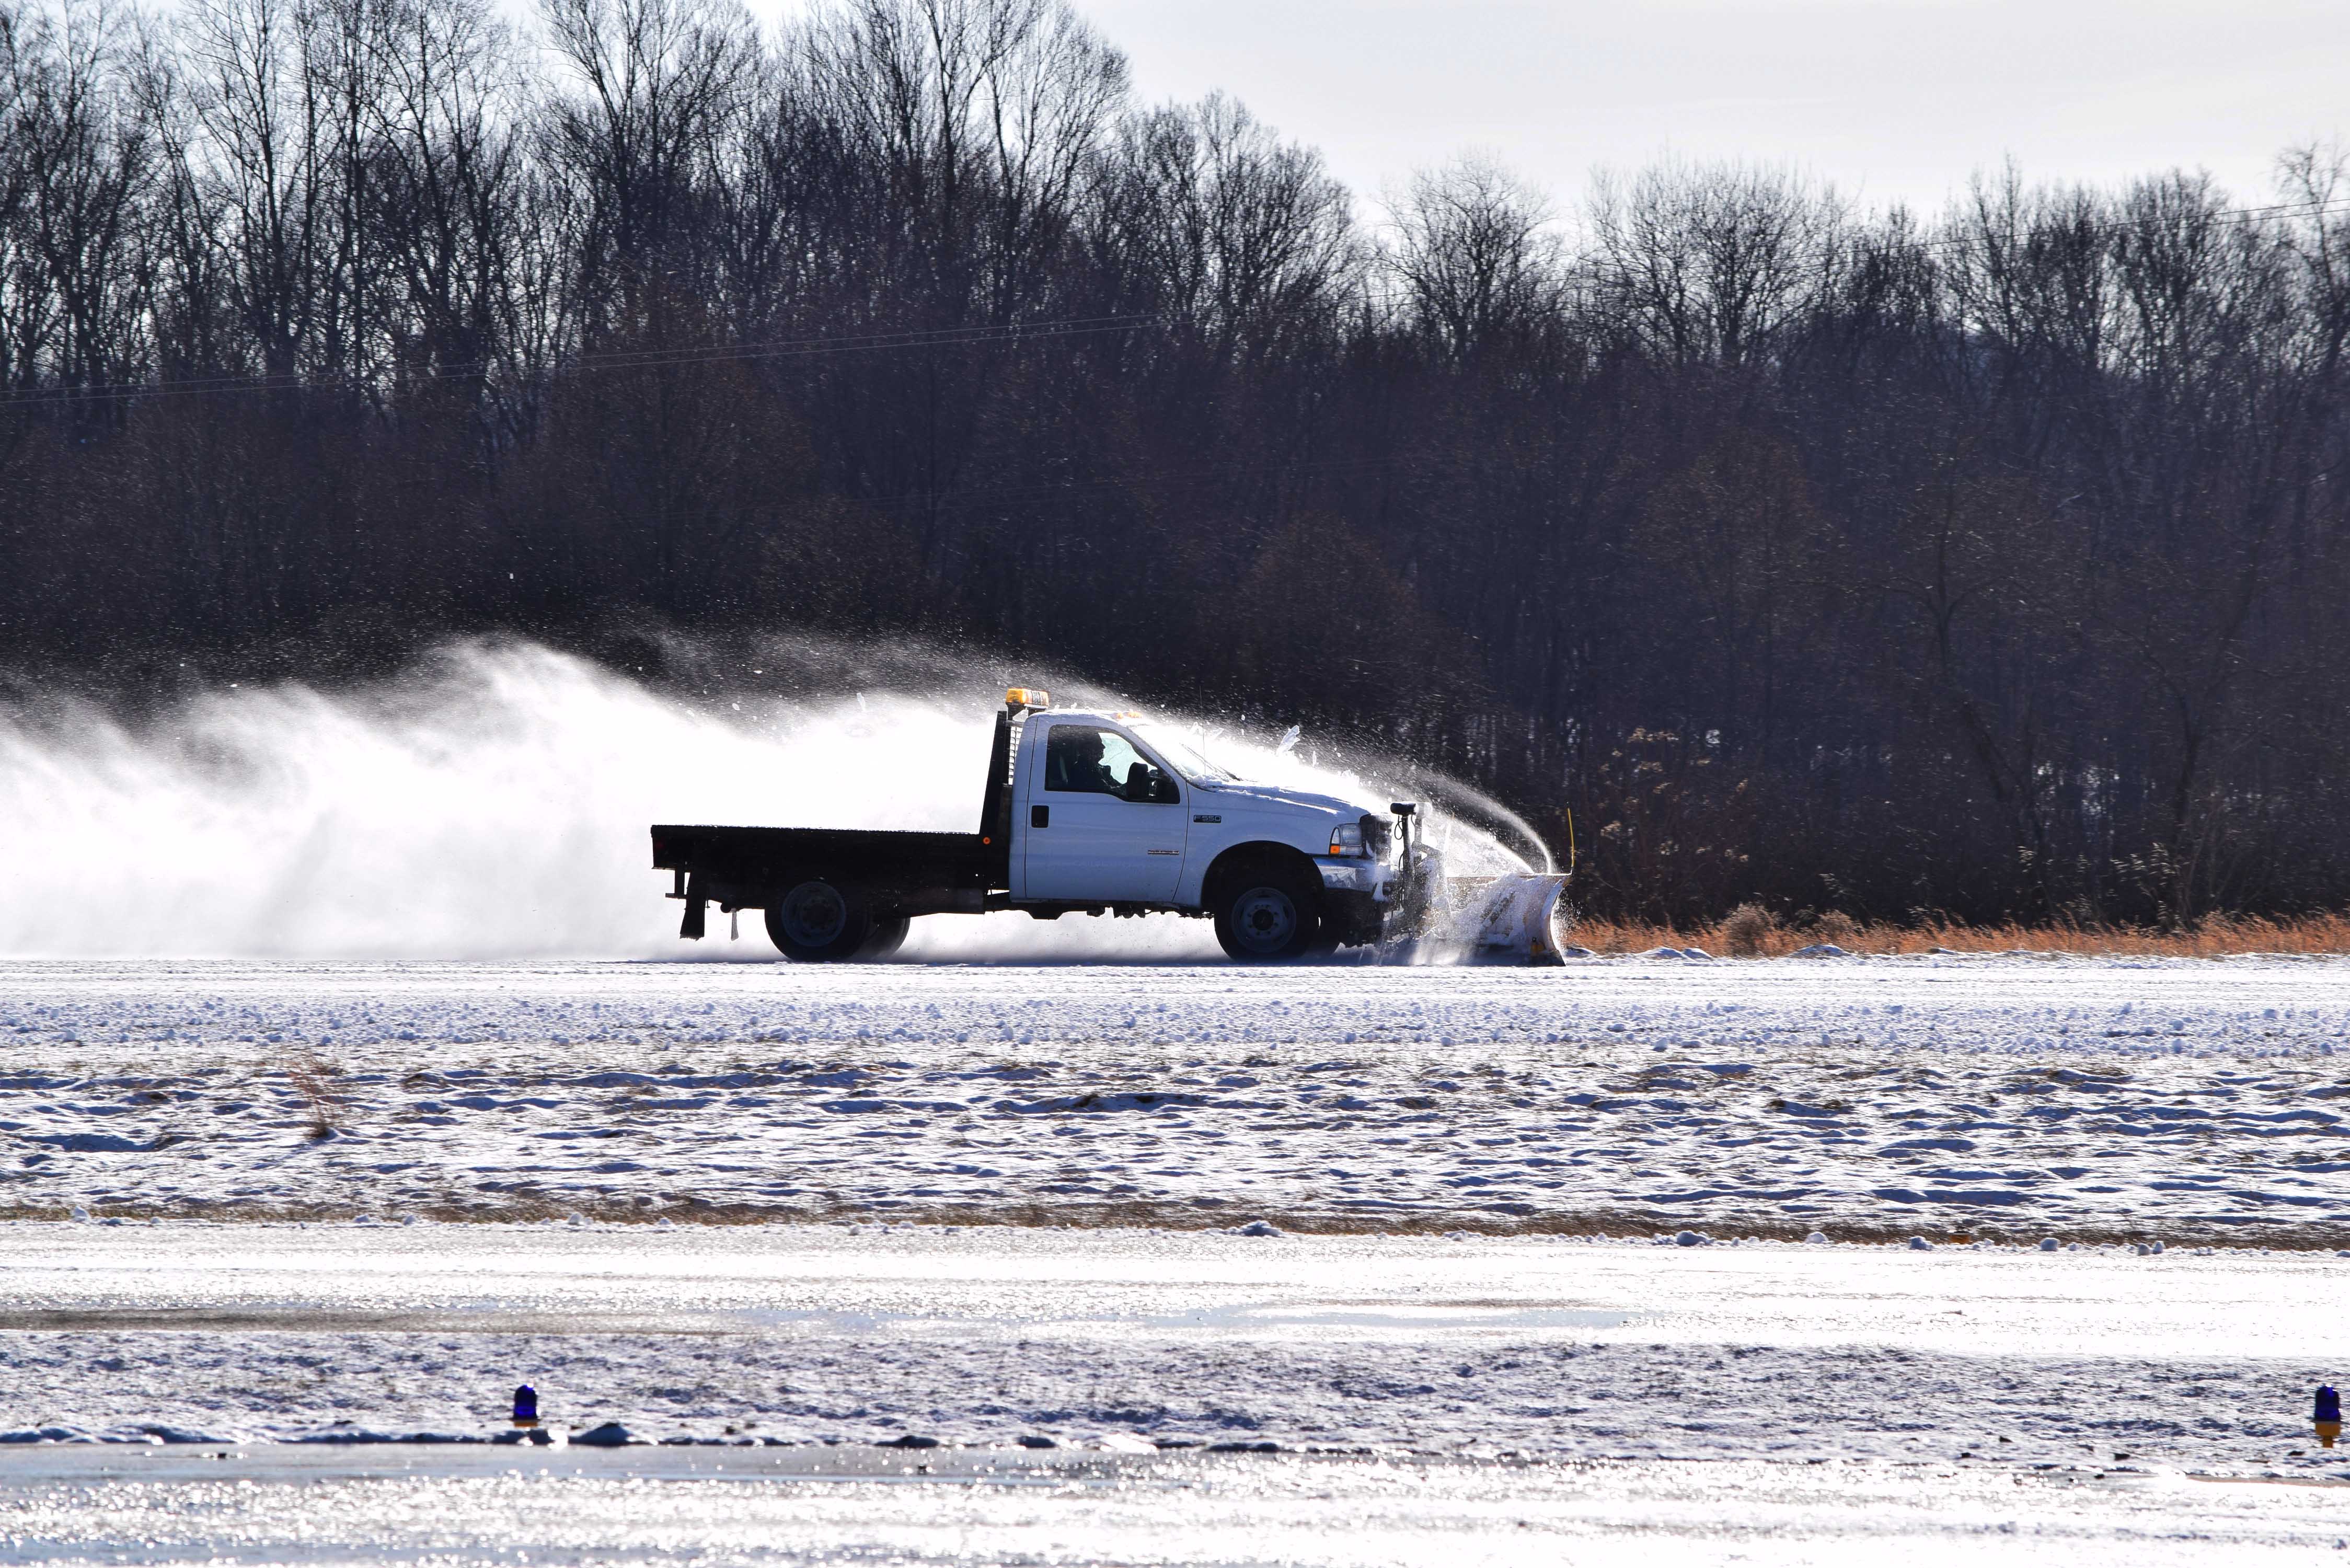
Marshall County, West Virginia Airport (KMPG) staff clearing the runway for our flight with SouthWings pilot Dave Warner, 1/26/2018
Unfortunately, when I arrived at the Moundsville airport I was wrong, and the runway was pretty slick around 8:00 a.m. However, the airport’s staff worked diligently to de-ice and plow the runway and by the time Dave Warner arrived from southern West Virginia conditions were ideal. The goal of this flight was two-fold:
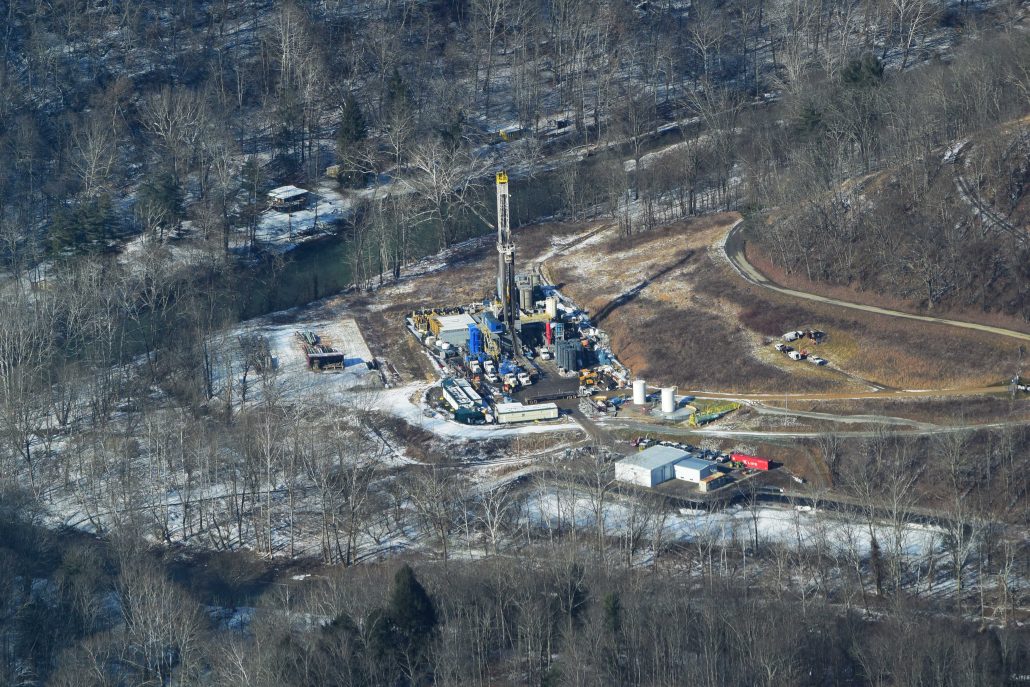
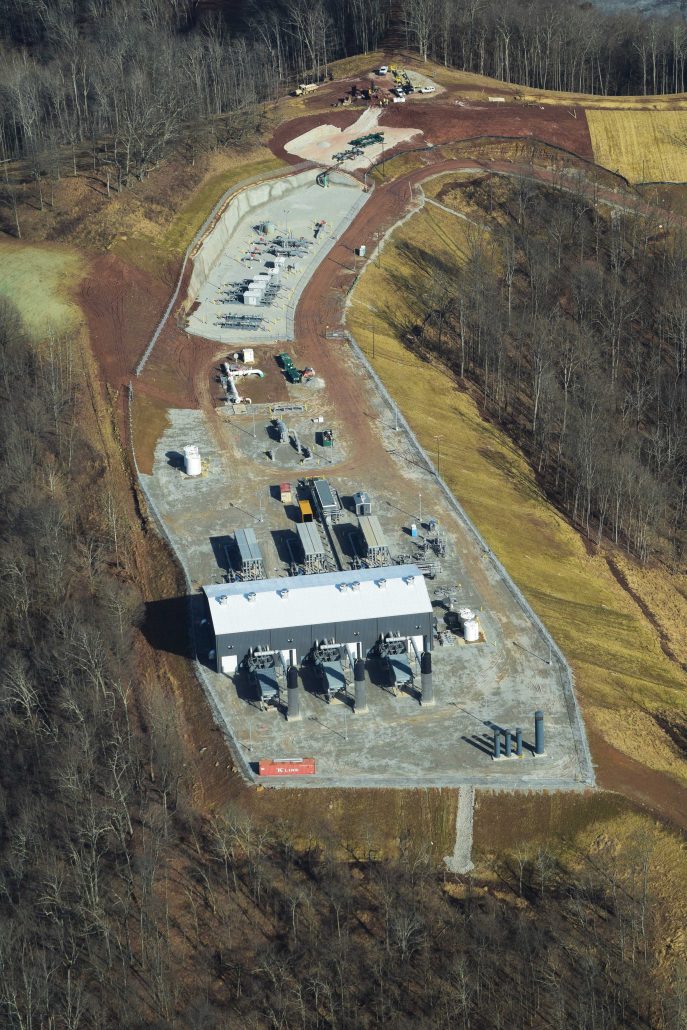
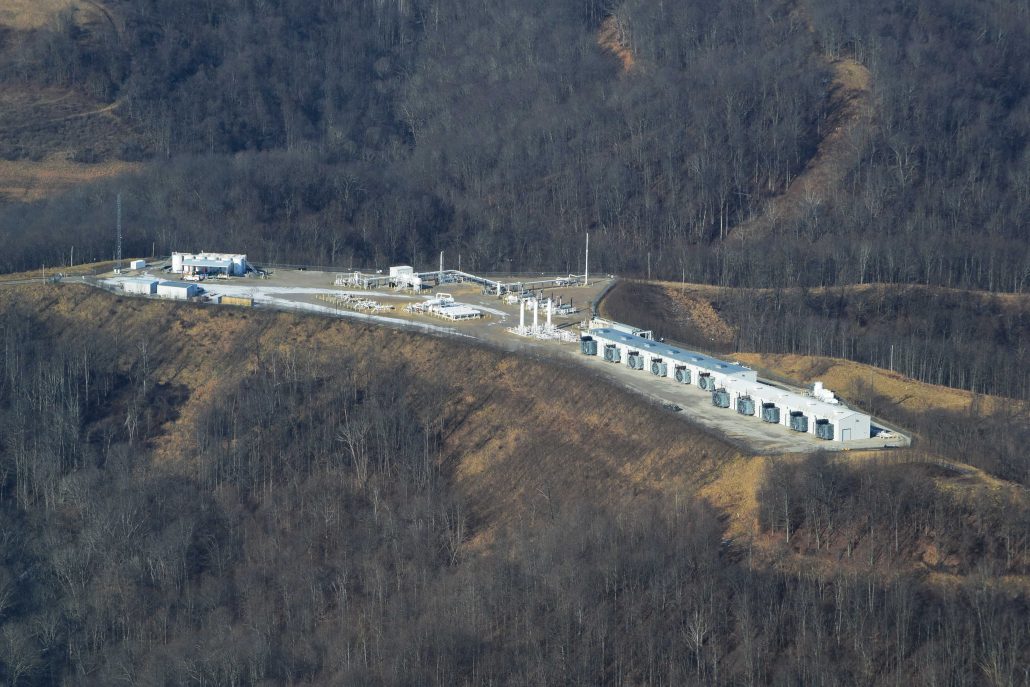
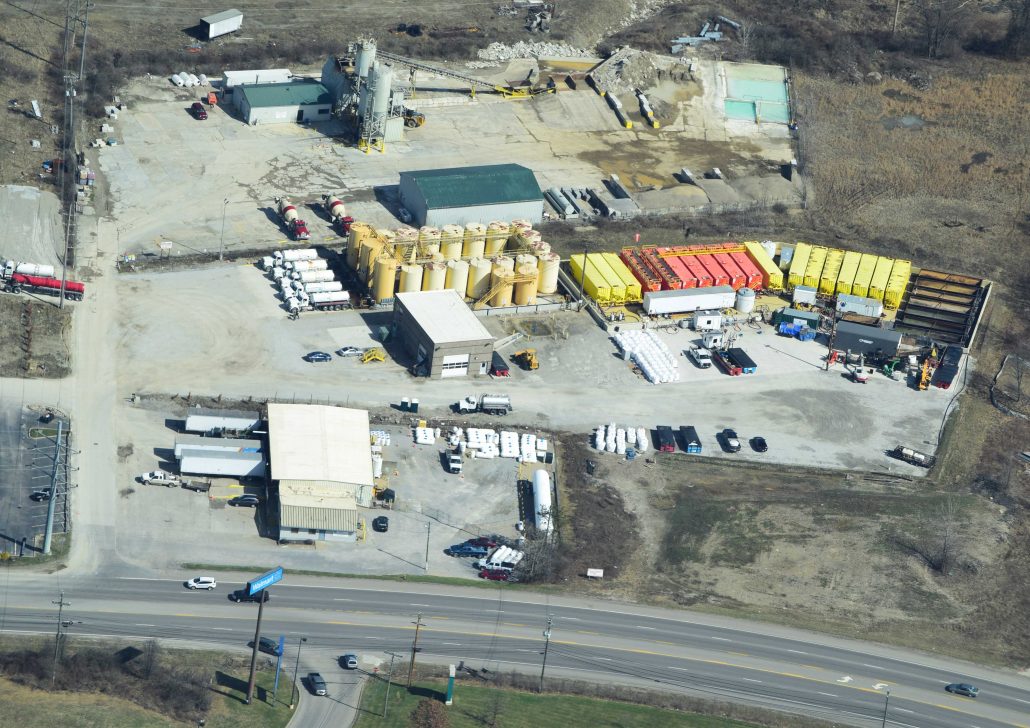
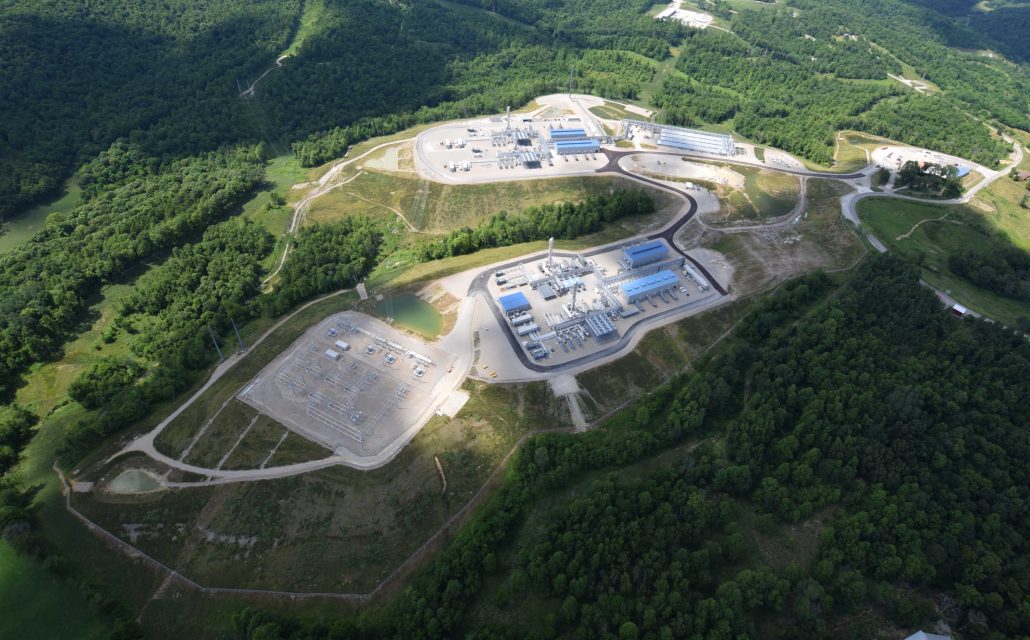
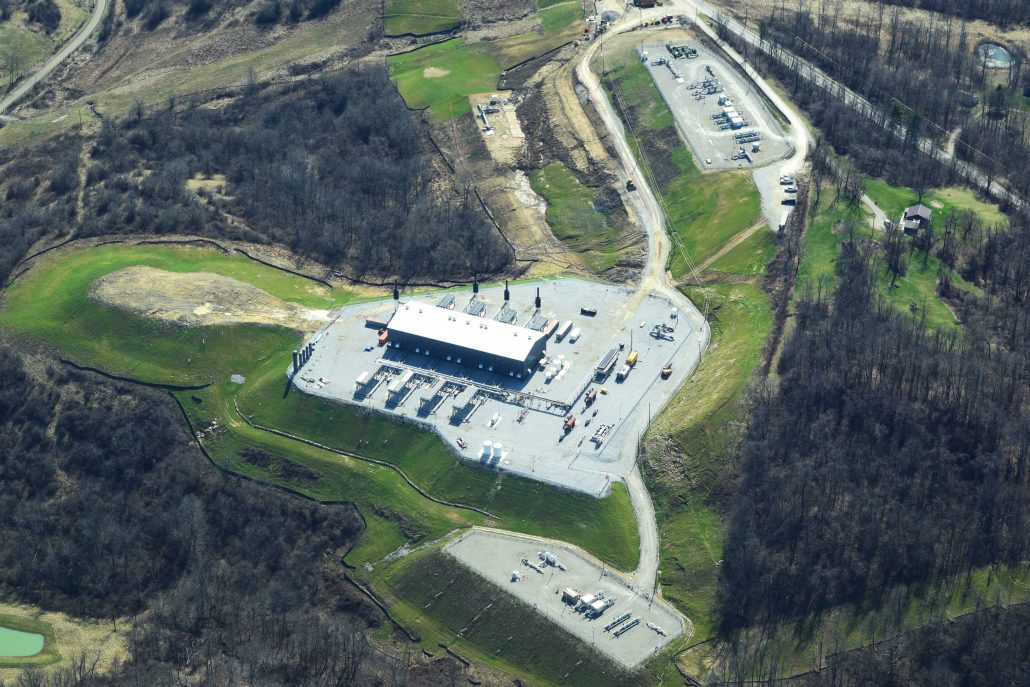
Photograph some of the large-scale high-volume hydraulic fracturing (HVHF) infrastructure in the West Virginia counties of Doddridge, Wetzel, and Marshall owned and operated by MarkWest, and
Allegheny Front’s Julie Grant was doing a story on natural gas gathering pipeline’s impact on waterways, and more specifically the Hellbender Salamander (Cryptobranchus alleganiensis). She was looking to see the impacted landscape from the air.
Both of these goals were achieved efficiently and safely, with the resulting Allegheny Front piece receiving significant interest across multiple public radio and television platforms including PRI’s Living On Earth.
Explore details from our WV / OH tour by clicking on the images below:
On my return drive home that afternoon the one new thing that really resonated with me was the fact that hydraulic fracturing or fracking has come to be defined by 4-5 acre well pads across Appalachian, Texas, Oklahoma, and North Dakota. This is a myth, however, expertly perpetuated by the oil and gas industry and their talking shops. Fracking’s extreme volatility and quick declines in rates of return necessitate that this latest fossil fuel iteration install large pieces of infrastructure like compressor stations and cracking facilities. This all is to ensure timely movement of product from supply to demand and to optimize the “value added” products the global markets demand and plastics industry uses as their primary feedstocks. This large infrastructure was never mentioned at the outset of the shale revolution, and I would imagine if it had been there would be far more resistance.
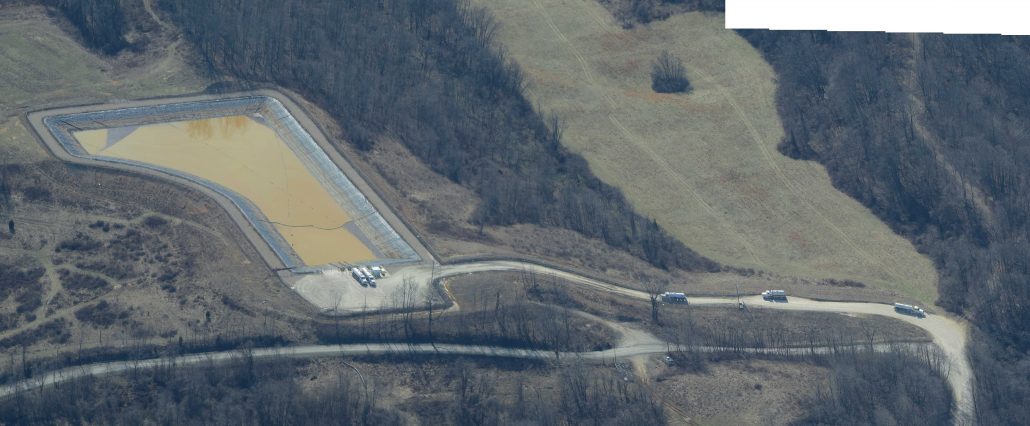
The one old thing the trip reinforced was the omnipresence and sinuosity of natural gas gathering lines across extremely steep and forested Appalachian geographies. How these pipelines will hold up and what their hasty construction is doing to terrestrial and aquatic wildlife, not to mention humanity, is anyone’s guess; the data is just so darn bad.
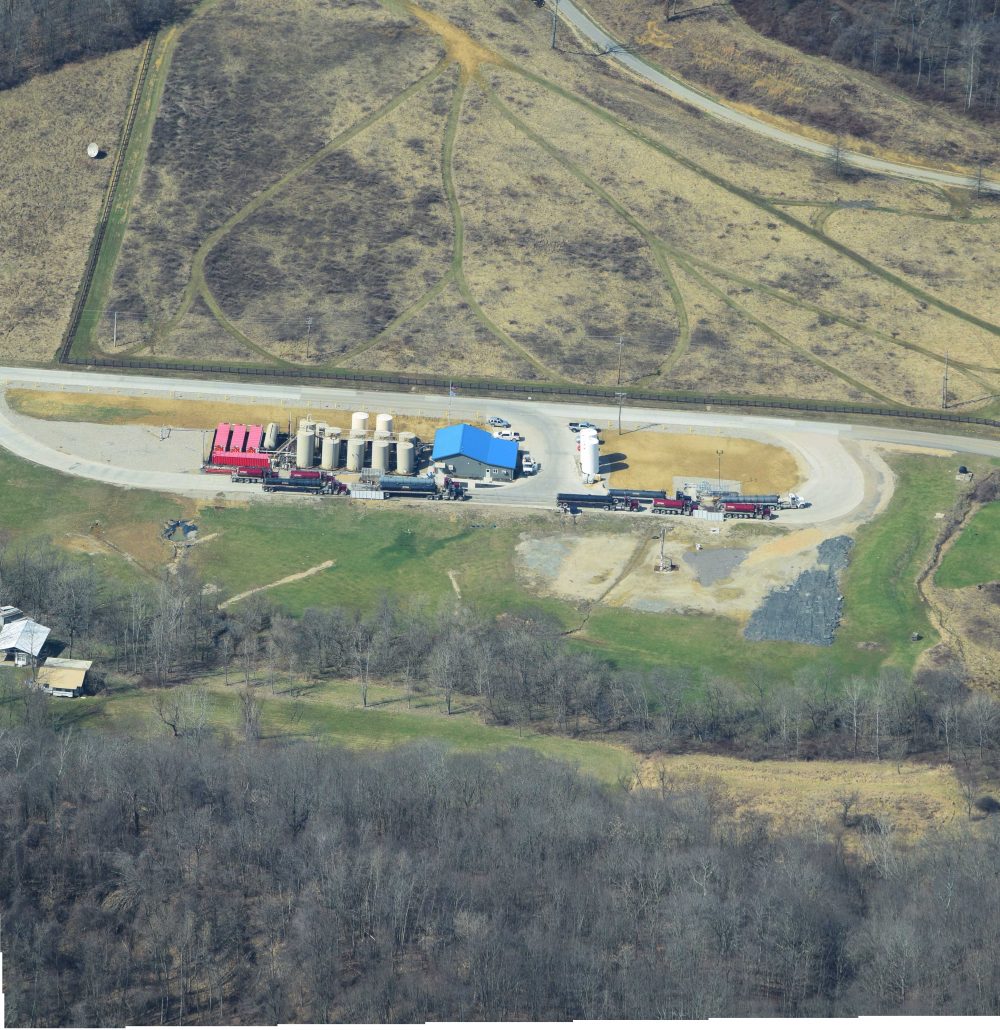
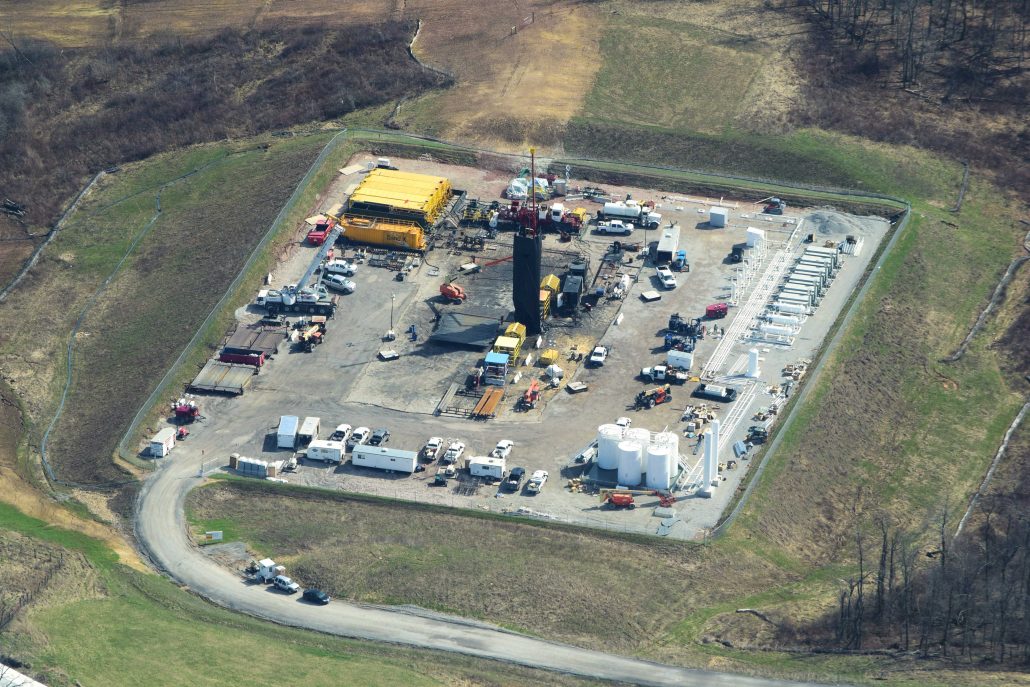
Southeastern Ohio
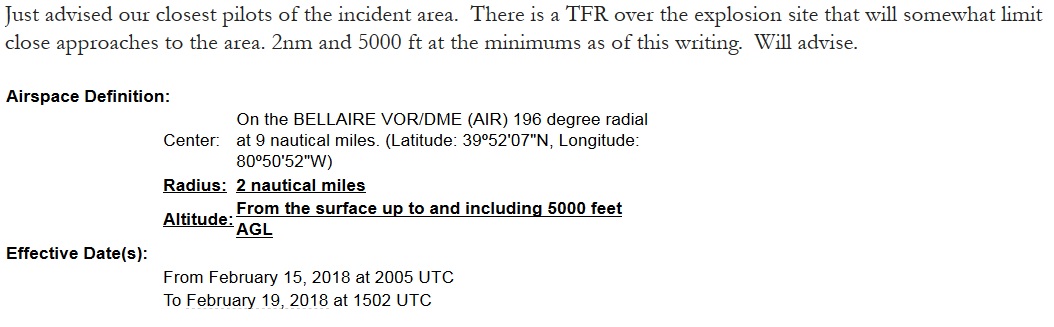
March 5, 2018 – aka, The XTO Powhatan Point Well Pad Explosion Flight
Around 9 a.m. on Thursday, February 15, 2018, an explosion occurred at XTO’s Schnegg frack pad “as the company worked to frack a fourth well” in Powhatan Point, Belmont County, Ohio. Shortly thereafter, a two-mile Temporary Flight Restriction (TFR) was enacted by the Federal Aviation Administration (FAA) around the incident’s location. The TFR was supposed to lapse during the afternoon of March 5, however, due to complications at the site the TFR was extended to the evening of March 8.
We were antsy to see what we could see, so we caught an emergency flight with Dave Warner, only this time under the LightHawk umbrella. We left on the morning of March 5th out of the all too familiar[1]Carroll County-Tolson Airport (KTSO). Although we couldn’t get close to the site, there was a holler valley to the northwest of the pad that allowed us to capture a photo of the ongoing releases. Additionally, within several weeks we obtained by FOIA the raw Ohio State Trooper monitoring footage from their helicopter and posted this footage to our YouTube channel, where it has received 4,787 views since March 19, 2018. This type of web traffic is atypical for anything that doesn’t include kittens, the Kardashians, or the Kardashians’ kittens.
Explore details from our Southeastern Ohio tour by clicking on the images below:
Much like our flight in January the most salient points I got out of Dave’s plane thinking about were:
Astonishment regarding the number of gas gathering lines and the fact that they seem to have been installed with very little-to-no reclamation forethought. They are also installed during a time of year when – even if hydroseed is applied – it won’t grow, leaving plenty of chances for predictable spring rains to cause major problems for streams and creeks, and
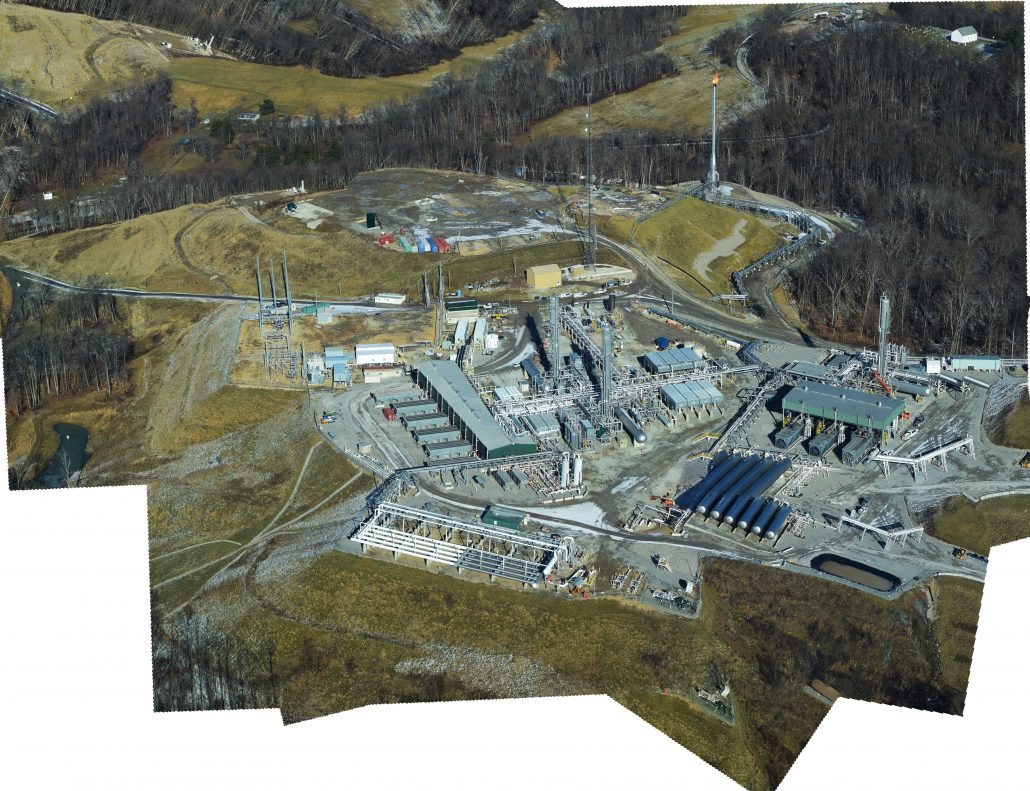
It is a big plant, a very big plant and far bigger than other plants around here… What’s really amazing that we got it up and running in six months. No one believed that we could do that. – Momentum Midstream spokesman Eric Mize discussing their natural gas liquids-separating complex in Scio, Ohio.
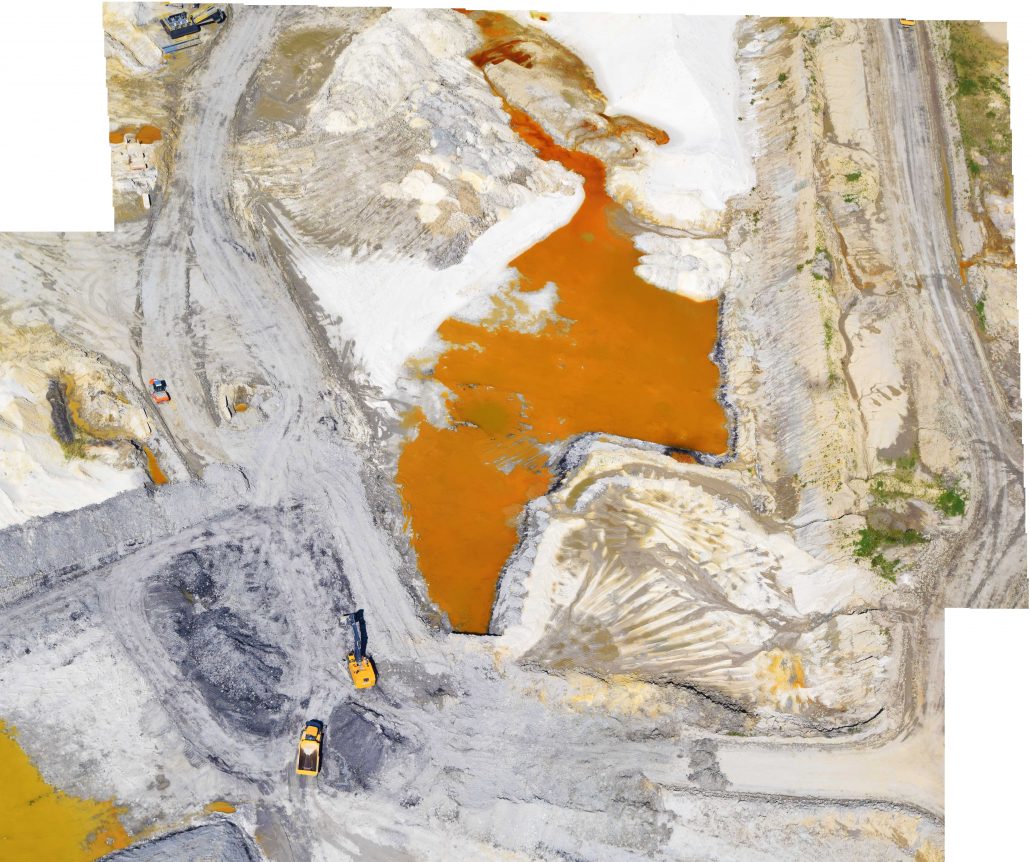
LaSalle County, Illinois
May 24 & 26, 2018
Frac Sand Mines and The Nature Conservancy’s Nachusa Grasslands Buffalo Herd, Franklin Grove, Illinois
Fast forward to the week of May 21st of this year, and I was back in the frac sand capital to interview several folks that live near these mines or have been advocating for a more responsible industry. I conducted a “morning flight” with several journalists and county officials from neighboring Ottawa County.
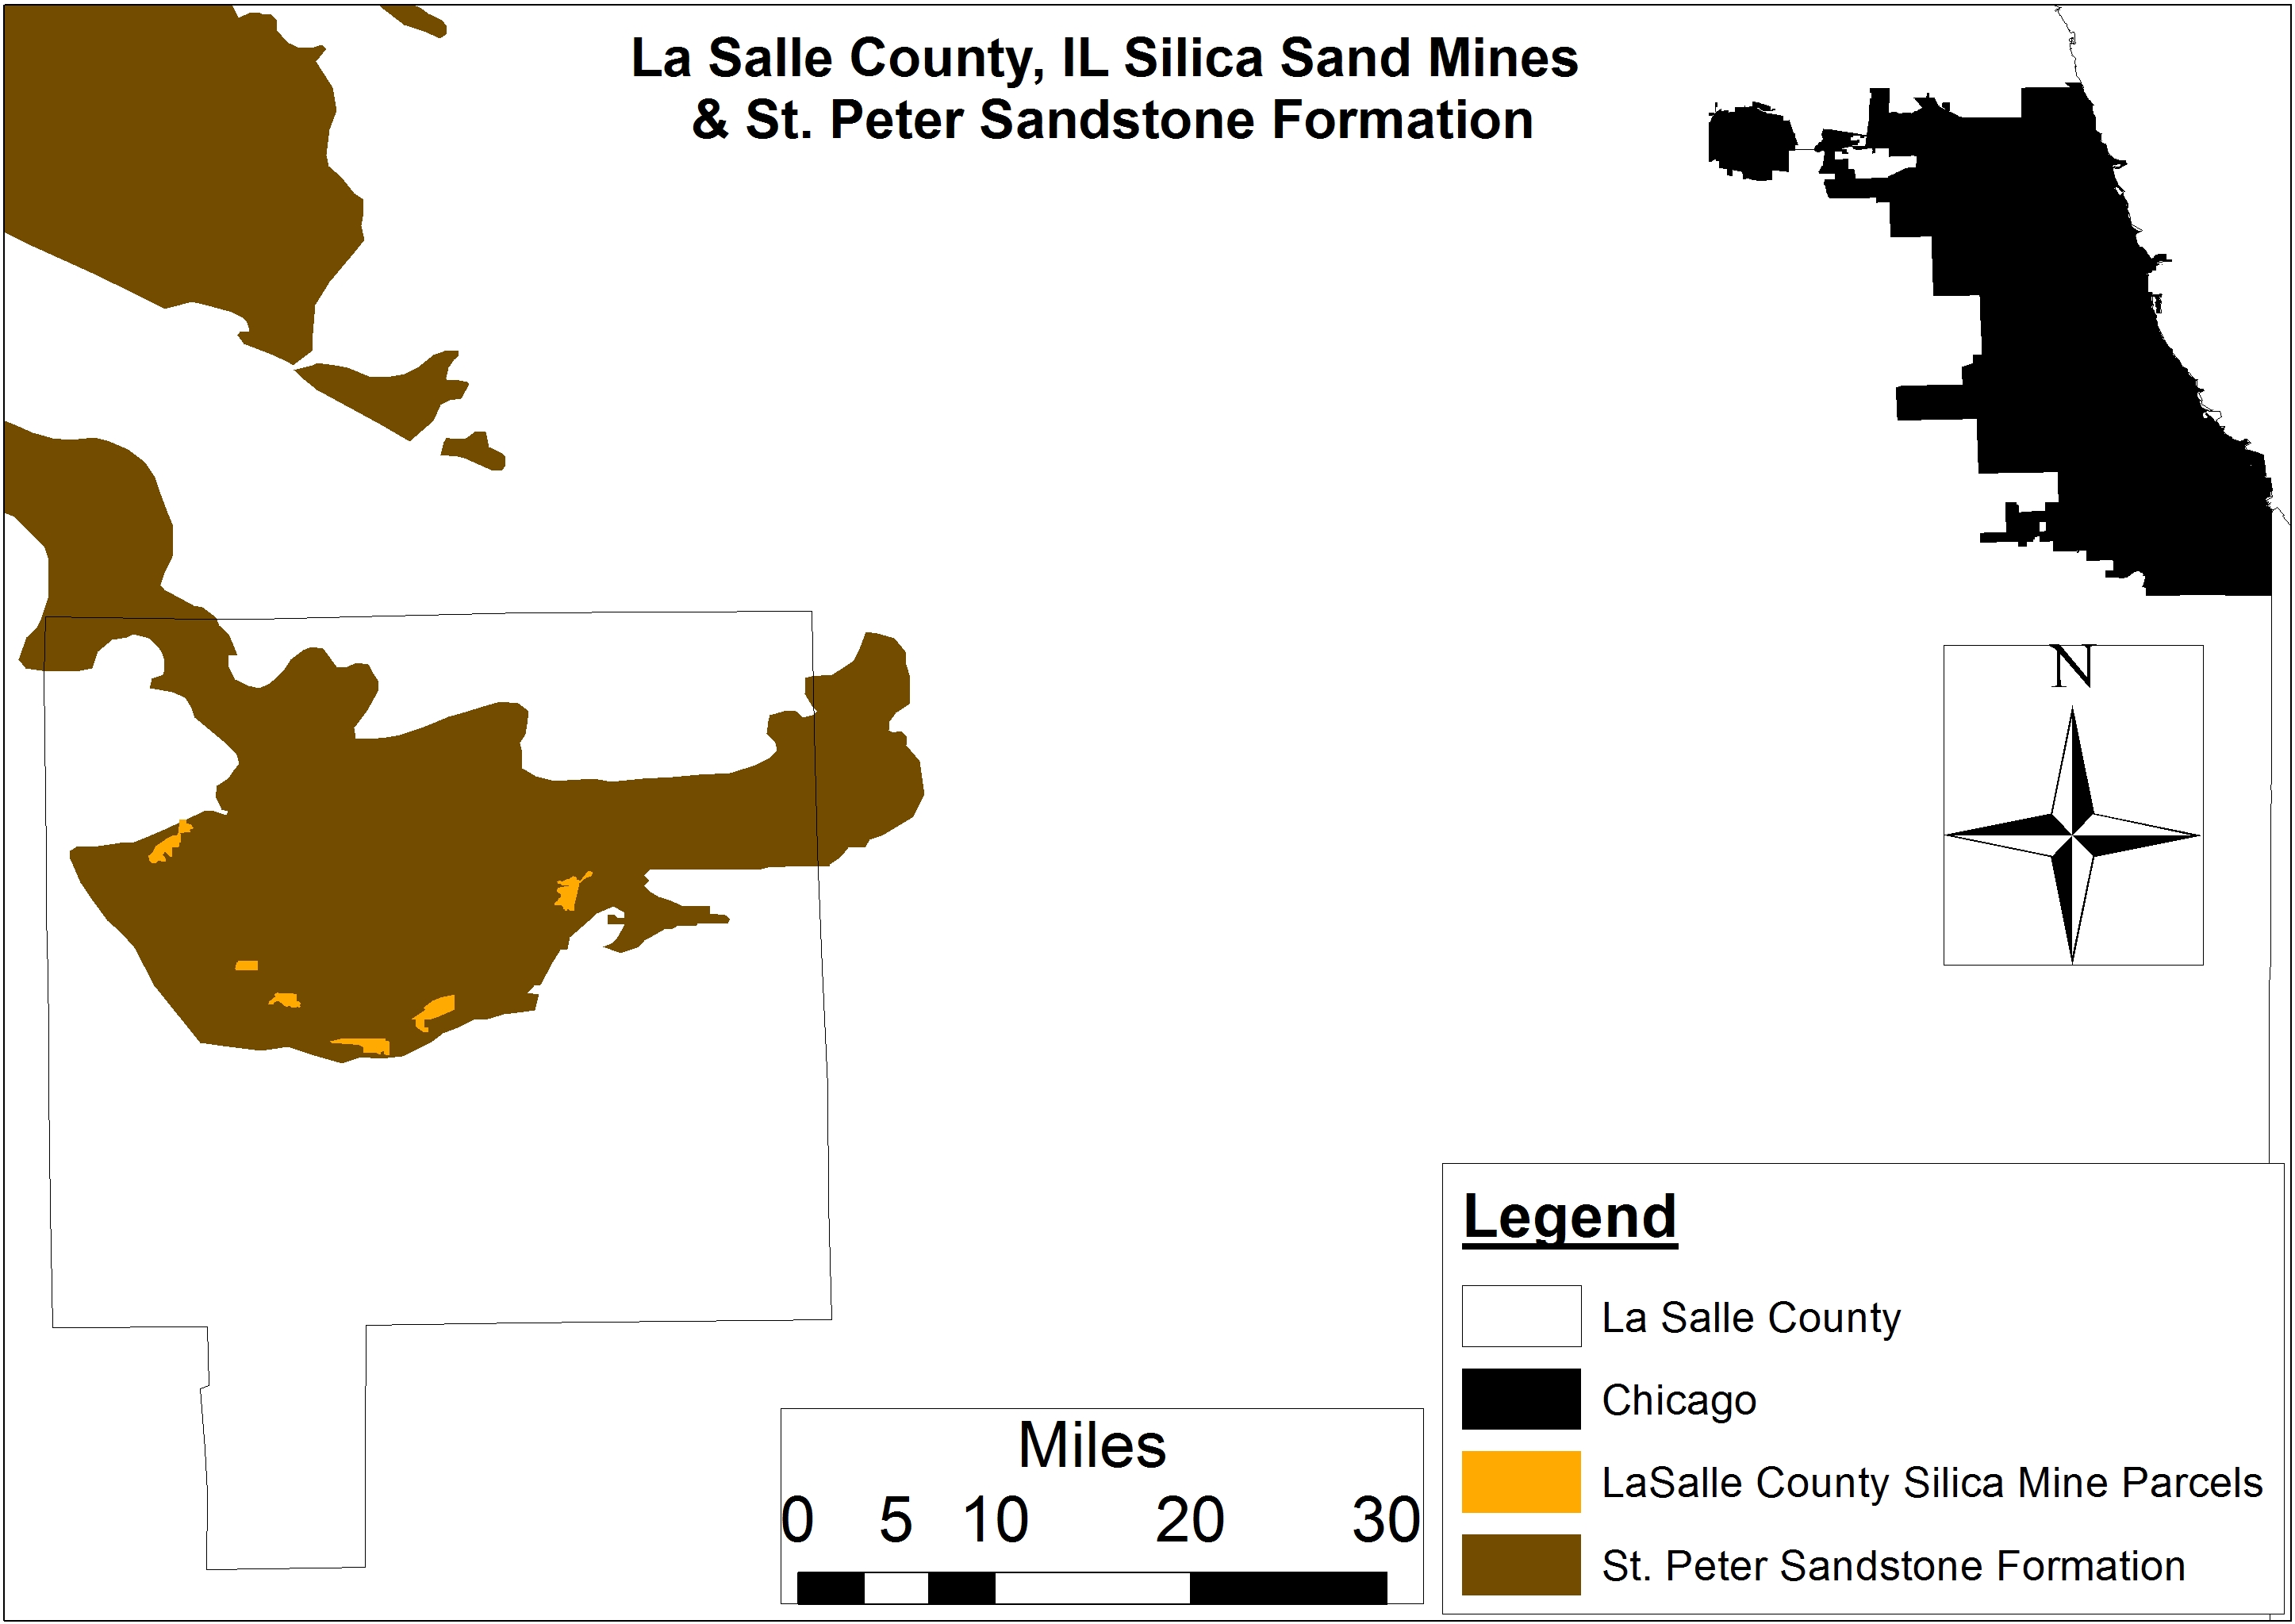
LaSalle County is an extremely interesting case study for anyone even remotely interested in the food, energy, and water (FEW) conversation that has begun to receive significant attention in the age of the “Shale Revolution.” (Such focus is largely thanks to the extreme amounts of water required during the fracking process.) While LaSalle County has never experienced even a single HVHF permit, it is home to much of the prized silica or “proppant” the HVHF industry prizes. La Salle receives this recognition due to its location above one of the finest sources of silica sand: the St. Peter Sandstone formation. This situation has prompted a significant expansion in the permitting of new silica sand mines and expansion of existing mines throughout the county – from small townships like North Utica and Oglesby to Troy Grove 7 miles north on East 8th Road.
Meanwhile, LaSalle County is home to some of the most productive soils in the United States, due largely to the carbon sequestration capabilities of the tallgrass prairies that once dominated the region. In any given year, the county ranks in the top 5 nationally based on the amount of soybean and corn produced on a per-acre basis. According to an analysis of the most recent USDA agricultural census, total agricultural value in LaSalle County exceeds $175 million or seven times the national average by county of roughly $23 million.
Needless to say, the short-term extraction of silica sands in the name of “energy independence” stands to have a profound impact on long-term “food security” in the U.S. and worldwide. Sadly, this conflict is similar to the one facing the aforementioned West Central Wisconsin, home to similarly productive soils. The cows that feed on the forage those soils produce some of the highest quality dairy anywhere. (As an aside: both regions are facing the realities of their disproportionate support for Donald Trump and the effects his trade war will have on their economies.)
… vertical walls of moss-covered stone formed by glacial meltwater that slice dramatically through tree-covered sandstone bluffs. More than 13 miles of trails allow access to waterfalls, fed season runoff or natural springs, sandstone overhangs, and spectacular overlooks. Lush vegetation supports abundant wildlife, while oak, cedar and pine grow on drier, sandy bluff tops. – IL DNR
Starved Rock receives more than 2.5 million visitors annually, which is the most of any Illinois state park. However, it is completely surrounded by existing or proposed frac sand mines, including US Silica’s Covel Creek mine. US Silica even recently pitched an expansion to the doorstep of Starved Rock and future plans to nearly engulf the park’s perimeter. What such an expansion would do to the attractiveness of the park and its trickle down economic impact is debatable, but LaSalle County residents Paul Wheeler and photographer Michelle McCray took a stab at illustrating the value of the state park to residents for our audience back in August, 2016:
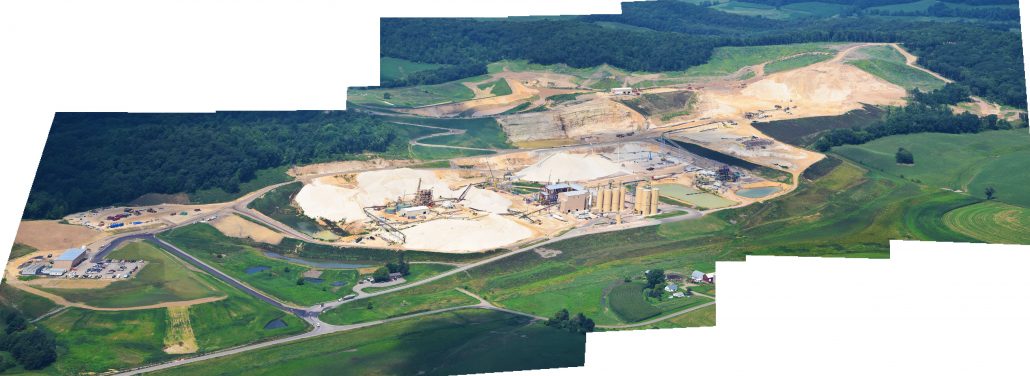
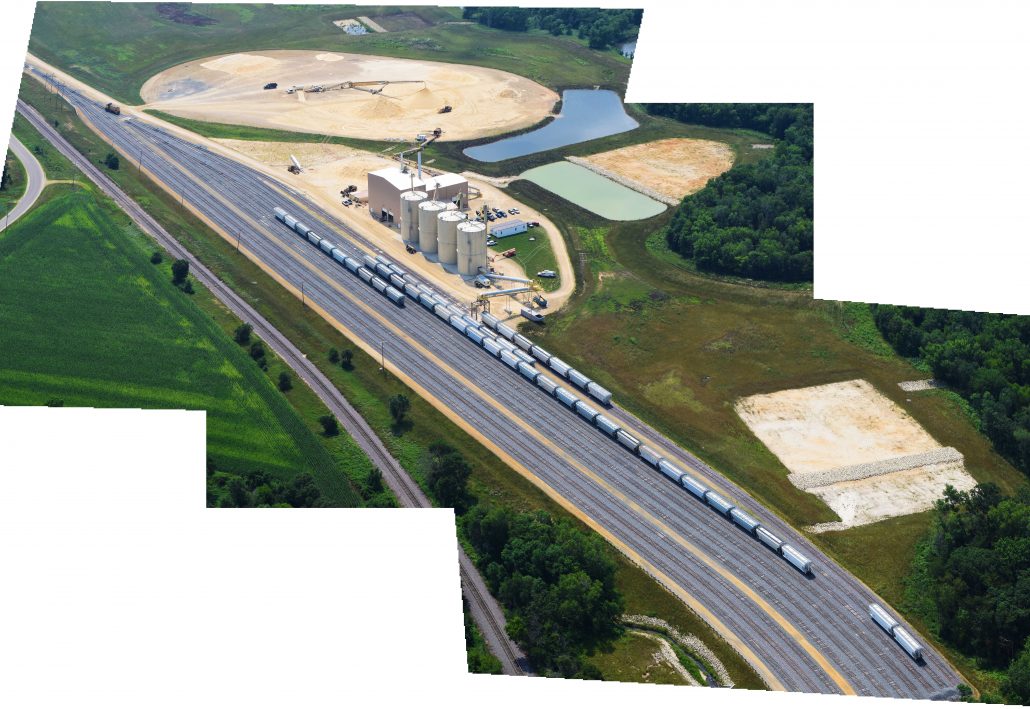
Our flight with LightHawk pilot and neighboring Mazon, Illinois retired farmer Doug Harford lifted off from Illinois Valley Regional Airport (KVYS) at around 9:00 a.m. local time on the morning of May 24th. We had perfect conditions for taking photos, with no clouds and a comfortable 70-75°F for the duration of a two-hour flight. We covered nearly 200 square miles and ten existing, abandoned, or permitted frac sand mines.
Explore details from our Illinois tour by clicking on the images below:
All passengers were struck by how large these mines were and how much several of the mines had expanded since the last time we all flew over them in June of 2016. The mines that had experienced the greatest rates of expansion were US Silica’s LaSalle Voss mine along Interstate 80 and the aforementioned Illinois River mine along with Fairmount Mineral’s major expansion, both in terms of infrastructure and actual mine footprint, in Wedron along the Fox River.
Figure 3. A map of the LaSalle County frac sand mines and associated St. Peter sandstone formation, along with the city of Chicago for some geographic perspective.
Most of this expansion is due to three critical distinguishing characteristics about the industry in LaSalle County:
The processing and export infrastructure (i.e., east-west rail) is in place and allows for mining to take place at times when other sand mining regions are mothballed,
Due to the large aggregation of parcels for farming purposes, companies can lease or outright purchase large amounts of land from relatively few landowners, and
Only the largest firms are active in the region, and with economies of scale they are not subject to the same types of shocks that smaller firms are when the price of oil collapses (like it did between June 2015 and February 2016). This means that the conflict will only be amplified in the coming months and years as the frac sand mining industry looks to supersede agriculture as LaSalle County’s primary economic driver.
However, all is not lost in North Central Illinois. This hope was stoked during our sojourn – and my subsequent trip in person – up to see The Nature Conservancy’s 3,600 acre preserve in Franklin Grove on the border of Lee and Ogle counties. As someone who is working hard to establish a small plot of prairie grasses and associated wildflowers at my home outside Cleveland, I was hoping to see what an established prairie looks like from the air. My primary goal, however, was to see what a healthy herd of native bison looks like.[2] The Nachusa bison are unique in that they came:
… from Wind Cave National Park in South Dakota and…Unlike most other American bison, animals from the Wind Cave herd have no history of cross-breeding with cattle. Bison from Wind Cave are the species’ most genetically pure and diverse specimens.
We were fortunate during our flight to have spotted the heard at the western edge of the preserve in what volunteer naturalist, Betty Higby, later told me the staff calls Oak Island. While I am not a person of faith, seeing these behemoths roaming freely and doing what 20-30 million of their ancestors used to do across much of North America moved me in a way I was not prepared for. I was immediately overwhelmed with a sense of awe and humility. How was I going to explain this beast’s former ubiquity and current novelty to my 5-year-old son, who shares a love of the North American Bison with me and would most certainly ask me what happened to this majestic creature?
Medina & Stark counties, Ohio NEXUS Pipeline flight
June 25, 2018
Ohio is currently home to 2,840 fracking permits, with 2,370 of these laterals having been drilled since September 2010. The growing concern around the fracking and petrochemicals conversation across much of the Midwest is the increasing number of FERC-permitted natural gas pipeline “proposals”[3] the industry is demanding it needs to maximize potential. Most residents in the path of these pipelines have strong objections to such development, citing the fact that imminent domain should not be invoked for corporate gain.
Much like all of the other patterns and processes we’ve documented and/or photographed at FracTracker, we felt that a flight over the latest FERC-approved pipeline – The NEXUS pipeline – would give us a better understanding of how this critical piece of infrastructure has altered the landscapes of Medina and Stark counties. Given the population density of these two northeastern Ohio counties, we also wanted to document the pipeline’s pathway with respect to urban and suburban centers.
Our flight on June 25th was delayed due to low clouds and last minute changes to the flight plan, but once we took off from Wadsworth Municipal Airport (3G3) with a local flight instructor it was clear that NEXUS is a pipeline that navigates a sinuous path in cities and townships like Green, Medina, Rittman, and Seville – coming dangerously close to thousands of homes and farms, as well as many schools and medical facilities.
Explore details from our NEXUS Pipeline tour by clicking on the images below:
Will this be the last FERC-approved pipeline to transverse Ohio in the name of “energy independence”? Will this pipeline and its brethren with names like the Utopia and ET Rover be monitored in real-time? If not, why? It is unfortunate, to say the least, that we so flippantly assume these pipelines are innocuous given their proximity to so many Ohioans. And, as if to add insult to injury, imminent domain is invoked. All this for a piece of oil and gas infrastructure that will profit companies on the global market, with only a fraction of the revenue returning to affected communities.
What’s Next?
I don’t know of a better way to understand the magnitude of these pipelines than flying over them at 1,000-1,500 feet, and I will continue to monitor and photograph oil and gas developments from the air with the assistance of amazing pilots like those affiliated with LightHawk and SouthWings.
To this end, I will be returning to West Central Wisconsin for yet another “morning flight” with the aforementioned La Crosse-area pilot and lawyer Tim Jacobson and frequent collaborator University of Wisconsin-Stout professor Tom Pearson.[4] Our flight plan will return us to the northern Wisconsin frac sand counties of Chippewa, Barron, Dunn, Eau Claire, and if we have time we’ll revisit the mines we photographed in August of last year. We’ve been told by Susan Bence, an environmental reporter out of Milwaukee Public Radio, that she is trying to convince the powers that be at NPR in Washington, DC that this is a story the entire country should hear about. Wish us luck!
Flyover Partners
By Ted Auch, Great Lakes Program Coordinator
Bird’s-Eye-View Endnotes
The first of my morning fracking flights was out of this airport back in June, 2012 along with the other passenger on this flight Paul Feezel of Carroll Concerned Citizens and David Beach of the Cleveland Museum of Natural History’s Green City Blue Lakes program.
The Conservancy initially brought at least 30 bison of different ages and genders to Nachusa. The bison graze on approximately 1,500 acres of the prairie and the site currently supports more than 120 bison according to site volunteer naturalist Betty Higby.
I put quotes around this word because in my travels across Ohio interviewing those in the path of these transmission pipelines it is clear that this is not the correct word because ‘proposals’ implies that these pipelines might not happen or are up for debate. Yet, neither could be further from the truth with most folks indicating that it was very clear very early in their interactions with FERC and the pipeline companies that there was never a chance that these pipelines were not going to happen with “imminent domain for private gain” being the common thread throughout my conversations.
Tom is the author of a recently published book on the topic “When the Hills Are Gone.”
https://www.fractracker.org/a5ej20sjfwe/wp-content/uploads/2018/07/Sand-Flyover-Feature.jpg400900Ted Auch, PhDhttps://www.fractracker.org/a5ej20sjfwe/wp-content/uploads/2021/04/2021-FracTracker-logo-horizontal.pngTed Auch, PhD2018-08-08 10:31:522021-04-15 14:57:41Documenting Fracking Impacts: A Yearlong Tour from a Bird’s-Eye-View


