Wisconsin’s Nonmetallic Mining Parcel Registration Program
How the frac sand industry is circumventing local control, plus where the industry is migrating
What is nonmetallic mineral mining?
It was more than a year and half ago that anti-frac sand organizer – and movement matriarch – Pat Popple published a white paper by attorney Elizabeth Feil in her Frac Sand Sentinel newsletter. The paper outlined potential impacts of something the Wisconsin Department of Natural Resources (DNR) calls the “Marketable Nonmetallic Mineral Deposit Registration” (MNMDR) program.
The program, passed in 2000, is outlined in Wisconsin’s administrative code under Subchapter VI “Registration of Marketable Nonmetallic Mineral Deposits (NR 135.53-NR 135.64). This program allows landowners to register parcels that sit atop marketable nonmetallic mineral deposits, such as frac sand, according to a licensed professional geologist. The geologist uses “logs or records of drilling, boring, geophysical surveys, records of physical inspections of outcrops or equivalent scientific data” to outline the quality, extent, depth, accessibility, and current market value of the minerals.
If a mine operator is not the landowner, it must first coordinate registration with the landowner to:
… provide protection against present or future land uses, such as the erection of permanent structures, that would impede their development…to promote more orderly future development of identified nonmetallic mineral resources and minimize conflict among land uses.
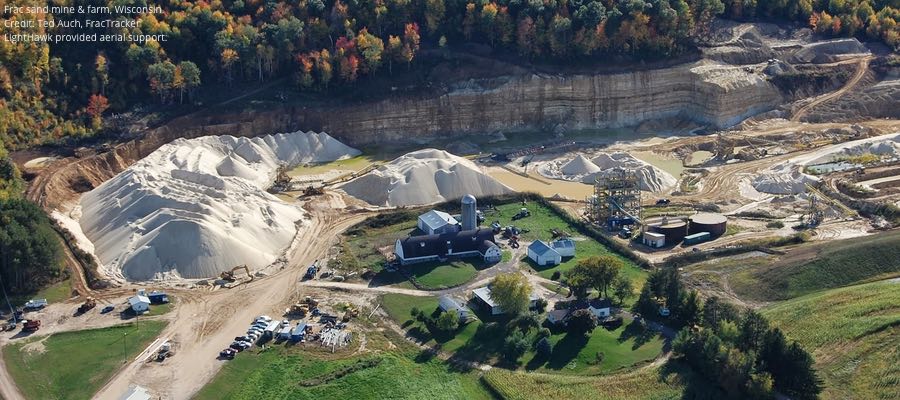
Where is frac sand mining occurring in Wisconsin?
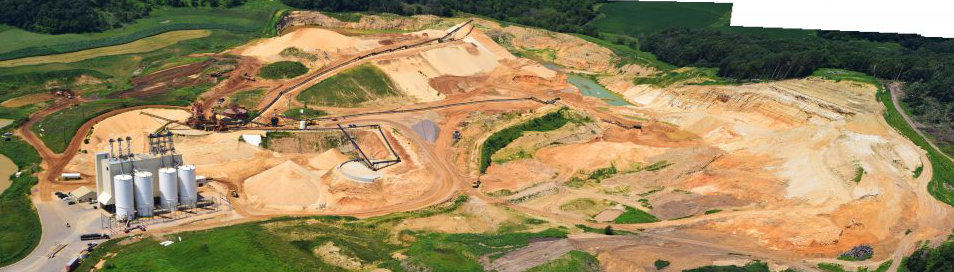
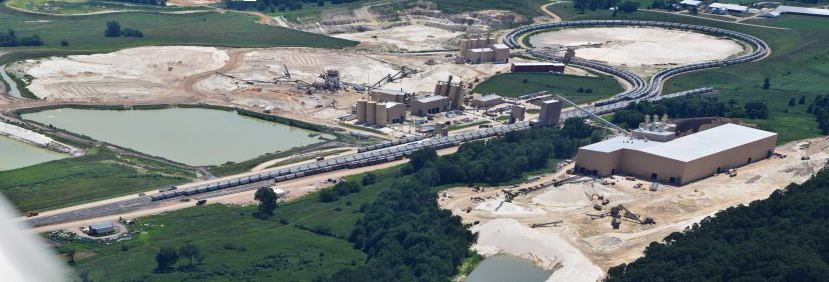
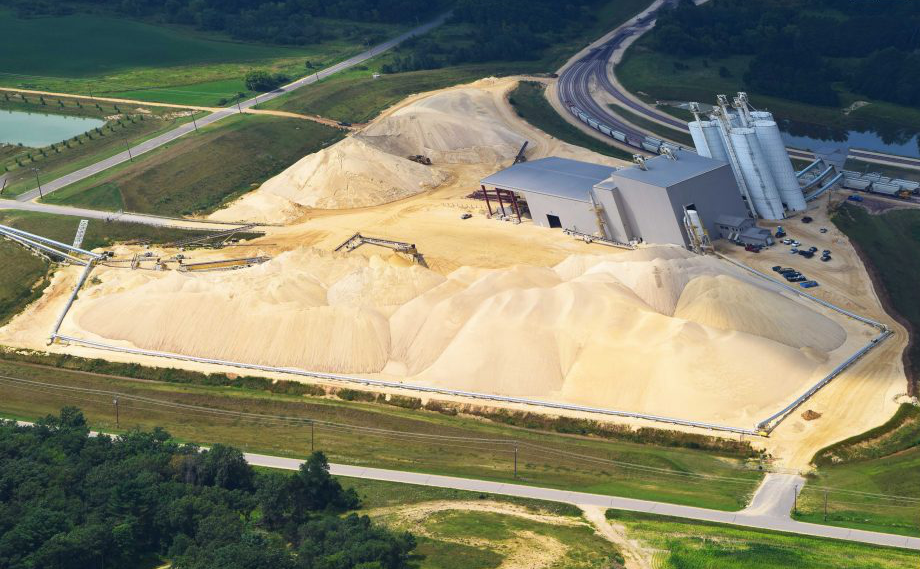
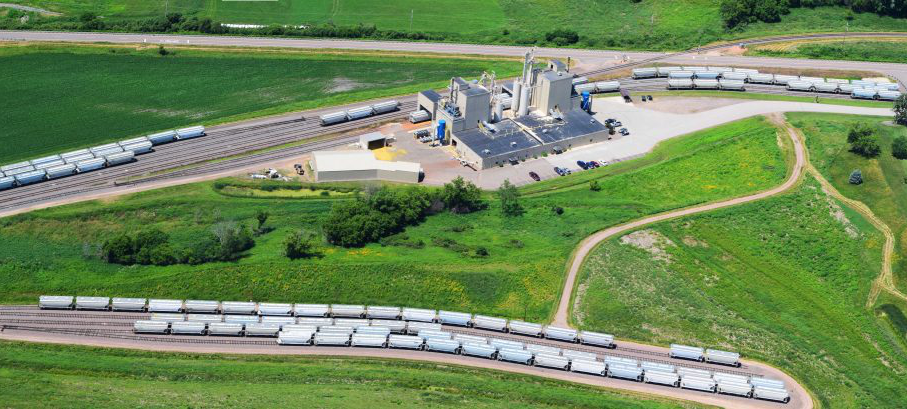

Photos by Ted Auch, Fractracker Alliance, and aerial support provided by LightHawk
Limitations of the registration program
The only requirement under this program is that the landowner “provide evidence that nonmetallic mining is a permitted or conditional use for the land under zoning in effect on the day in which notice is provided to the zoning authorities.” All registrations must be recorded in the county’s registrar of deeds 120 days before filing the registration. This process results in zoning authorities having a 60-day window to determine if they support or object to registrations in circuit courts.
Once counties are notified, they have no recourse for objection aside from proving that the deposit is not marketable or the parcel is not zoned for mining.
As Ms. Feil wrote, this program “preserves…[parcel] eligibility for nonmetallic mining in the future, even if a local governing body later passes new mining restrictions.” The former will have already been proven by the licensed geologist, and the latter is highly unlikely given lax or non-existent zoning in rural Wisconsin, where many land parcels are outside incorporated townships. Any parcel registered on this program remains in the program for a 10 year period and may be automatically re-registered under the initial geological assessment for another 10 year term “at least 10 days and no more than one year before registration expires.”
After this 20-year period, parcels start from scratch with respect to the registration process.
Initial inquiry and map methodology
As part of her white paper, Ms. Feil noted that in a quick check of her home county’s register of deeds, she found six nonmetallic mineral deposit registrations since 2000 in Trempealeau County and nine in neighboring Chippewa County. As a result of Ms. Feil’s initial inquiry, we decided it would be worth conducting a sweeping search for all nonmetallic parcel registrations in the nine most heavily frac sand-mined Wisconsin counties: Trempealeau, Barron, Crawford, Chippewa, Monroe, Jackson, Clark, Dunn, and Eau Claire.
“Wisconsin Nonmetallic Mineral Deposit Parcel Registrations and Likely Mine Parcels” Map
We were fortunate enough to receive funding from the Save The Hills Alliance (STHA) to conduct this research. We received “boots on the ground” assistance from the likes of Ms. Feil, Ms. Popple, and several other volunteers for acquiring hard copies of registrations as of the summer of 2018.
Our goal was to construct a map that would provide a predictive and dynamic tool for residents, activists, non-profits, researchers, local governments, and journalists to understand the future scale and scope of frac sand mining across West Central Wisconsin. We hope this will inspire a network of citizen scientists and mapping tools that can serve as a model for analogous efforts in Illinois, Minnesota, and Southeastern Michigan.
In addition to identifying parcels falling under Wisconsin DNR’s MNMDR registration program, we also used Wisconsin’s State Cartographer’s Office and Land Information Program “V4 Statewide Parcel Data” to extract all parcels:
- Currently owned by active or historically relevant frac sand mine operators and their subsidiaries,
- Owned by families or entities that have allowed for mining to occur on their property and/or have registered parcels under the MNMDR program, and,
- All cranberry production parcels in Wisconsin frac sand counties – namely Monroe, Jackson, Clark, Wood, and Eau Claire, with Monroe, Jackson, and Wood the state’s top producing counties by acreage.
The latter were included in the map because Wisconsin DNR identified the importance of cranberry bogs in their Silica Sand Mining in Wisconsin January 2012 report. The report defined the “Cranberry Exemption” as follows:
Some of the counties in central Wisconsin that are seeing an increase in frac sand mining are also home to much of the state’s cranberry farming. Mining sand is a routine practice in the process of raising cranberries. Growers use sand in the cranberry beds to provide adequate drainage for the roots of the cranberry plants. The sand prevents root rot and fosters plant growth. Chapter 94.26, Wis. Stats, was established in 1867 and exempts cranberry growers from much of the laws applying to waters of the state under Chapter 30, Wis. Stats. With this exemption in place cranberry growers can, in theory, mine sand wherever and however they desire for use in cranberry production. Some cranberry growers are taking advantage of the high demand for sand and are selling their sand on the frac sand market (emphasis added). However, the Department has recently determined that the exemption in Ch. 94.26, Wis. Stats., from portions of Chapters 30 and 31, Wis. Stats., for cranberry culture is not applicable to non-metallic mining sites where a NR 216, W is. Adm. Code, stormwater permit is required. For those non-metallic mining operations where the material is sold and hauled off site, Chapters 30 and 31, Wis. Stats., jurisdiction will be applied.
Finally, the last data layer we’ve included in this map speaks to the enormous volumes of subsurface water that the industrial sand mining industry has consumed since 2010. This layer includes monthly and annual water volume withdrawals by way of 137 industrial sand mine (i.e., IN 65) high capacity wells (Our thanks to Wisconsin DNR Water Supply Specialist – Bureau of Drinking Water and Groundwater’s Bob Smail for helping us to compile this data.)
We have coupled that data to annual tonnages in order to quantify gallons per ton ratios for several mines across several years.
Results
Below is the completed map of current and potential frac sand mines in West Central Wisconsin, as well as high capacity wells. Click on the features of the map for more details.
View Map Full Screen| How FracTracker maps work
We identified 4,049 nonmetallic parcel registration and existing sand mine operator parcels totaling 113,985 acres or 178 square miles spread across 14 counties in West Central Wisconsin (Table 1). The largest parcel sizes were U.S. Silica’s 398-acre parcel in Sparta, Monroe County and Badger Mining’s 330-acre parcel in St. Marie, Green Lake County. The average parcel is a mere 28 acres.
To put these figures in perspective, back in 2013 we quantified the full extent of land-use change associated with frac sand mining in this same region and found that the 75 active mines at the time occupied a total of 5,859 acres and averaged roughly 75 acres in size. This means that if current parcel ownership and nonmetallic parcel registrations run their course, the impact of frac sand mining from a land-use perspective could potentially increase by 1,900%!
This is an astounding development and would alter large chunks of West Central Wisconsin’s working landscape, dairy industry, and “Badger State” mentality forever.
Table 1. Nonmetallic or operator-owned frac sand parcels and their total and average acreage in 14 West Central Wisconsin counties
| County | Number of Parcels | Total Acreage | Average Parcel Acreage |
| Barron | 267 | 8,737 | 33 |
| Buffalo | 211 | 5,902 | 28 |
| Burnett | 4 | 140 | 35 |
| Chippewa | 580 | 15,585 | 27 |
| Clark | 74 | 2,391 | 32 |
| Dunn | 73 | 2,245 | 31 |
| Eau Claire | 151 | 4,101 | 27 |
| Green Lake | 74 | 2,648 | 36 |
| Jackson | 1,128 | 36,152 | 32 |
| Monroe | 459 | 11,185 | 24 |
| Pierce | 168 | 3,415 | 20 |
| Rusk | 2 | 64 | 32 |
| Trempealeau | 787 | 19,375 | 25 |
| Wood | 71 | 2,044 | 29 |
As for the “Cranberry Exemption” identified by Wisconsin DNR, we identified an additional 3,090 cranberry operator or family-owned parcels totaling 98,217 acres or 153 square miles – nearly equal to the acreage identified above. Figure 1 shows the extent of cranberry bog parcels and frac sand mines in Monroe, Wood, and Jackson Counties. The two largest parcels in this inquiry were the 275-acre parcel owned by Fairview Cranberry in Monroe County and a 231 acre-parcel owned by Ocean Spray in Wood County. Interestingly, the former is already home to a sizeable (i.e., 266 acres) frac sand mine operated by Smart Sand pictured and mapped in Figure 2.
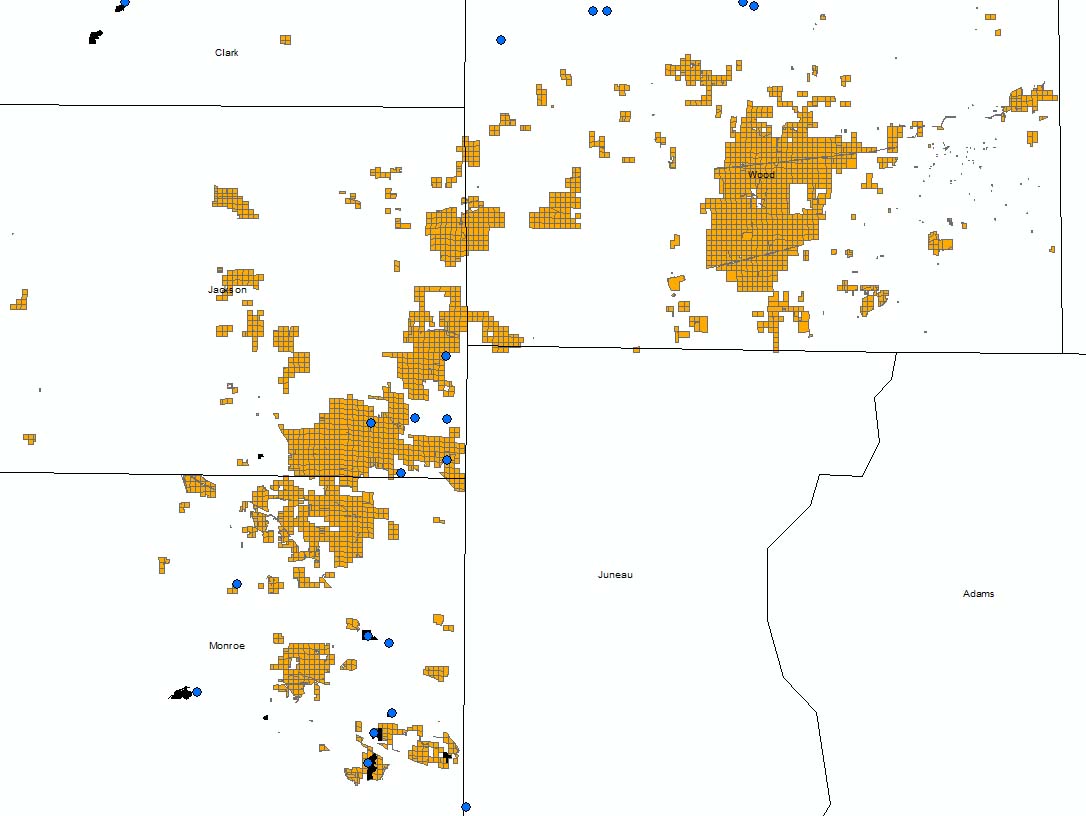
Figure 1. Cranberry bog parcels and frac sand mines in the Wisconsin counties of Monroe, Jackson, and Wood
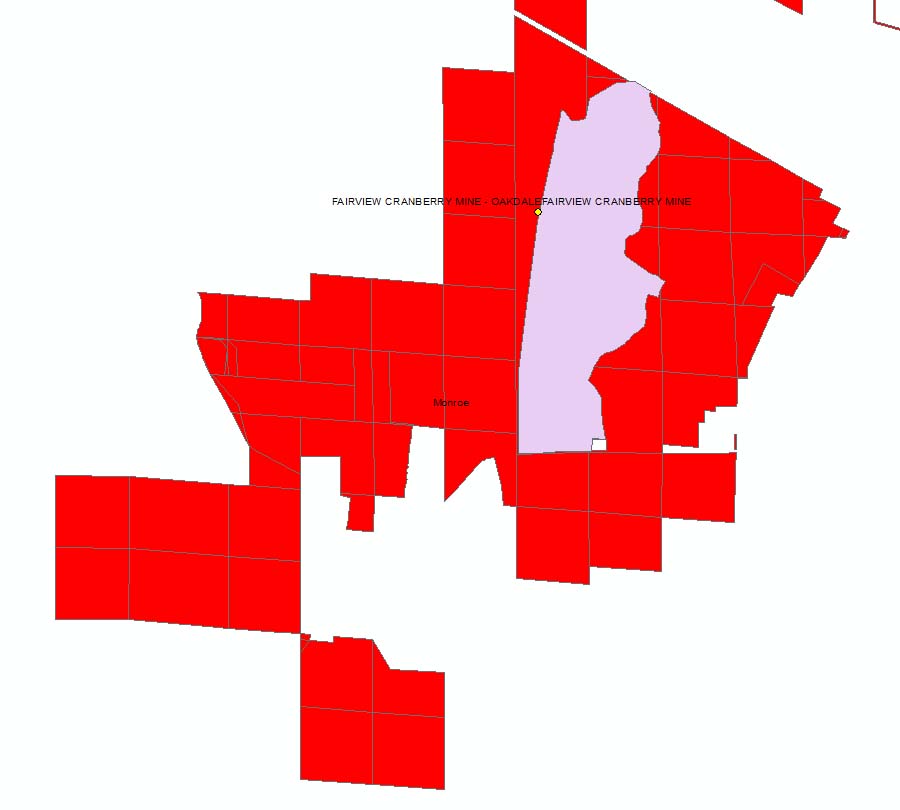
Figure 2. Current and potential extent of Smart Sand’s Fairview Cranberry frac sand mine, Tomah, Monroe County, Wisconsin
In total, the potential for mine expansion in West Central Wisconsin could consume an additional 212,202 acres or 331 square miles. Characterized by dairy farms, and also known as The Driftless Area, this region is where Aldo Leopold penned his masterpiece, A Sand County Almanac. To give a sense of scale to these numbers, it is worth noting that this type of acreage would be like clearing an area the size of the Dallas-Fort Worth metropolis.
Project limitations and emerging concerns
After completing this project, Liz Feil, Pat Popple, and I got on the phone to discuss what we perceived to be its limitations, as well as their concerns with the process and the implications of the MNMDR program, which are listed below:
1. Both Liz and Pat found that when they visited certain counties to inquire as to parcel registrations, most of the registrars of deeds had very little, if any, idea as to what they were talking about, which begged the questions:
- Why does Wisconsin not have a uniform protocol and archival process for such registrations?
- What are the implications of this program with respect to county and township taxable lands, future zoning, and/or master planning?
- What does this program mean for surface and mineral rights ownership in Wisconsin, a state where these two are coupled or decoupled on a parcel by parcel basis?
2. Liz and Pat felt they ended up teaching county registrars more about this registration process during this exercise than they ended up learning themselves.
3. Given the potential ramifications of these types of programs, such registrations should be centrally archived rather than archived at disparate sites across the state. Registrations should be explicitly bolted onto efforts like the aforementioned statewide V4 Statewide Parcel Data, given the fact that the MNMDR parcels are registered for 10 years.
The footprint of frac sand mining at any one point is just a glimpse into how vast its influence could be in the future. Mapping parcel ownership like we’ve done gives people a more realistic sense for the scale and scope of mining in the future and is a more realistic way to analyze the costs/benefits of such an industry. This type of mapping exercise would have greatly benefited those that live in the coal fields of Appalachia and the Powder River Basin as they began to debate and regulate mining, rather than the way they were presented with proposals as smaller discrete operations.
This piecemeal process belies the environmental and social impact of any industrial process, which frac sand mining very much is.
Industrial sand mining and high capacity wells
There is a growing concern, based on a thorough analysis of the data, that the High Volume Hydraulic Fracturing (HVHF) industry’s unquenchable thirst for freshwater is growing at an unsustainable rate. Here at FracTracker, we have been quantifying the exponential increase in HVHF water use, namely in Ohio’s Muskingum River Watershed and northern West Virginia, for more than five years now. More recently, Duke University’s Avner Vengosh has conducted a thorough national analysis of this trend.
While the trends in HVHF water use and waste production are disturbing, such analysis leaves out the water industry uses to mine and process frac sand, or “proppant” in places like Wisconsin, Minnesota, and Illinois. Failure to incorporate such values in an analysis of HVHF’s impact on freshwater, both surface and subsurface, grossly underestimates the industry’s impact on watersheds and competing water uses.
Figure 3 shows monthly and cumulative water demand of frac sand mining. The first thing to point out is the marked seasonal disparities in water withdrawals due to the fact that many of Wisconsin’s frac sand mines go dormant during the winter and ramp up as soon as the ground thaws. The most important result of this work is that we finally have a sense for the total volumes of water permanently altered by the frac sand mining industry:
An astounding 30 billion gallons of water were used between January 2010 and December 2017
This figure is equivalent to the annual demand of ~72,500 US residents (based on an assumption of 418,184 gallons per year). This figure is also equivalent to between 2,179 and 3,051 HVHF wells in Ohio/West Virginia.
Figure 3. Cumulative and monthly water demand by Wisconsin’s frac sand mine Hi-Cap wells, January 2010-December 2017
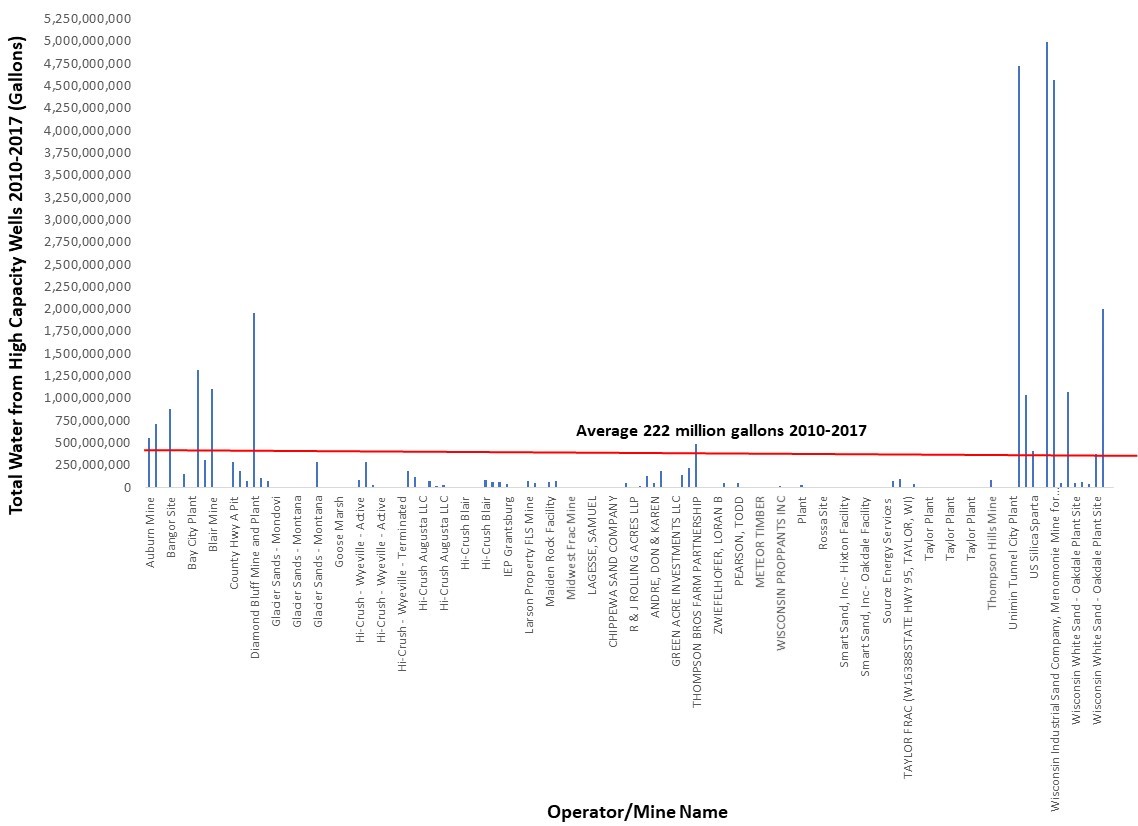
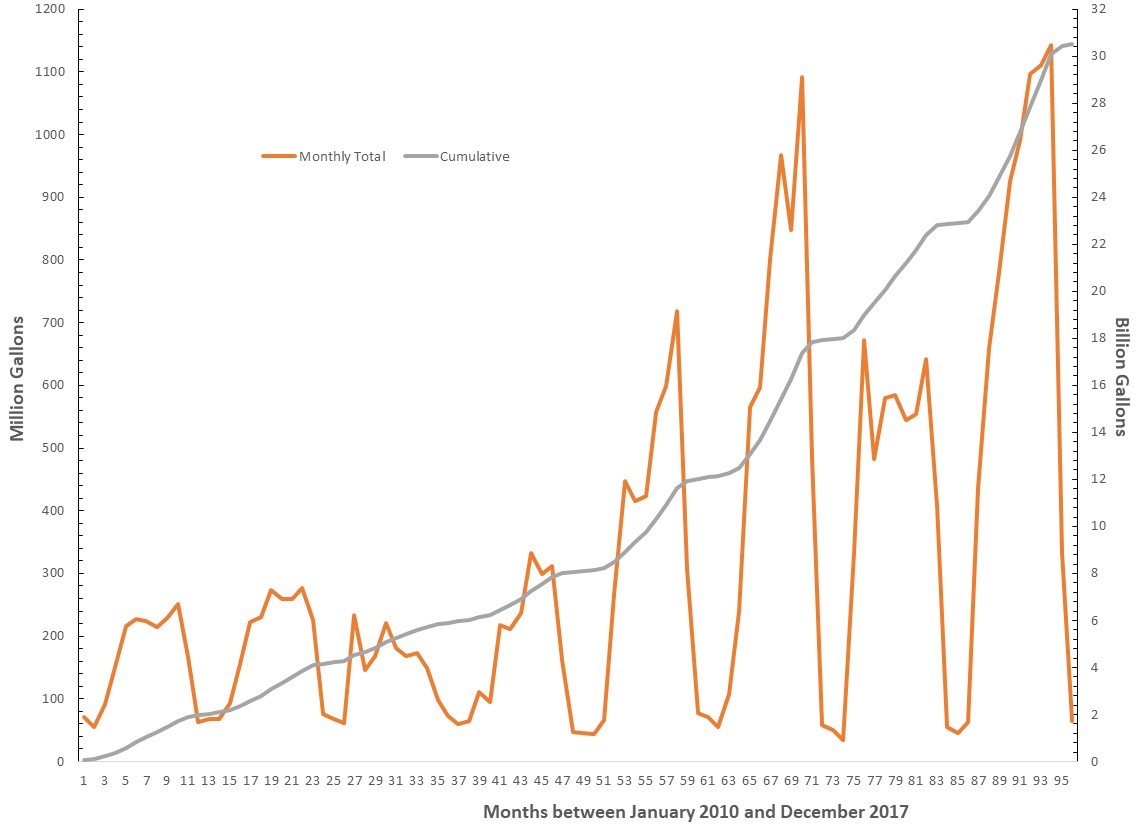 Figure 4 shows water use by operator. The worst actors with respect to water withdrawals over this period were two wells serving Hi-Crush’s active Wyeville mine that in total used 9.6 billion gallons of subsurface water. Covia Holdings, formerly Unimin and Fairmount Santrol, utilized 5.8 billion gallons in processing an undisclosed amount of frac sand at their Tunnel City mine. Covia’s neighboring mine in Oakdale, owned by Wisconsin White Sand and Smart Sand, used more than 2.5 billion gallons during this period spread across six high-capacity wells.
Figure 4. Total water usage by operator, January 2010-December 2017
 These tremendous water volumes prompted us to ask whether we could determine the amount of water needed to mine a typical ton of Wisconsin frac sand. There are numerous issues with data quality and quantity at the individual mine level and those issues stretch from the USGS all the way down to individual townships. However, some townships do collect tonnage records and/or “Fees Tied to Production” from mine operators which allow us to quantify productivity. Using this scant data and the above water volume data we were able to determine “gallons to tons of sand mined” ratios for the years of 2013, 2014, 2015, and/or 2017 for four mines and those ratios range between 30-39 to as much as 521 gallons of water per ton of sand (Table 2).
Table 2. Gallons of water per ton of sand mined for four Wisconsin frac sand mines, 2013-2017
|
Owner |
Property |
City |
County |
Gallon Per Ton | |||
| 2013 | 2014 | 2015 | 2017 | ||||
| Wisconsin Industrial Sand | Maiden Rock Facility | Maiden Rock | Pierce | 98 | 90 | 66 | — |
| Thompson, Terry | Thompson Hills Mine | Chetek | Barron | — | 30 | 521 | — |
| Lagesse, Samuel | NA | Bloomer | Chippewa | 39 | — | 48 | — |
| CSP | Rice Lake Mine | Rice Lake | Barron | — | — | — | 104 |
Conclusions
For far too long we’ve been monitoring frac sand mining retrospectively or in the present tense. We’ve had very little data available to allow for prospective planning or to model the impact of this industry and its role in the Hydraulic Fracturing Industrial Complex writ large. Given what we are learning about the fracking industry’s insatiable appetite for water and sand, it is imperative that we understand where frac sand mining will occur if this appetite continues to grow (as we expect it may, given the current political environment at the state and federal level).
Three examples of this growing demand can be found in our work across the Great Lakes:
1) With the new age of what the HVHF industry is calling “Super Laterals”, between 2010 and 2017 we saw average proppant demand jump nearly six-fold to roughly 25-30 thousand tons per lateral.
2) In Le Sueur County, MN Covia – which is a recent merger of silica mining giants Unimin and Fairmount Santrol – has plans and/or parcel ownership speaking to the potential for an 11-fold increase in their mining operations, which would increase acreage from 560 to 6,500 acres (if sand demand increases at its current clip) (Figures 5 and 6).
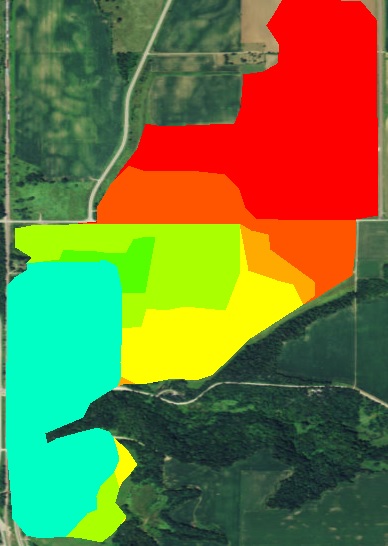
Figure 5. Unimin’s current 560-acre frac sand mine parcel in Kasota, Le Sueur County
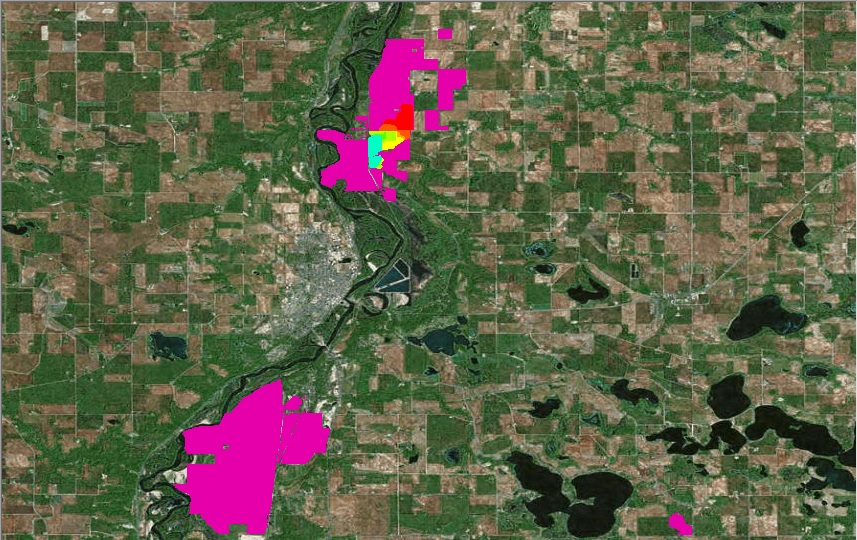
Figure 6. The potential 6,500 extent of Unimin mining by way of parcel ownership search
3) As we’ve previously highlighted, the potential outside Detroit, Michigan for US Silica to expand its current frac sand mining operations would displace hundreds of families. The planned expansion would grow their mine from its current 650-acre footprint to nearly 1,400 acres in the town of South Rockwood, Monroe County (Figure 7).
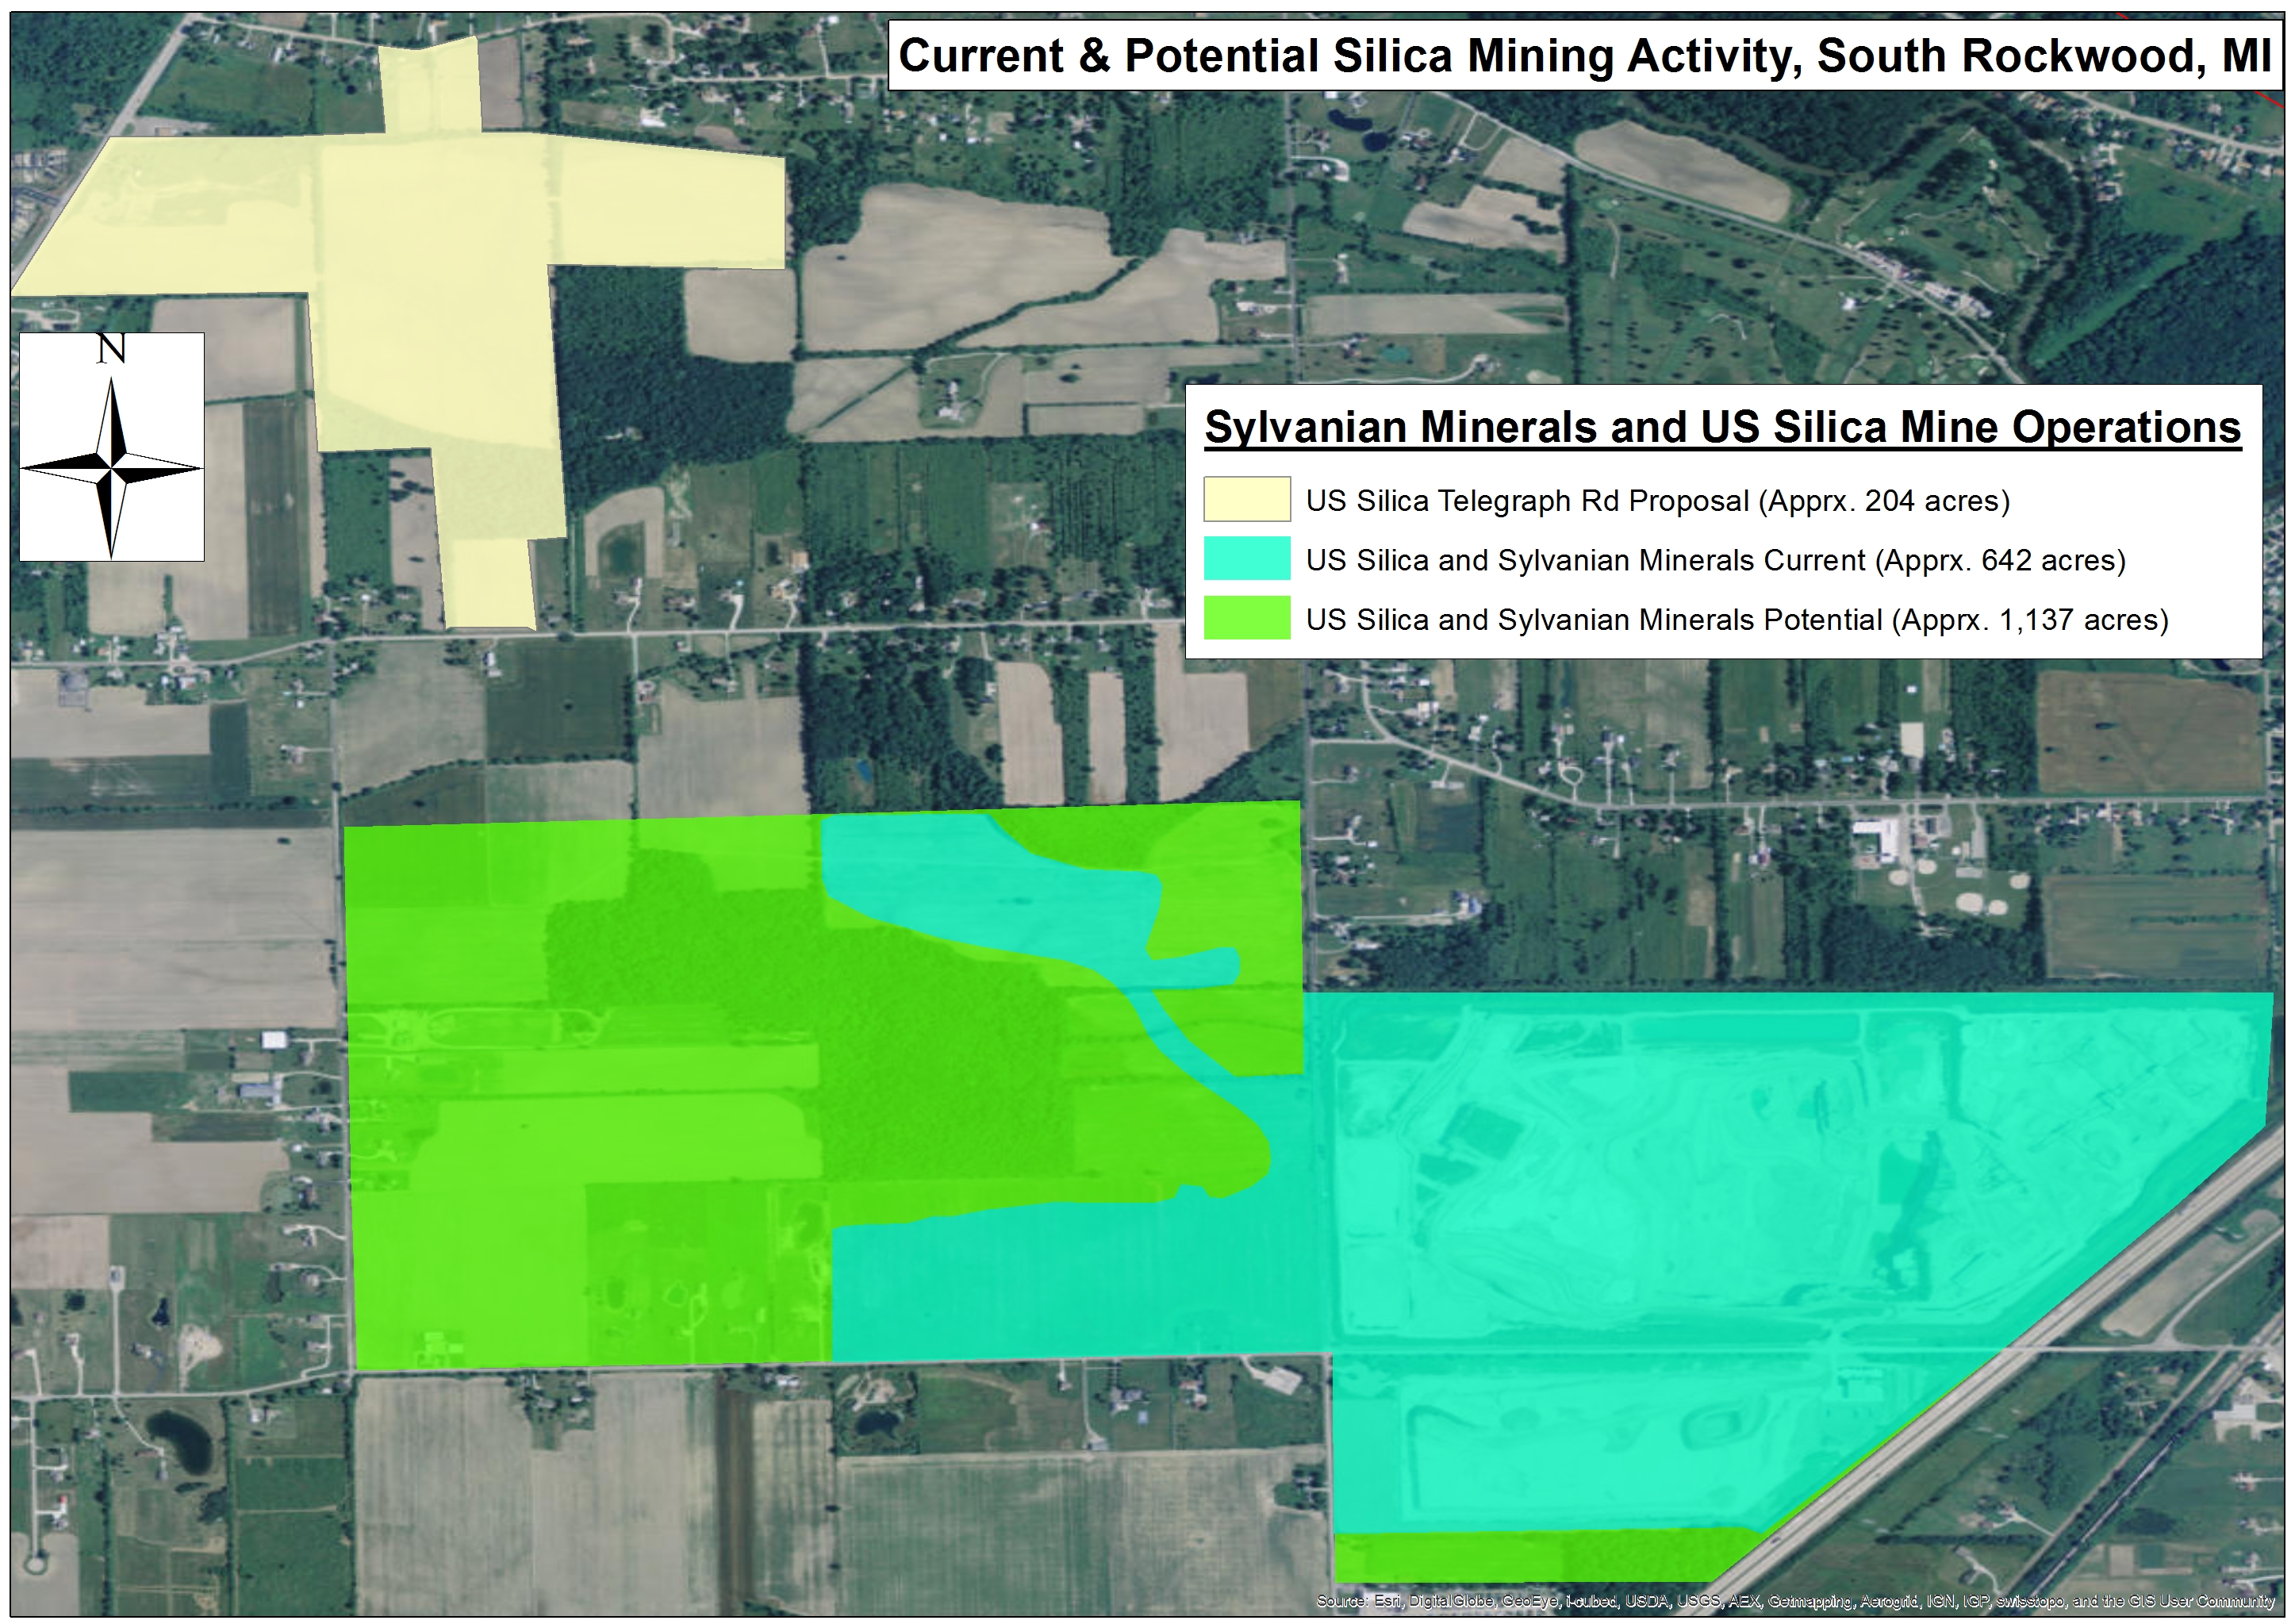
Figure 7. US Silica’s current (642 acres) and potential (1,341 acres) frac sand mine footprint in Monroe County, Michigan.
Given our experience mapping and quantifying the current and future impact of frac sand mining in states with limited mining activity, we felt it was critical that we apply this methodology to the state where industry is mining a preponderance of frac sand. However, this analysis was rendered a bit more complicated by the presence of the MNMDR program and Wisconsin DNR’s “Cranberry Exemption.” Adding to the challenge is the fact that many in Wisconsin’s frac sand communities demanded that we address the tremendous volumes of water being used by the industry and work to incorporate such data into any resulting map.
We hope that this map allows Wisconsin residents to act in a more offensive and prospective way in voicing their concerns, or simply to become better informed on how sand mining has impacted other communities, will influence them, and what the landscape could look like in the future.
It is critical that we see sand mining not as discrete mines with discrete water demands but rather as a continuum, or better yet an ecosystem, that could potentially swallow large up sizeable chunks of Western Wisconsin.
By Ted Auch, Great Lakes Program Coordinator, FracTracker Alliance
P.S. We’ll continue to add MNMDR registered parcels periodically. As parcels change ownership, we will be sure to update both the cranberry bog and industry owned parcel inventory in the comings months and years.