The Hidden Inefficiencies and Environmental Costs of Fracking in Ohio
Ohio continues to increase fracked gas production, facilitated by access to freshwater and lax radioactive waste disposal requirements.
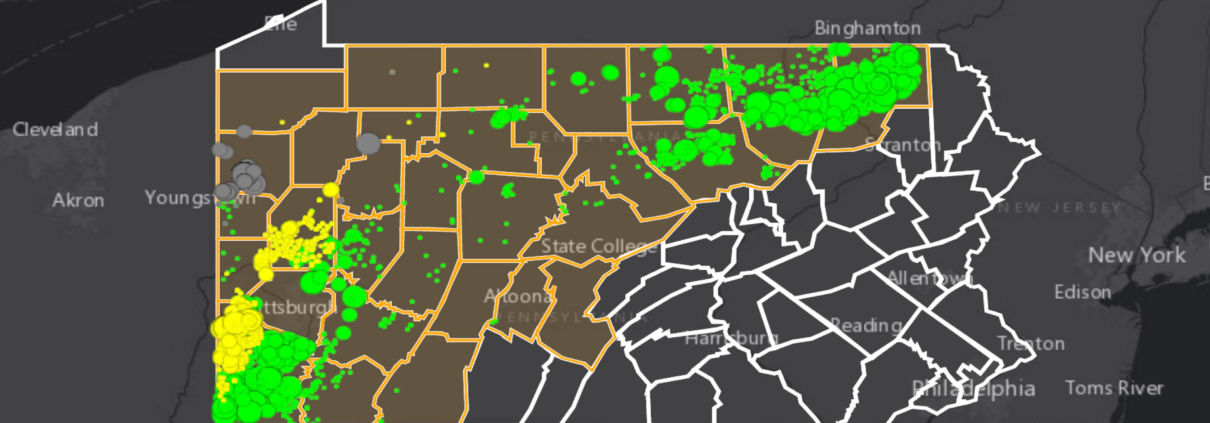
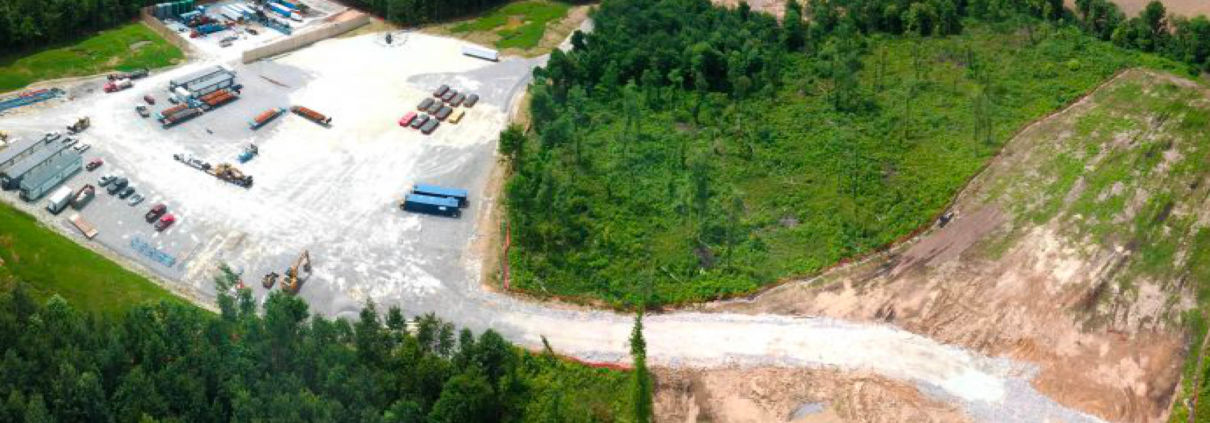
View map fullscreen | How FracTracker maps work
Map: Ohio Quarterly Utica Oil and Gas Production along with Quarterly Wastewater Disposal
Well Volumes
A little under a year ago, FracTracker released a map and associated analysis, “A Disturbing Tale of Diminishing Returns in Ohio,” with respect to Utica oil and gas production, highlighting the increasing volume of waste injected in wastewater disposal wells, and trends in lateral length in fracked wells from 2010 to 2018. In this article, I’ll provide an update on Ohio’s Utica oil and gas production in 2018 and 2019, the demands on freshwater, and waste disposal. After looking at the data, I recommend that we holistically price our water resources and the ways in which we dispose of the industry’s radioactive waste in order to minimize negative externalities.
Recently, I’ve been inspired by the works of Colin Woodward[1] and Marvin Harris, who outline the struggle between liberty and the common good. They relate this to the role that commodities and increasing resource intensity play in maintaining or enhancing living standards. This quote from Harris’s “Cannibals and Kings” struck me as the 122 words that most effectively illustrate the impacts of the fracking boom that started more than a decade ago in Central Appalachia:
“Regardless of its immediate cause, intensification is always counterproductive. In the absence of technological change, it leads inevitably to the depletion of the environment and the lowering of the efficiency of production since the increased effort sooner or later must be applied to more remote, less reliable, and less bountiful animals, plants, soils, minerals, and sources of energy. Declining efficiency in turn leads to low living standards – precisely the opposite of the desired result. But this process does not simply end with everybody getting less food, shelter, and other necessities in return for more work. As living standards decline, successful cultures invent new and more efficient means of production which sooner or later again lead to the depletion of the natural environment.” From Chapter 1, page 5 of Marvin Harris’ “Cannibals and Kings: The Origins of Cultures, 1977
In reflecting on Harris’s quote as it pertains to fracking, I thought it was high time I updated several of our most critical data sets. The maps and data I present here speak to intensification and the fact that the industry is increasingly leaning on cheap water withdrawals, landscape impacts, and waste disposal methods to avoid addressing their increasingly gluttonous ways. To this point, the relationship between intensification and resource utilization is not just the purview of activists, academics, and journalists anymore; industry collaborators like IHS Markit admitting as much in their latest analysis pointing to the fact that oil and gas operators “will have to drill substantially more wells just to maintain current production levels and even more to grow production”. Insert Red Queen Hypothesis analogy here!
Oil and Gas Production in Ohio
The four updated data sets presented here are: 1) oil, gas, and wastewater production, 2) surface and groundwater withdrawal rates for the fracking industry, 3) freshwater usage by individual Ohio fracked wells, and 3) wastewater disposal well (also referred to as Class II injection wells) rates.
Below are the most important developments from these data updates as it pertains to intensification and what we can expect to see in the future, with or without the ethane cracker plants being trumpeted throughout Appalachia.
From a production standpoint, total oil production has increased by 30%, while natural gas production has increased by 50% year over year between the last time we updated this data and Q2-2019 (Table 1).
According to the data we’ve compiled, the rate of growth for wastewater production has exceeded oil and is nearly equal to natural gas at 48% from 2017 to 2018. On average the 2,398 fracked wells we have compiled data for are producing 27% more wastewater per well now than they did at the end of 2017.
| ————–2017————– | ————–2019————– | |||||
| Oil (million barrels) | Gas (million Mcf) | Brine (million barrels) | Oil (million barrels) | Gas (million Mcf) | Brine (million barrels) | |
| Max | 0.51 | 12.92 | 0.23 | 0.62 | 17.57 | 0.32 |
| Total | 83.14 | 5,768.47 | 76.01 | 108.15 | 8,679.12 | 112.28 |
| Mean | 0.40 | 2.79 | 0.37 | 0.45 | 3.62 | 0.47 |
Table 1. Summary statistics for 2,398 fracked wells in Ohio from a production perspective from 2017 to Q2 2019.
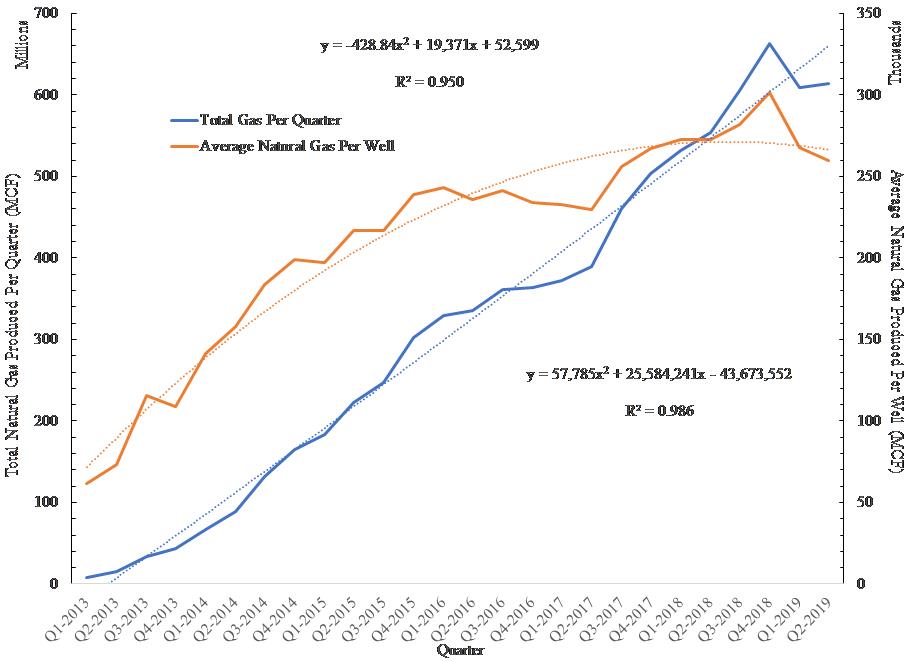
Figure 1. Total fracked gas produced per quarter and average fracked gas produced per well in Ohio from 2013 to Q2-2019.
The increasing amount of resources and number of wells necessary to achieve marginal increases in oil and gas production is a critical factor to considered when assessing industry viability and other long-term implications. As an example, in Ohio’s Utica Shale, we see that total production is increasing, but as IHS Markit admits, this is only possibly by increasing the total number of producing wells at a faster rate. As is evidenced in Figure 1, somewhere around the Winter of 2017-2018, the production rate per well began to flatline and since then it has begun to decrease.
Water demands for oil and gas production in Ohio
Since last we updated the industry’s water withdrawal rates, the Ohio Department of Natural Resources (ODNR) has begun to report groundwater rates in addition to surface water. The former now account for nine sites in seven counties, but amount to a fraction of reported withdrawals to date (around 00.01% per year in 2017 and 2018). The more disturbing developments with respect to intensification are:
1) Since we last updated this data, 59 new withdrawal sites have come online. There are currently 569 sites in total in ODNR’s database. This amounts to a nearly 12% increase in the total number of sites since 2017. With this additional inventory, the average withdrawal rate across all sites has increased by 13% (Table 2).
2) Since 2010, the demand for freshwater to be used in fracking has increased by 15.6% or 693 million gallons per year (Figure 2).
3) We expect to see an inflection point when water production will increase to accommodate the petrochemical buildout with cracker plants in Dilles Bottom, OH; Beaver County, PA; and elsewhere. In 2018 alone, the oil and gas industry pulled 4.69 billion gallons of water from the Ohio River Valley. Since 2010, the industry has permanently removed 22.96 billion gallons of freshwater from the Ohio River Valley. It would take the entire population of Ohio five years to use the 2018 rate in their homes.[2]
As we and others have mentioned in the past, this trend is largely due to the bargain basement price at which we sell water to the oil and gas sector throughout Appalachia.[3] To increase their nominal production returns, companies construct longer laterals with orders of magnitude more water, sand, and chemicals. At this rate, the fracking industry’s freshwater demand will have doubled to around 8.8-.9.5 billion gallons per year by around 2023. Figure 3 demonstrates that average fracked lateral length continues to increase to the tune of +15.7-21.2% (+1,564-2,107 feet) per quarter per lateral. This trend alone is more than 2.5 times the rate of growth in oil production and roughly 24% greater than the rate of growth in natural gas production (See Table 1).
4. The verdict is even more concerning than it was a couple years ago with respect to water demand increasing by 30% per quarter per well or an average of 4.73 million gallons (Figure 4). The last time we did this analysis >1.5 years ago demand was rising by 25% per quarter or 3.84 million gallons. At that point I wouldn’t have guessed that this exponential rate of water demand would have increased but that is exactly what has happened. Very immediate conversations must start taking place in Columbus and at the region’s primary distributor of freshwater, The Muskingum Watershed Conservancy District (MWCD), as to why this is happening and how to push back against the unsustainable trend.
| 2017 | 2018 | |
| Sites | 510 | 569 |
| Maximum (billion gallons) | 1.059 | 1.661 |
| Sum (billion gallons) | 18.267 | 22.957 |
| Mean (billion gallons) | 0.358 | 0.404 |
Table 2. Summary of fracking water demands throughout Ohio in 2017 when we last updated this data as well as how those rates changed in 2018.
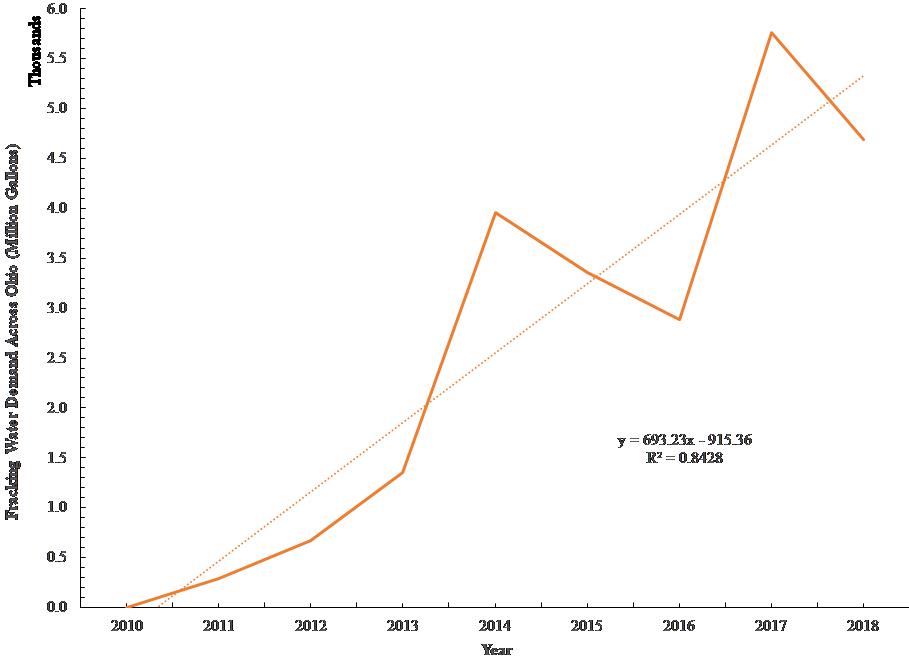
Figure 2. Hydraulic fracturing freshwater demand in total across 560+ sites in Ohio from 2010 to 2018 (million gallons per year).
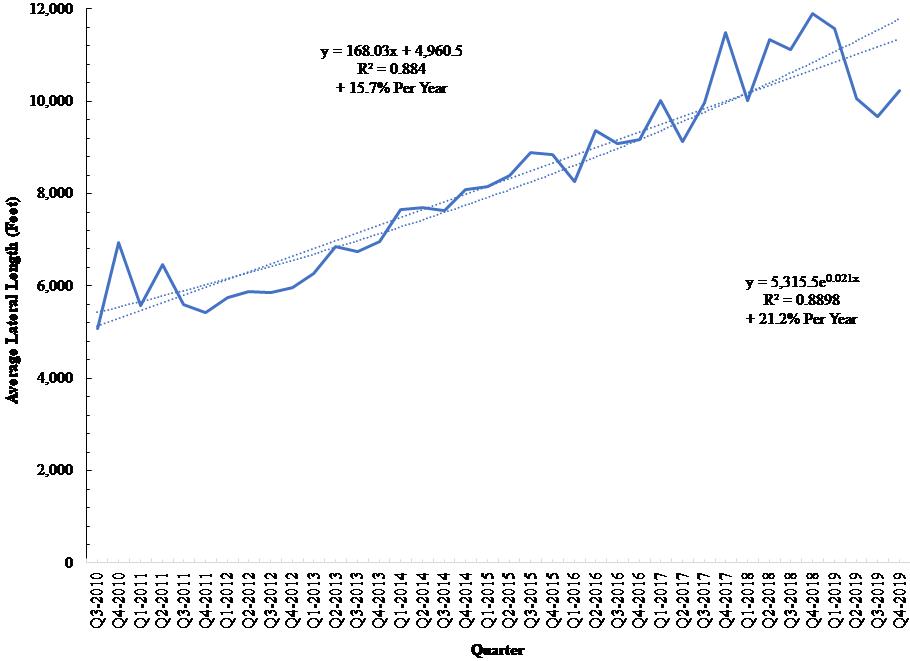
Figure 3. Average lateral length for all of Ohio’s permitted hydraulically fractured laterals from from Q3-2010 to Q4-2019, along with average rates of growth from a linear and exponential standpoint (feet).
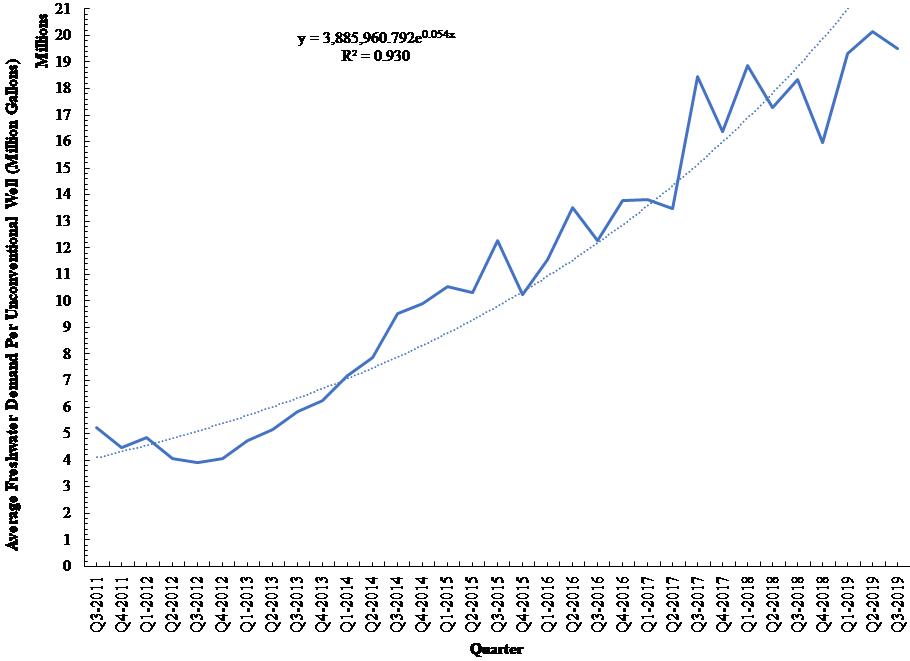
Figure 4. Average Freshwater Demand Per Unconventional Well in Ohio from Q3-2011 to Q3-2019 (million gallons).
Waste Disposal
When it comes to fracking wastewater disposal, the picture is equally disturbing. Average disposal rates across Ohio’s 220+ wastewater disposal wells increased by 12.1% between Q3-2018 and Q3-2019 (Table 3). Interestingly, this change nearly identically mirrors the change in water withdrawals during the same period. What goes down– freshwater – eventually comes back up.
Across all of Ohio’s wastewater disposal wells, total volumes increased by nearly 22% between 2018 and the second half of 2019. However, the more disturbing trend is the increasing focus on the top 20 most active wastewater disposal wells, which saw an annual increase of 17-18%. These wells account for nearly 50% of all waste and the concern here is that many of the pending wastewater disposal well permits are located on these sites, within close proximity, and/or are proposed by the same operators that operate the top 20.
When we plot cumulative and average disposal rates per well, we see a continued exponential increase. If we look back at the last time, we conducted this analysis, the only positive we see in the data is that at that time, average rates of disposal per well were set to double by the Fall of 2020. However, that trend has tapered off slightly — rates are now set to double by 2022.
Each wastewater disposal well is seeing demand for its services increase by 2.42 to 2.94 million gallons of wastewater per quarter (Figure 5). Put another way, Ohio’s wastewater disposal wells are rapidly approaching their capacity, if they haven’t already. Hence why the oil and gas industry has been frantically submitting proposals for additional waste disposal wells. If these wells materialize, it means that Ohio will continue to be relied on as the primary waste receptacle for the fracking industry throughout Appalachia.
| Variable | ——————-All Wells——————- | ——————-Top 20——————- | ||||
| To Q3-2018 | To Q3-2019 | % Change | To Q3-2018 | To Q3-2019 | % Change | |
| Number of Wells | 223 | 243 | +9.0 | ——- | ——- | ——- |
| Max (MMbbl) | 1.12 | 1.20 | +7.1 | ——- | ——- | ——- |
| Sum (MMbbl) | 203.19 | 247.05 | +21.6 | 101.43 | 119.31 | +17.6 |
| Average (MMbbl) | 0.91 | 1.02 | +12.1 | 5.07 | 5.97 | +17.8 |
Table 3. Summary Statistics for Ohio’s Wastewater Disposal Wells (millions of barrels (MMbbl)).
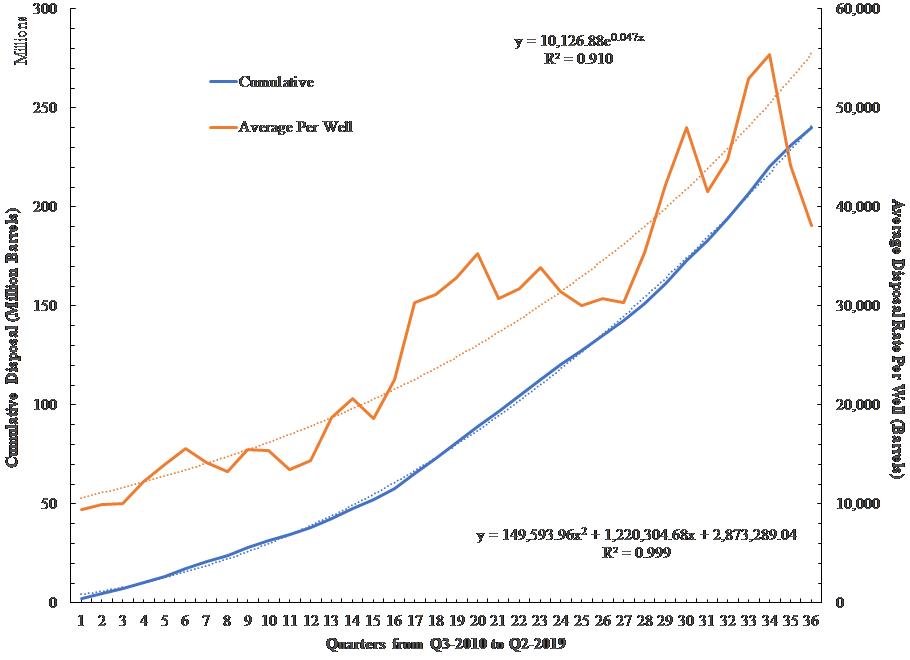
Figure 5. Average Fracking Waste Disposal across all of Ohio’s Wastewater Disposal Wells and the cumulative amount of fracking waste disposed of in these wells from Q3-2010 to Q2-2019 (million barrels).
Using the Pennsylvania natural gas data merged with the Ohio wastewater data, we were able to put a finer point on how much wastewater would be produced with a 100,000 barrel ethane cracker like the one PTT Global Chemical has proposed for Dilles Bottom, Ohio. The following are our best estimate calculations assuming 1 barrel of condensate is 20-40% ethane. These calculations required that we take some liberties with the merge of the ratio of gas to wastewater in Ohio with the ratio of gas to condensate in Pennsylvania:
- For 2,064 producing Ohio fracked wells, the ratio of gas to wastewater is 64.76 thousand cubic feet (Mcf) of gas produced per barrel of wastewater.
- Assuming 40% ethane, the ratio of gas to condensate in Washington County, PA wells for the first half of 2019 was 320.08 Mcf of gas per barrel of ethane condensate. For 100,000 barrels of ethane needed per cracker per day, that would result in 494,285 barrels (20.76 million gallons) of brine per day.
- Assuming 20% ethane, the ratio of gas to condensate in Washington County, PA wells for the first half of 2019 was 640.15 Mcf per barrel of ethane condensate = For 100,000 barrels of ethane needed per cracker per day that would result in 988,571 barrels/41.52 million gallons of wastewater per day.
But wait, here is the real stunner:
- The 40% assumption result is 3.81 times the daily rates of wastewater taken in by our current inventory of wastewater disposal wells and 5.37 times the daily rates of brine taken in by the top 20 wells (Note: the top 20 wastewater disposal wells account for 71% of all wastewater waste taken in by all of the state’s disposal wells).
- The 20% assumption result is 7.62 times the daily rates of wastewater taken in by our current inventory of wastewater disposal wells and 10.74 times the daily rates of wastewater taken in by the top 20 wells.
Therefore, we estimate the fracked wells supplying the proposed PTTGC ethane cracker will generate between 20.76 million and 41.52 million gallons of wastewater per day. That is 3.8 to 7.6 times the amount of wastewater currently received by Ohio’s wastewater disposal wells.
What does this means in terms of truck traffic? We can assume that at least 80% of the trucks that transport wastewater are the short/baby bottle trucks which haul 110 barrels per trip. This means that our wastewater estimates would require between 4,493 and 8,987 truck trips per day, respectively. The pressures this amount of traffic will put on Appalachian roads and communities will be hard to measure and given the current state of state and federal politics and/or oversight it will be even harder to measure the impact inevitable spills and accidents will have on the region’s waterways.
Conclusion
There is no reason to believe these trends will not persist and become more intractable as the industry increasingly leans on cheap waste disposal and water as a crutch. The fracking industry will continue to present shareholders with the illusion of a robust business model, even in the face of rapid resource depletion and precipitous production declines on a per well basis.
I am going to go out on a limb and guess that unless we more holistically price our water resources and the ways in which we dispose of the industry’s radioactive waste, there will be no other supply-side signal that we could send that would cause the oil and gas industry to change its ways. Until we reach that point, we will continue to compile data sets like the ones described above and included in the map below, because as Supreme Court Justice Louis Brandeis once said, “Sunlight is the best disinfectant!”
By Ted Auch, Great Lakes Program Coordinator, FracTracker Alliance with invaluable data compilation assistance from Gary Allison
[1] Colin Woodward’s “American Character: A history of the epic struggle between individual liberty and the common good” is a must read on the topic of resource utilization and expropriation.
[2] https://pubs.er.usgs.gov/publication/cir1441
[3] In Ohio the major purveyor of water for the fracking industry is the Muskingum Watershed Conservancy District (MCWD) and as we’ve pointed out in the past they sell water for roughly $4.50 to $6.50 per thousand gallons. Meanwhile across The Ohio River the average price of water for fracking industry in West Virginia in the nine primary counties where fracking occurs is roughly $8.38 per thousand gallons.
Data Downloads
Quarterly oil, gas, brine, and days in production for 2,390+ Unconventional Utica/Point Pleasant Wells in Ohio from 2010 to Q2-2019
Ohio Hydraulic Fracturing Freshwater and Groundwater Withdrawals from 2010 to 2018
Lateral length (Feet) for 3,200+ Fracked Utica/Point Pleasant Wells in Ohio up to and including wells permitted in December, 2019
Freshwater Use for 2,700+ Unconventional Wells in Ohio from Q3-2011 to Q3-2019
Quarterly Volume Disposal (Barrels) for 220+ Ohio Class II Salt Water Disposal Wells from 2010 to Q4-2019