People and Production: Reducing Risk in California Extraction
Executive Summary
New research shows that low-income communities and communities of color that are most impacted by oil and gas extraction (Frontline Communities) in California are at an elevated risk for preterm birth, low birth weight, and other negative birth outcomes. This is in addition to the elevated risks of cancer; risks for respiratory, cardiovascular, and pulmonary disorders; and risks for eyes, ears, nose, throat, and skin irritation that Frontline Communities face, among others. Public health interventions including setback requirements for oil and gas drilling are necessary to address the environmental health endemics documented in Frontline Communities.
This report focuses on the two immediate stakeholders impacted by oil and gas well drilling setbacks: Frontline Communities and oil and gas operators. First, using U.S. Census data this report helps to define the Frontline Communities most impacted by oil and gas extraction. Then, using GIS techniques and California state data, this report estimates the potential impact of a setback on California’s oil production. Results and conclusions of these analyses are outlined below.
- Previous statewide and regional analyses on proximity of oil and gas extraction to various demographics, including analyses included in Kern County’s 2020 draft EIR, have inadequately investigated disparate impacts, and have published erroneous results.
- This analysis shows that approximately 2.17 million Californians live within 2,500’ of an operational oil and gas well, and about 7.37 million Californians live within 1 mile.
- California’s Frontline Communities living closest to oil and gas extraction sites with high densities of wells are predominantly low income households with non-white and Latinx demographics.
- The majority of oil and gas wells are located in environmental justice communities most impacted by contaminated groundwater and air quality degradation resulting from oil and gas extraction, with high risks of low-birth weight pregnancy outcomes.
- Adequate Setbacks for permitting new oil and gas wells will reduce health risks for Frontline Communities.
- Setbacks for permitting new oil and gas wells will not decrease existing California oil and gas production.
- Phasing out wells within setback distances will further decrease health risks for Frontline Communities.
- Phasing out wells by disallowing rework permits within a 2,500’ setback distance will have a minimal impact on overall statewide oil production, estimated at an annual maximum loss of 1% by volume.
- Setbacks greater than 2,500’ in combination with other public health interventions are necessary to reduce risk for Frontline Communities.
- Based on the peer reviewed literature, a setback of at least one mile is recommended.
Table of Contents
Demographics
CalEnviroScreen
Spatial Bias
Well Density
Shafter
Lost Hills, Arvin, and Taft
Bakersfield
Ventura
Los Angeles
Los Angeles
Kern County
Introduction
The energy focused on instituting policies to protect the health of Frontline Communities in California from the negative impacts of oil and gas extraction is at an all-time high. In August 2020, Assembly Bill 345 was heard in the State Senate’s Natural Resources Committee, but was blocked from reaching the Senate floor for a vote. The bill would have required the Geologic Energy Management Division in the Department of Conservation (CalGEM) to establish a minimum setback distance between oil and gas production and related activities and sensitive receptors like homes, schools, and hospitals. While this strong effort to establish health and safety setbacks through the state legislature may have failed, the movement has paved the way for local actions. Additionally, California is in the midst of a statewide public health rule-making process to address the health impacts of oil and gas extraction currently experienced by Frontline Communities.
In related advocacy, Frontline Community groups in California recommended a minimum 2500’ setback based on scientific studies, including a 2015 report by the California Council on Science and Technology which identified “significant” health risks at a distance of one-half mile from drill sites. A recent grand jury report from Pennsylvania recommended 5,000’ setbacks, with 2,500’ as a minimum requirement to address the most impacted communities. Additionally, the state of Colorado has recently adopted 2,000’ setbacks for homes and schools, while the existing 2,000’ setback has had minimal impacts on oil and gas production.
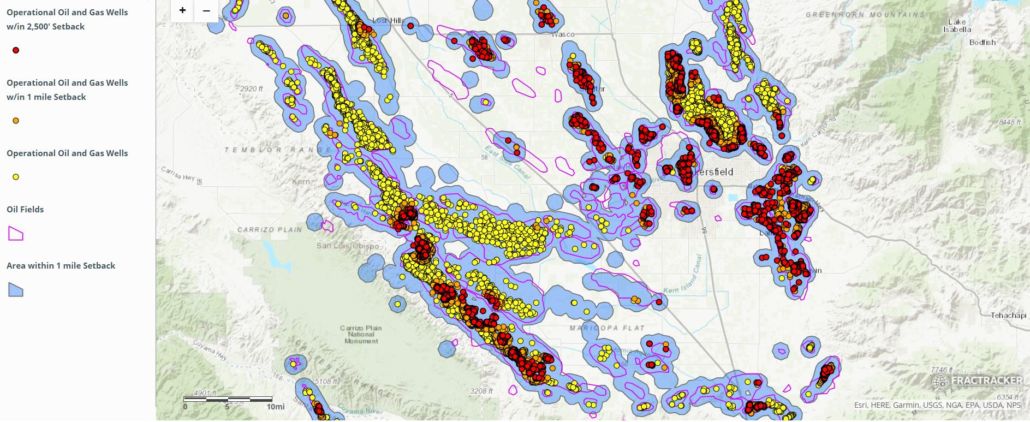
In September 2020, Governor Newsom declared the deadline for the first draft of the pre-regulatory rule-making report will be the first of January 2021. FracTracker Alliance has therefore completed an updated assessment of the Frontline Communities most impacted by oil and has projected the potential impact on oil and gas extraction operations. An interactive map of oil and gas activity and Frontline Communities is shown below in Figure 1. The map identifies the operational (active, idle, and new) oil and gas wells located within 2,500’ and 1 mile buffer zones from sensitive receptors, defined as homes, schools, licensed daycares and healthcare facilities.
The impacts of oil and gas drilling do not stop at 2,500’, as regional groundwater contamination and air quality degradation of ozone creation and PM2.5 concentrations are widespread hazards of oil and gas extraction. Phasing out wells within 2,500’ of homes will reduce the negative health effects for the Frontline Communities bearing the brunt of the risks associated with living near oil and gas wells, as well as reduce regional environmental hazards. These risks include over 24 categories of health impacts and symptoms associated with 14 bodily systems, including eyes, ears, nose, and throat; mental health; reproduction and pregnancy; endocrine; respiratory; cardiovascular and pulmonary; blood and immune system; kidneys and urinary system; general health; sexual health; and physical health among others. The most regularly documented health outcomes include mortality, asthma and respiratory outcomes, cancer risk including hematological (blood) cancer, preterm birth, low birth weight and other negative birth outcomes.
The interactive map below in Figure 1 shows the operational oil and gas wells located within 2,500’ of sensitive receptors, including homes, schools, healthcare facilities, prisons, and permitted daycares. Overall in the state of California, 16,724 operational (8,618 active, 7,786 idle, and 320 new) wells are located within the 2,500’ setback. Of the total ~105,000 operational (62,000 active, 37,400 idle, and 6,000 new), about 16% are within the setback. These wells accounted for 12.8% of the total oil/condensate produced in California in 2019. Table 1 below shows the counties where these wells are located, by well permit status. It bears noting that these figures on well location and production represent only a snapshot of current industry activity. As discussed below, current setback proposals would provide a phase out period for existing wells that would greatly reduce any immediate impact on production. Further, directional and even horizontal drilling is common in California, meaning operators can relocate their surface drilling equipment to safer distances and still access oil and gas reserves to maintain production.
Table 1. Status of wells within the 2,500’ setback zone, by county. The table shows the counts of wells located within the 2,500’ setback from homes and other sensitive receptors, broken out by the status of the wells.
| Well Count by Status | |||
| County | Active | New | Idle |
| Kern | 3,501 | 234 | 2,171 |
| Los Angeles | 2,580 | 29 | 3,006 |
| Orange | 914 | 13 | 816 |
| Ventura | 534 | 7 | 600 |
| Santa Barbara | 198 | 17 | 241 |
| Los Angeles Offshore | 168 | 2 | 51 |
| Glenn | 133 | 76 | |
| San Joaquin | 97 | 71 | |
| Monterey | 88 | 9 | 95 |
| Fresno | 86 | 6 | 137 |
| Sutter | 73 | 71 | |
| Tulare | 65 | 1 | 30 |
| Colusa | 47 | 80 | |
| Tehama | 38 | 34 | |
| Solano | 30 | 0 | 65 |
| Sacramento | 22 | 1 | 38 |
| San Bernardino | 14 | 29 | |
| Humboldt | 12 | 11 | |
| Alameda | 7 | 3 | |
| Contra Costa | 5 | 1 | 16 |
| San Benito | 3 | 4 | |
| San Luis Obispo | 2 | 14 | |
| Yolo | 1 | 13 | |
| Grand Total | 8,618 | 320 | 7,786 |
Figure 1. Map of California operational oil and gas wells with 2,500’ and one mile setback distances. One mile setbacks are included as a minimum recommendation of this report based on peer reviewed literature. This report recommends the state of California consider one mile as a minimum setback distance to protect Frontline Communities. As you zoom into the map additional, more detailed layers will appear.
Methods (Quick Overview)
In this article we conducted spatial analyses using both the demographics of Frontline Communities and the amount of oil produced from wells near Frontline Communities. This assessment used CalGEM data (updated 10/1/20) to map the locations of operational oil and gas wells and permits, as shown above in Figure 1. The analyses of oil production data utilized CalGEM’s annual production data reporting barrels of oil/condensate. GIS analyses were completed using ESRI ArcGIs Pro Ver. 2.6.1 with data projected in NAD83 California Teale Albers.
Wells within 2,500’ and 1 mile of sensitive receptors were determined using GIS techniques. This report defines sensitive receptors as residences, schools, licensed child daycare centers, healthcare facilities. Sensitive receptor datasets were downloaded from California Health and Human Services, and the California Department of Education.
We used block group level “census designated areas” from American Community Survey (2013-2018) demographics to estimate counts of Californians living near oil and gas extraction activity. Census block groups were clipped using the buffered datasets of operational oil and gas wells. A uniform population distribution within the census blocks was assumed in order to determine the population counts of block groups within 2,500’ of an operational oil and gas well, 2,500’ to 1 mile from an operational well, and beyond 1 mile from an operational well. Census demographics and total population counts were scaled using the proportion of the clipped block groups within the setback area (Areal percentage = Area of block group within [2,500’; 2,500’-1 mile; Beyond 1 mile] of an operational well / Total area of block group).
This conservative approach provided a general overview of the count and demographics of Californians living near extraction operations, but does little to shed light on most impacted Frontline Communities; specifically urban areas with dense populations near large oil fields. More granular analyses at the local level were necessary to address the spatial bias resulting from non-uniform census block group dimensions and population density distributions, as well as the distribution of operational oil and gas wells within the census block groups. Consequently, we conducted further analysis utilizing customized sample areas for each oil field, which were selected manually using remote sensing data. Full census blocks were used to summarize the actual areas and the urban populations constituting the majority of Frontline Communities.
In the localized, static maps that follow, the census blocks included in the population summaries are shown in pink, while the surrounding census blocks are shown in blue. As seen in Table 2, census data for this initial environmental justice assessment was limited to “Race” (Census Table XO2), “Hispanic or Latino Origin” (Census Table XO3) and several other indicators including “Annual Median Income of Households” (Census Table X19) and “Poverty” (Census Table X17).
Results and Discussion
California Statewide Analysis
Demographics
As a baseline, it is important to provide statewide estimations to track the total number of Californians living near oil and gas extraction operations. This analysis showed that about 2.17 million Californians live within 2,500’ of an operational oil and gas well, and about 7.37 million Californians live within 1 mile. The demographics of these communities at and between these distances is shown below in Table 2, alongside demographic estimates of the California population living beyond 1 mile from an oil and gas well. Census block groups closer to oil and gas wells have higher proportions of Non-white (calculated by subtracting “White Only” from “Total Population”) and Latinx (“Hispanic or Latino Origin”) populations, as well as higher proportions of low-income households, based on both median annual income and poverty thresholds. The analysis show that communities living closer to oil and gas wells have higher percentages of non-white and Latinx populations when compared to the population living beyond 1 mile from an operational oil and gas wells. Communities closer to oil and gas wells are also more likely to be closer to the poverty threshold with lower median annual household incomes.
Table 2. The table shows statewide demographics at multiple distances from operational oil and gas wells. Included are estimates of the non-white and Latinx proportions of the populations within set distances from operational oil and gas wells. The percentage of populations within several poverty thresholds were also summarized, along with median annual household income and age.
| Distance from an operational oil and gas well | |||
| Indicators of Disparity | Within 2,500′ | 2,500′ – 1 Mile | Beyond 1 Mile (Statewide) |
| Demographics: Non-white | 44.44% | 43.56% | 39.16% |
| Demographics: Latinx | 43.25% | 44.97% | 37.79% |
| Poverty: Under Poverty Threshold | 15.01% | 14.97% | 14.12% |
| Poverty: Under 1.5X Poverty Threshold | 24.31% | 24.85% | 23.25% |
| Poverty: Under 2X Poverty Threshold | 33.59% | 34.25% | 32.17% |
| Median Annual Household Income < $40k | 30.09% | 30.73% | 28.72% |
| Median Annual Household Income <$75k | 53.53% | 54.36% | 51.76% |
| Age: 0-5 years | 6.08% | 6.12% | 6.37% |
| Age: <18 years | 21.54% | 22.12% | 23.39% |
| Age: 65+ | 13.17% | 13.11% | 13.68% |
| Demographics: White only | 55.56% | 56.44% | 60.84% |
CalEnviroScreen
CalGEM operational wells data was also overlaid on CalEnviroScreen 3.0 (CES) indicators of environmental health. CES is provided by the Office of Environmental Health Hazard Assessment (OEHHA), on behalf of the California Environmental Protection Agency (CalEPA).
CalEnviroScreen data, like U.S. Census data, is also aggregated at the census block group level. While this data can also suffer from the same spatial bias as the statewide analysis above, CES is still very useful to visualize and map the regional pollution burden to assess disparate impacts. The results of the analysis are shown below in Table 3. Counts of operational oil and gas wells for ranges of CES percentile scores. Higher percentiles represent increased environmental degradation or negative health impacts as specified. Of note, the majority of operational oil and gas wells are located in census tracts with the worst scores for air quality degradation and high incidence of low birth weight.
The large number of wells located in the 60-80th percentile rather than the worst (80-100th percentile) is a result of spatial bias, and the many factors that are aggregated to generate the CES Total Scores. These factors include relative affluence and other indicators of socio-economic status. The majority of the worst (80th-100 percentile for Total CES Score) census block groups are located in low-income urban census block groups, many in Northern California cities that do not host urban drilling operations.
This spatial bias results from edge effects of census block groups, where communities living near oil and gas extraction operations may not live in the same census block groups as the oil and gas wells, and are therefore not counted. The authors would recommend future analyses be designed that use CES data to assess disparate impacts in the census block groups most impacted by oil and gas extraction. Neighboring census block groups that do not physically contain operational wells still suffer the consequences of proximity.
For the asthma rankings, the majority of wells are located in the best CES 3.0 percentile (0-20th percentile) for Asthma. While there is much urban drilling in Los Angeles, the spatial bias in this type of analysis gives more weight to the majority of oil and gas wells that are located in rural areas, which historically have much lower asthma rates. This is a result of the very high incidence of asthma in cities without urban drilling such as the Bay Area and Sacramento (80-100th percentile).
Table 3. Counts of operational oil and gas wells in select CalEnviroScreen 3.0 indicators census tracts.
| Operational Well Counts by CES3.0 Percentile | |||||
| 0-20%ile | 20-40%ile | 40-60%ile | 60-80%ile | 80-100%ile | |
| PM2.5 Air Quality Degradation | 5,708 | 4,237 | 16,614 | 7,089 | 69,987 |
| Ozone Air Quality Degradation | 2,238 | 5,435 | 6,107 | 9,898 | 79,957 |
| Contaminated Drinking Water | 1,019 | 1,675 | 53,452 | 6,214 | 41,206 |
| High Incidence of Low Birth Weight | 10,186 | 13,368 | 14,995 | 3,236 | 58,036 |
| High Incidence of Asthma | 40,247 | 19,827 | 18,902 | 4,867 | 19,792 |
| Total CES 3.0 | 1,583 | 5,756 | 15,671 | 65,356 | 12,985 |
Spatial Bias
Using census data to assess the demographics of those communities most affected by oil and gas drilling can produce misleading results both because of how census designated areas (census tracts and block groups) are designed and because of the uneven distribution of residents within tracts. For example, the majority of Californians who live closest to high concentrations of oil and gas extraction, such as the Kern River oil field, do so in residentially zoned cities and urban settings. In most Frontline Communities the urban census designated areas do not actually contain many wellsites. Instead urban census designated areas are located next to the “estate” and “industrial” (including petroleum extraction) zoned census designated areas that contain the well-sites.
Estate and industrially zoned census designated areas contain the majority of well-sites in Kern County. They are much larger than residentially zoned areas with very low population densities and higher indicators of socioeconomic status. Population centers within the estate zoned areas are often located on the opposite end and farther from well sites than the lower income communities and communities of color living in the neighboring, residentially-zoned census designated areas (e.g., Lost Hills and Shafter). In these cases the statewide demographic summaries above misrepresent the Frontline Communities who are truly closest to extraction operations. Localized environmental justice demographics assessments can also be manipulated in this way.
For instance, The 2020 Kern County draft EIR (chapter 7 PDF pp. 1292-1305) used well counts aggregated by census tracts to conclude that wells in Kern County were not located in disparately impacted communities. Among other requirements for scientific integrity, the draft Kern EIR fails to take into account how the shape, size, and orientation of census designated areas affect the results of an environmental justice assessment. In addition, the EIR uses low-resolution data summarized at the census tract level. Census tracts are much too large to be used to investigate localized health impacts or disparities. Using these blatantly inadequate methods, the draft EIR even claimed Kern County’s oil and gas wells are predominantly located in higher income, white communities, which is outright wrong. For more specific criticisms of the Draft EIR read the FracTracker analysis of the 2020 Kern County EIR.
Results from these types of analyses can be very misleading. Using generalized methods of attributing wells to specific census designated areas does little to identify the communities most impacted by the localized environmental degradation resulting from oil and gas extraction operations, particularly when large census areas such as census tracts are used.
This report therefore takes a different approach, focusing directly on California’s most heavily drilled communities. To understand who and which communities are most harmed by the large-scale industrial oil and gas extraction operations in California, spatial analyses must be refined to focus individually on the communities closest to the highest density extraction operations. For the analyses below, census block groups within 2,500’ of ten different Frontline Communities, all located near some of California’s largest oil and gas fields, were manually identified. The selected block groups’ major population centers were all located within the 2,500’ buffers. Unlike the statewide analysis above, the localized analyses below do not assume homogenous population distributions. Using these methods, FracTracker has identified and demographically described some of the most vulnerable California communities most at risk to the impacts of oil and gas extraction. In the maps below, the “case” census block groups used to generate descriptive demographic summaries of at risk communities bordering extraction operations are outlined in pink, while surrounding census block groups are outlined in light blue.
Well Density
The analyses above are important to understand some of the public health risks of living near oil and gas drilling in California. Yet the methods above used statewide aggregation of well counts and static buffers that do not not show the spectrum of risk resulting from well density. Numerous Frontline Communities in California are within 1 mile or even 2,500’ of literally thousands of oil and gas wells. Conversely, there are many census areas in California that have been included within the spatial analysis of the full state, as described above, located near a single low producing well. Therefore the above methods conservatively summarize demographics and dilute the signal of disparate impacts for low income communities of color. Those methods are not able to differentiate between such scenarios as living near one low-producing well in the Beverly Hills golf course versus living in the middle of the Wilmington Oil Field.
As with any toxin, the dosage determines the intensity of the poison. In environmental sciences, increasing exposure to toxins by increasing the number of sources of a toxin can increase the dosage and therefore the severity of the health impact. The impact of well density has been documented in numerous epidemiological studies as a significant indicator of negative health outcomes, including recently published reports from Stanford University and The University of California – Berkeley linking adverse birth outcomes with living near oil and gas wells in California (Tran et. al 2020, Gonzalez et. al 2020). Therefore the rest of this report focuses on the Frontline Communities living near large oil extraction operations–i.e., oil fields with high densities of operational oil and gas wells.
Kern County
Toggle between the sections below by clicking in the upper left corner of the title bar.
Shafter
The City of Shafter, California, is located near more than 100 operational wells in the North Shafter oil field, as shown below in the map in Figure 2. Technically, the wells are located within a donut-shaped census block group (outlined in blue) that surrounds the limits of the urban census block groups (outlined in pink). Shafter’s population of nearly 20,000 is over 86% Latinx, but the surrounding “donut” with just 2,000 people is about 70% Latinx, much wealthier, and with very low population density. The other neighboring rural census areas housing the rest of the Shafter oil field wells follow this same trend.
An uninformed analysis, such as the Kern County EIR, would conclude that the 2,000 individuals who live within the blue “donut” are at the highest risk, because they share the same census designated area as the wells. Notably, the only population center of this census block group (or census tracts, which follow this same trend) is at the opposite end of the block group, farthest from the Shafter oil field. Instead, the most at-risk community is the urban community of Shafter with high population density; the census block groups within the pink hole of the donut contain the communities and homes nearest the North Shafter field.
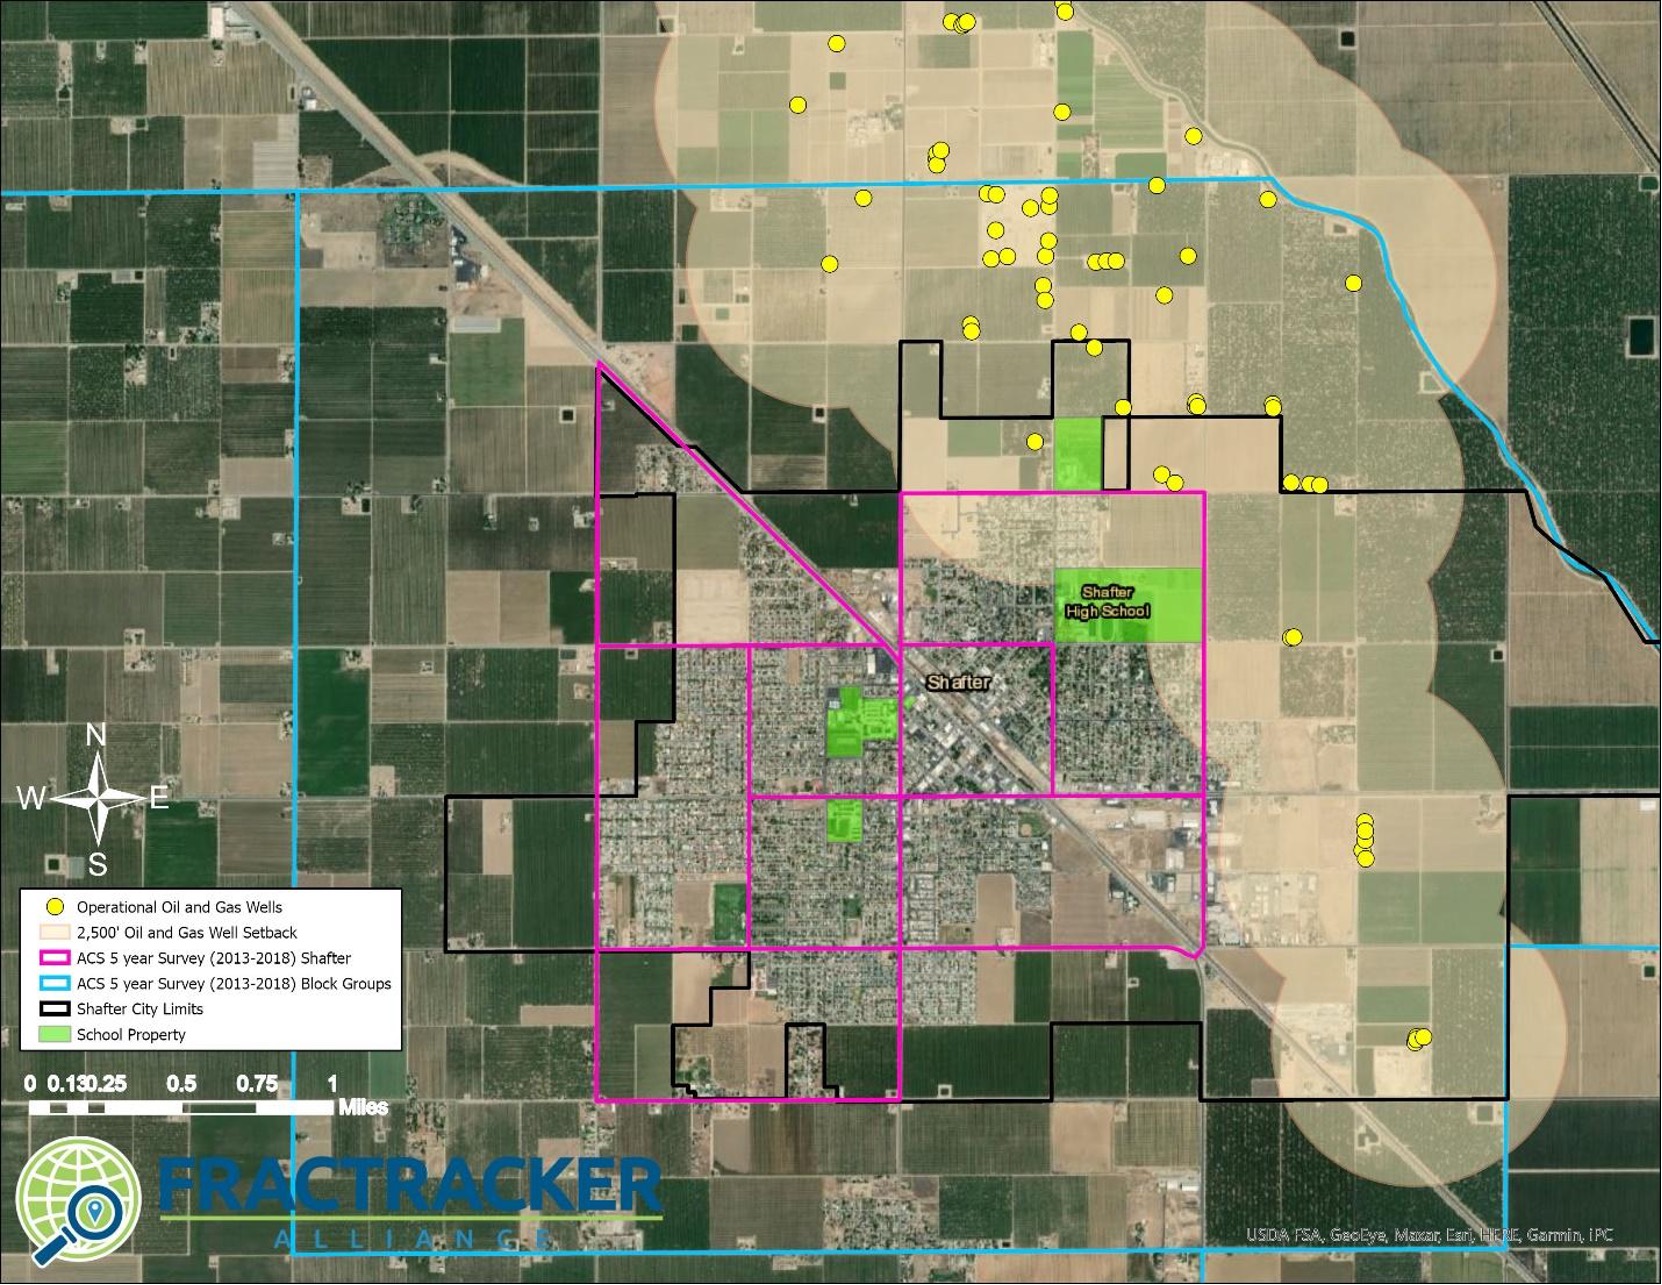
Figure 2. The City of Shafter, California is located just to the south of the North Shafter oil field. The map shows the 2,500’ setback distance in tan, as well as the census block groups in both pink and blue. Pink block groups show the urban case populations used to generate the demographic summaries.
Lost Hills, Arvin, & Taft
The cities of Lost Hills, Arvin, and Taft are all very similar to Shafter. The cities have densely populated urban centers located within or directly next to an oil field. In the maps below in Figures 3 readers can see the community of Lost Hills next to the Lost Hills oil field. Lost Hills, like the densely populated cities of Arvin and Taft, are located very close to large scale extraction operations. Census block groups that include the most impacted area of Lost Hills is outlined in pink, while surrounding low population density census block groups are shown in blue. The majority of the areas outlined in blue are zoned as “estate” and “agriculture” areas. The outlines of the city boundaries are also shown, along with 2,500’ and 1 mile setback distances from currently operational oil and gas wells.
Lost Hills is another situation where a donut-shaped census area distorts the results of low resolution demographics assessments, such as the one conducted by Kern County in their 2020 Draft EIR (PDF pp. 1292-1305). Almost all of the wells within the Lost Hills oil fields are just outside of a 2,500’ setback, but the incredibly high density of extraction operations results in the combined impact of the sum of these wells on degraded air quality. While stringent setback distances from oil and gas wells are a necessary component of environmental justice, a 2,500’ setback on its own is not enough to reduce exposures and risk for the Frontline Community of Lost Hills. For these Frontline Communities, a setback needs to be much larger to reduce exposures. In fact, limiting a public health intervention to a setback requirement alone is not sufficient to address the environmental health inequities in Lost Hills, Shafter, and other similar communities.
Lost Hill’s nearly 2,000 residents are over 99% Latinx, and over 70% of the households make less than $40,000 in annual income (which is substantially less than the annual median income of Kern County households [at $52,479]). The map in Figure 3 shows that the Lost Hills public elementary school is located within 2,500’ of the Lost Hills oil field and within two miles of more than 2,600 operational wells, in addition to the 6,000 operational wells in the rest of the field.
The City of Arvin has 8 operational oil and gas wells within the city limits, and another 71 operational wells within 2 miles. Arvin, with nearly 22,000 people, is over 90% Latinx, and over 60% of the households make less than $40,000 in annual income.
Additionally the City of Taft, located directly between the Buena Vista and Midway Sunset Fields, has a demographic profile with a Latinx population at least 10% higher than the rest of southern Kern County.
Lost Hills, Arvin, and Taft are among the most impacted densely populated areas of Kern County and represent the most Kern citizens at risk of exposure to air quality degradation from oil and gas extraction.
In all of these cases, if only census tract well counts are considered, like in the 2020 Kern County draft EIR, these Frontline Communities will be completely disregarded. Census tracts are intentionally drawn to separate urban/residential areas from industrial/estate/agricultural areas. The census areas that contain the oil fields are very large and sparsely populated, while neighboring census areas with dense population centers, such as these small cities, are most impacted by the oil and gas fields.
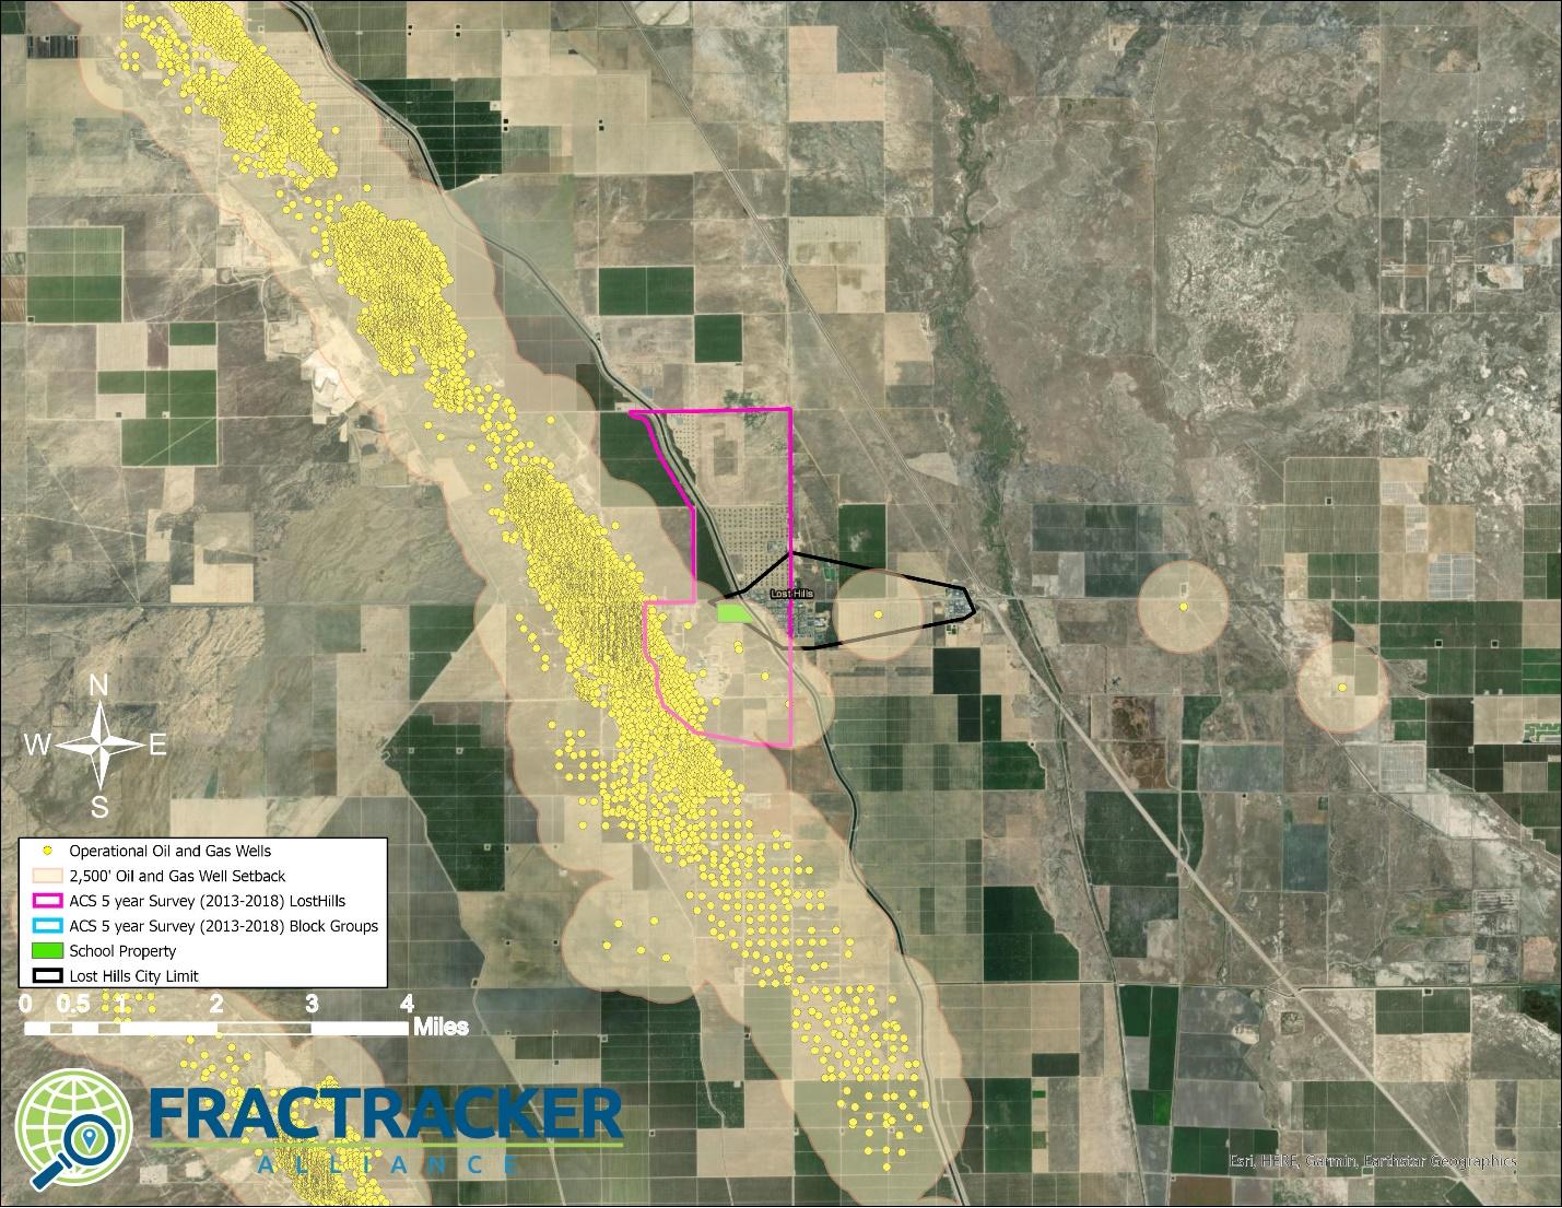
Figure 3. The Unincorporated City of Lost Hills in Kern County, California is located within 2,500’ of the Lost Hills Oil Field. The map shows the 2,500’ setback distance in tan, as well as the census block groups in both pink and blue. Pink block groups show the urban case populations used to generate the demographic summaries.
Bakersfield
The City of Bakersfield is a unique scenario. It is the largest city in Kern County and as a result suburban developments surround parts of the city. Urban flight has moved much of the wealth into these suburbs. The suburban sprawl has occurred in directions including North toward the Kern River oil field, predominantly on the field’s western flank in Oildale and Seguro. In the map below in Figure 4, these areas are located just to the north of the Kern River.
This is a poignant example of the development of cheap land for housing developments in an area where oil and gas operations already existed; an issue that needs to be considered in the development of setbacks and public health interventions and policies. This small population of predominantly white, middle class neighborhoods shares similar risks as the lower-income Communities of Color who account for the majority of Bakersfield’s urban center. Even though these suburban communities are less vulnerable to the oppressive forces of systemic racism, real estate markets will continue to prioritize cheap land for development, moving communities closer to extraction operations.
Regardless of the implications of urban sprawl and suburban development, it is important to no disregard the risks to the demographics of the at-risk areas of the city of Bakersfield are predominantly Non-white (31%) and Latinx (60%), particularly as compared to the city’s suburbs (15% Non-white and 26% Latinx). About 33,000 people live in the city’s northern suburbs, and another 470,000 live in Bakersfield’s urban city center just to the south of the 16,500 operational wells in the Kern River, Front, and Bluff oil fields. The urban population of Bakersfield is a large Frontline Community exposed to the local and regional negative air quality impacts of the Kern River and numerous other surrounding oil fields.
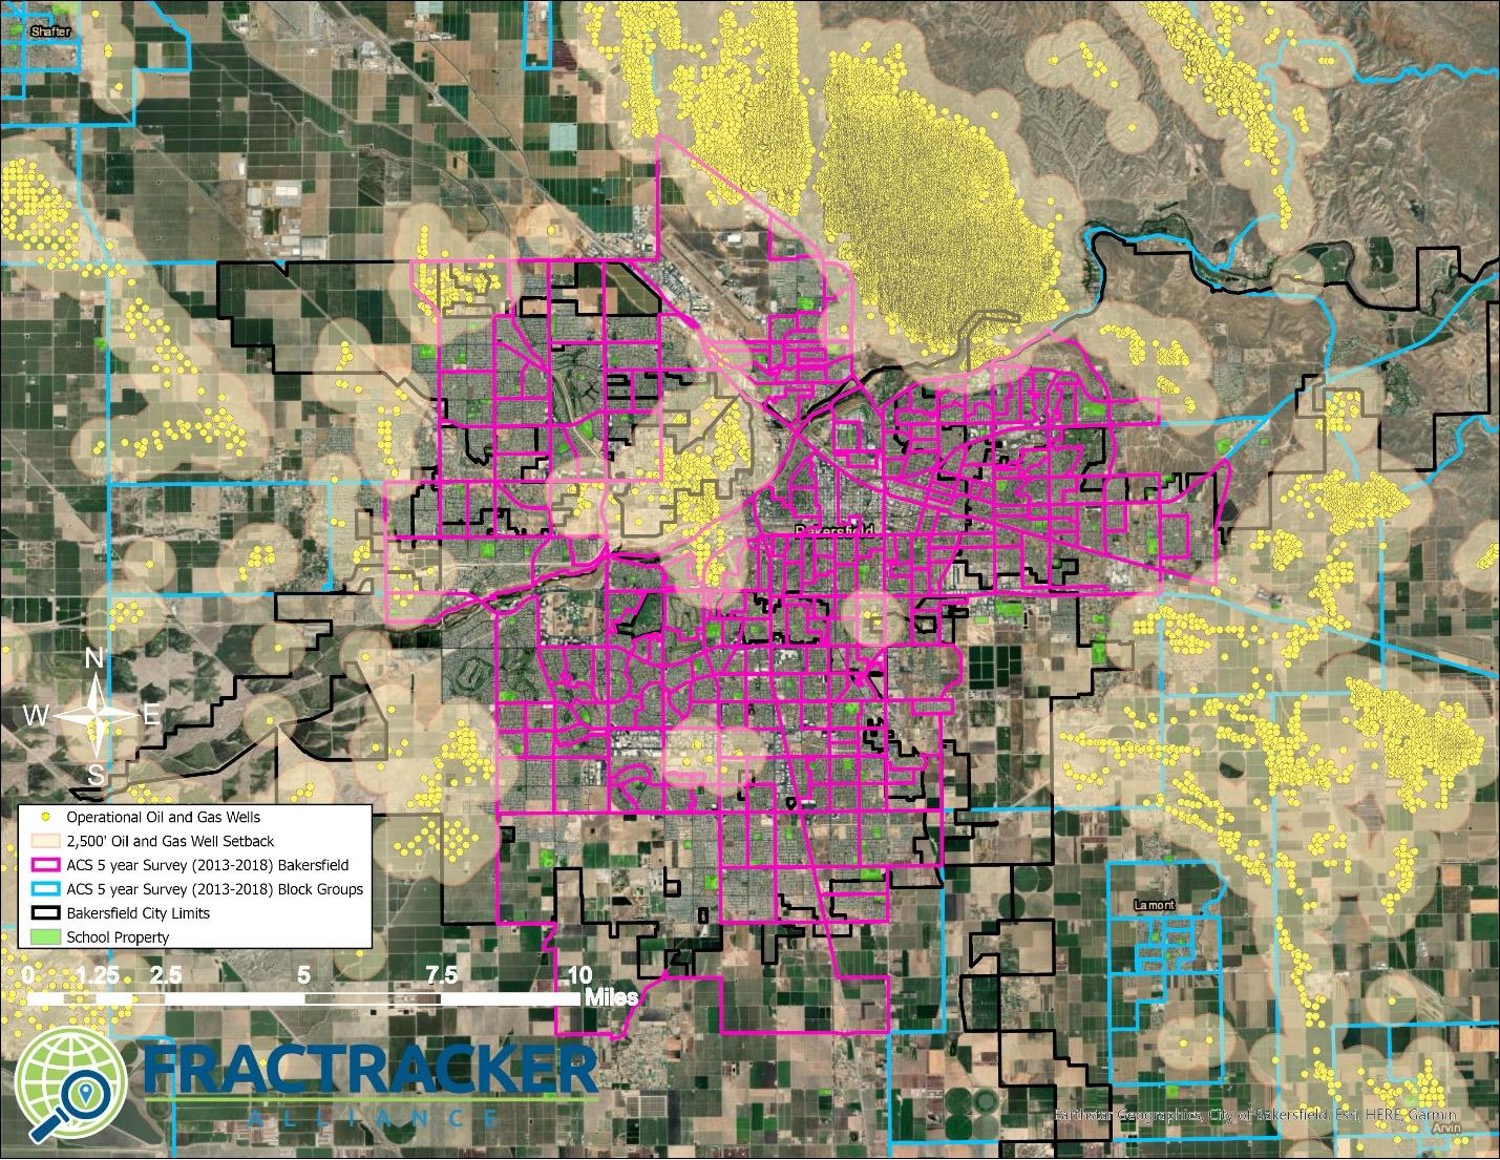
Figure 4. Map of the city of Bakersfield in Kern County, California located between several major oil fields including the Kern Front oil field. The map shows the 2,500’ setback distance in tan, as well as the census block groups in both pink and blue. Pink block groups show the urban case populations used to generate the demographic summaries.
Southern California
Ventura
The City of Ventura and the proximity of the Ventura oil field is a similar situation to cities in Kern. The urban center of Ventura is bisected by the Ventura oil field’s nearly 1,200 operational wells. While over 70% of the city’s population is Latinx, the very sparsely populated census areas also containing portions of the oil field are 34% Latinx.
In the map below in Figure 5, take note of the population distribution within the portion of the city closest to the oil field versus the census areas to the east. While a statewide or less granular analysis would assume an evenly distributed population density, in this localized analysis, it is clear that the most vulnerable Frontline Communities are the urban centers closest to the oil fields. Even though the census blocks to the east contain oil and gas wells, the populations are less at risk because the population centers are located farther from the oil field.
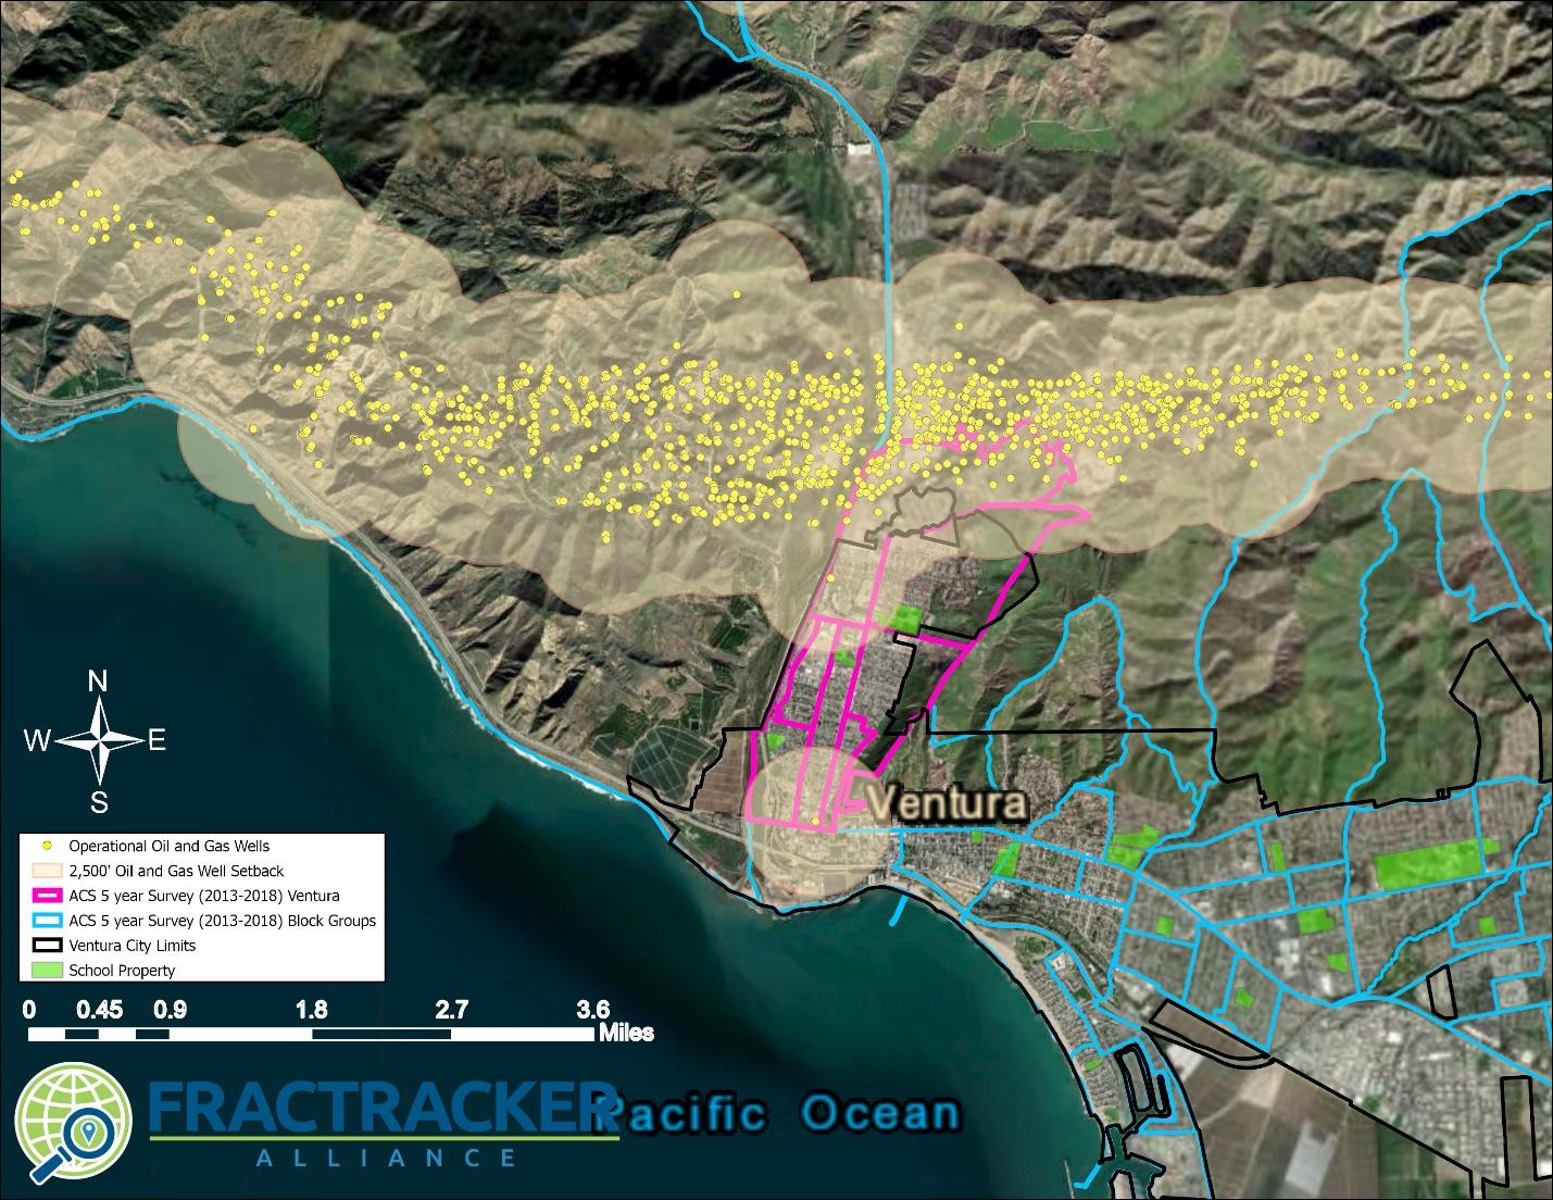
Figure 5. Ventura Oil Field in Ventura, California census areas within the 2,500’ setback area. The map shows the 2,500’ setback distance in tan, as well as the census block groups in both pink and blue. Pink block groups show the urban case populations used to generate the demographic summaries.
Los Angeles
In Los Angeles County, Inglewood, Wilmington, Long Beach, and Los Angeles City are some of the largest oil and gas fields. There are many areas in Los Angeles where a single low-producing well is located in an upper middle class suburb, on a golf course, or next to the Beverly Hills High School.
While all well sites present sources of exposure to volatile organic compounds (VOCs) and other air toxics, these four oil fields have incredibly high densities of oil and gas wells in urban neighborhoods. The demographics of the Frontline Communities located within 2,500’ of these major fields are presented below in Table 4. These areas are additionally lower income communities; for example, over 50% of annual household incomes in the census areas surrounding the Los Angeles City oil field are below $40,000, while the Los Angeles County median annual income is over $62,000.
Table 4. Demographics for Frontline Communities living within 2,500’ of Los Angeles’s major oil and gas fields along with counts of operational wells in the fields are shown in the table. The demographic “Latinx” is the count of “Hispanic or Latino Origin” population, and “non-white” was calculated by subtracting “white only” from “total population.”
| Oil Field | Well Count | Non-white (%) | Latinx (%) |
| Inglewood | 914 | 62% | 11% |
| Wilmington | 2,995 | 56% | 63% |
| Long Beach | 687 | 50% | 30% |
| Los Angeles City | 872 | 69% | 59% |
| Ventura | 1,193 | 10% | 72% |
Toggle between the sections below by clicking in the upper left corner of the title bar.
Inglewood
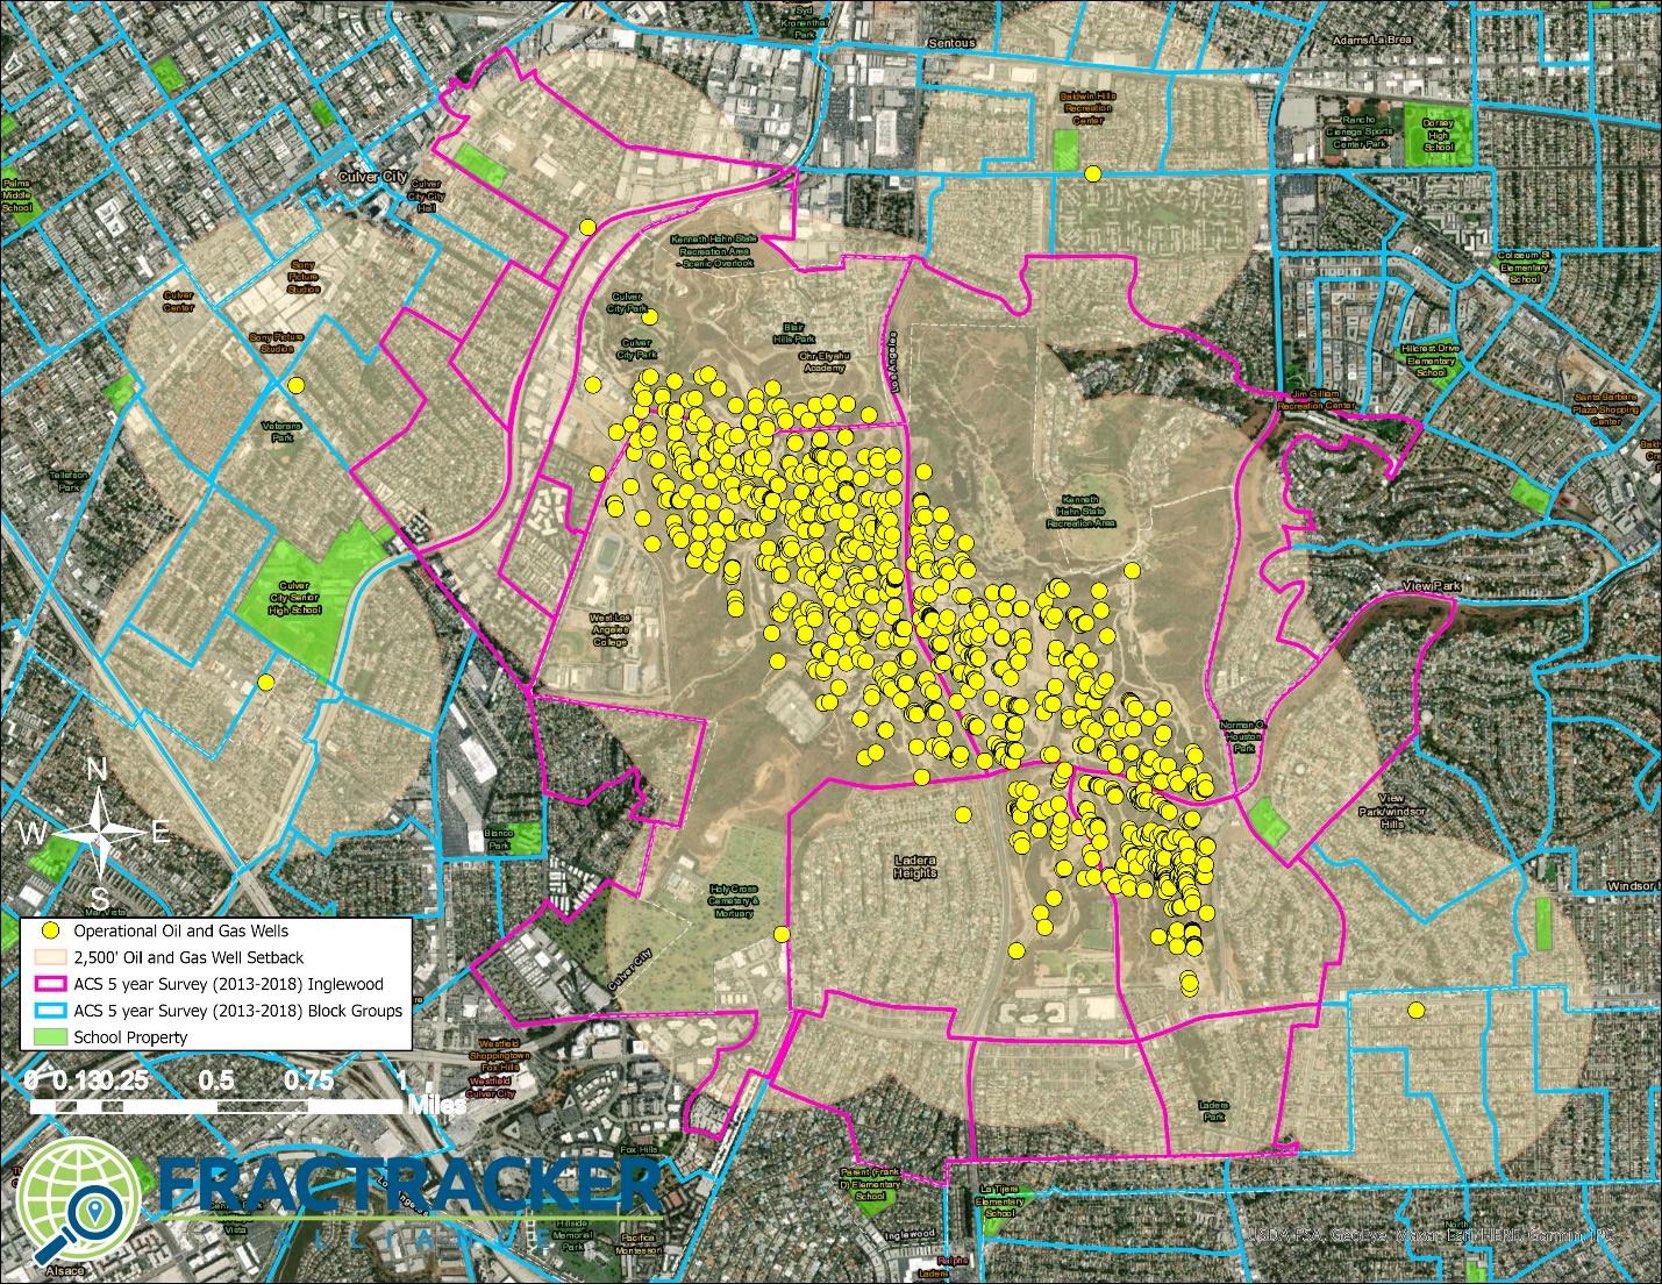
Figure 6. Inglewood Oil Field Frontline Community, Inglewood, California census areas within a 2,500’ setback area. The map shows the 2,500’ setback distance in tan, as well as the census block groups in both pink and blue. Pink block groups show the urban case populations used to generate the demographic summaries.
Wilmington
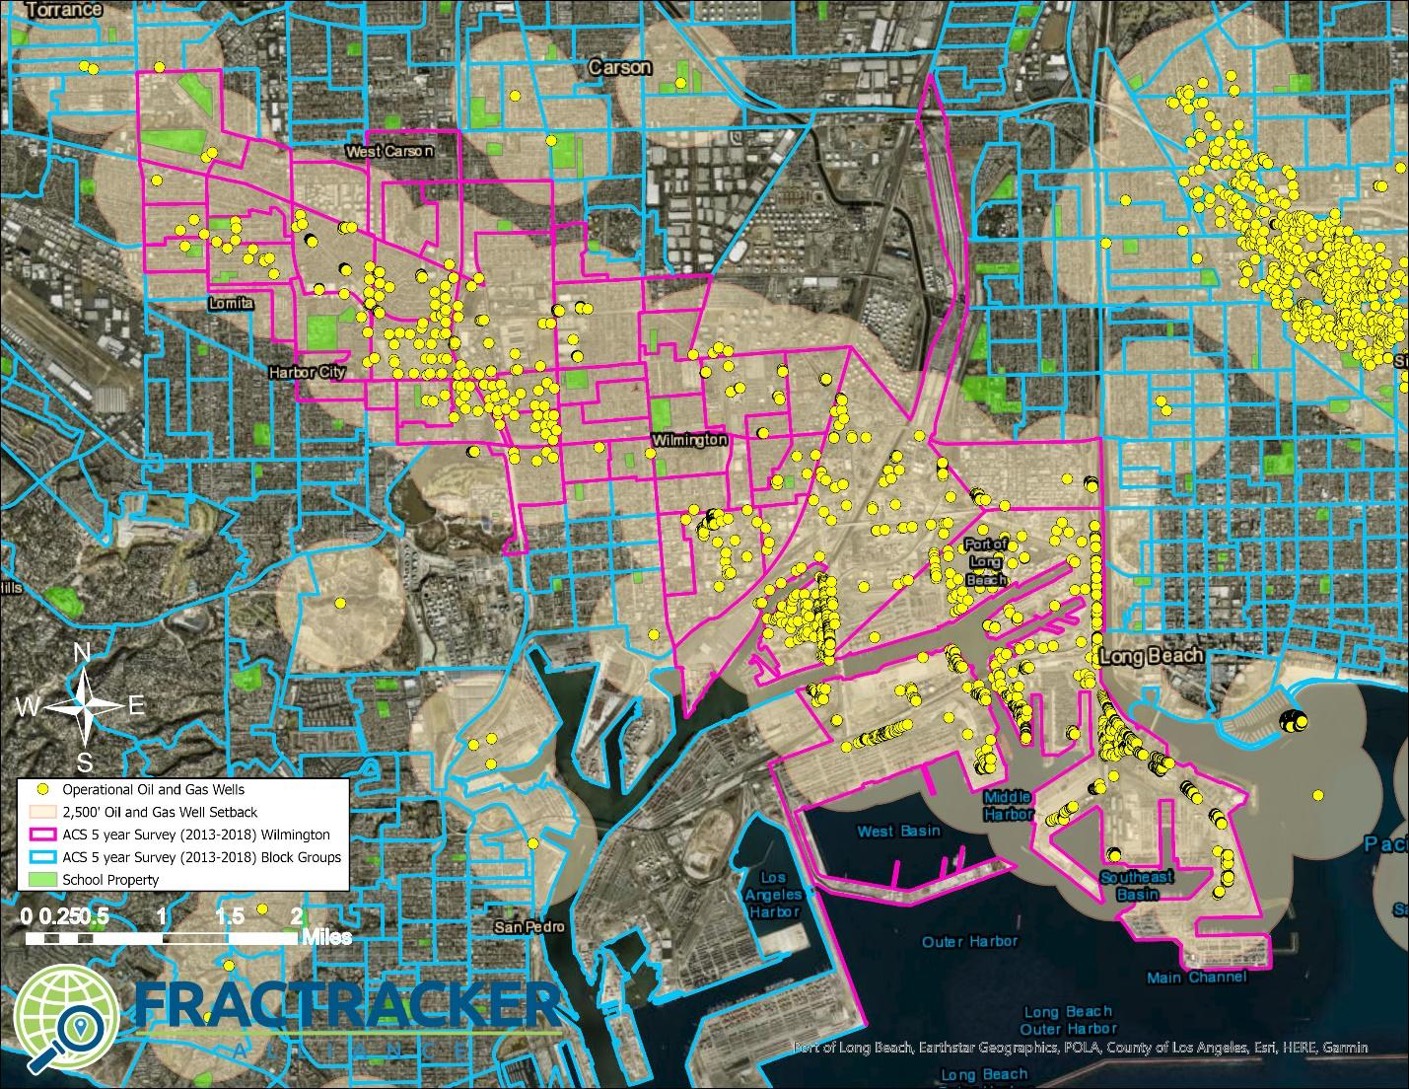
Figure 7. Wilmington Oil Field Frontline Community, Wilmington, California census areas within a 2,500’ setback area. The map shows the 2,500’ setback distance in tan, as well as the census block groups in both pink and blue. Pink block groups show the urban case populations used to generate the demographic summaries.
Long Beach
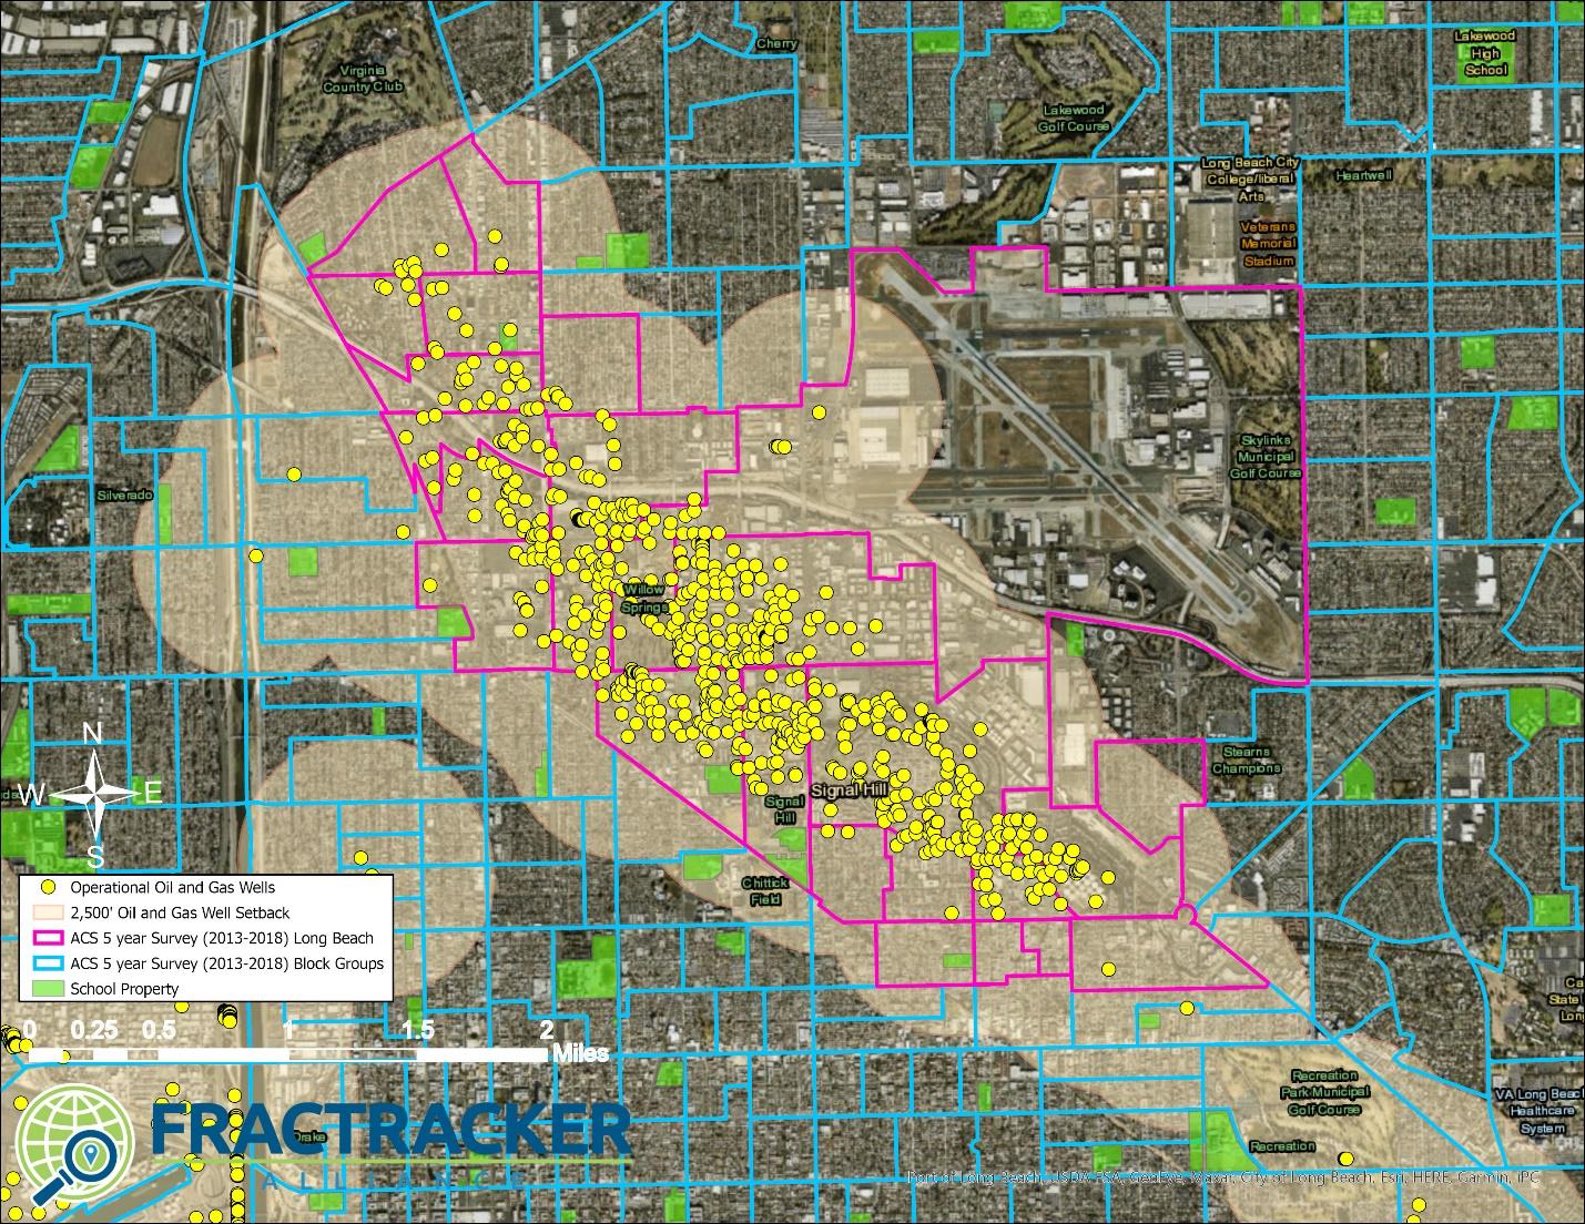
Figure 8. Long Beach Oil Field Frontline Community, Long Beach, California census areas within a 2,500’ setback area. The map shows the 2,500’ setback distance in tan, as well as the census block groups in both pink and blue. Pink block groups show the urban case populations used to generate the demographic summaries.
Los Angeles City
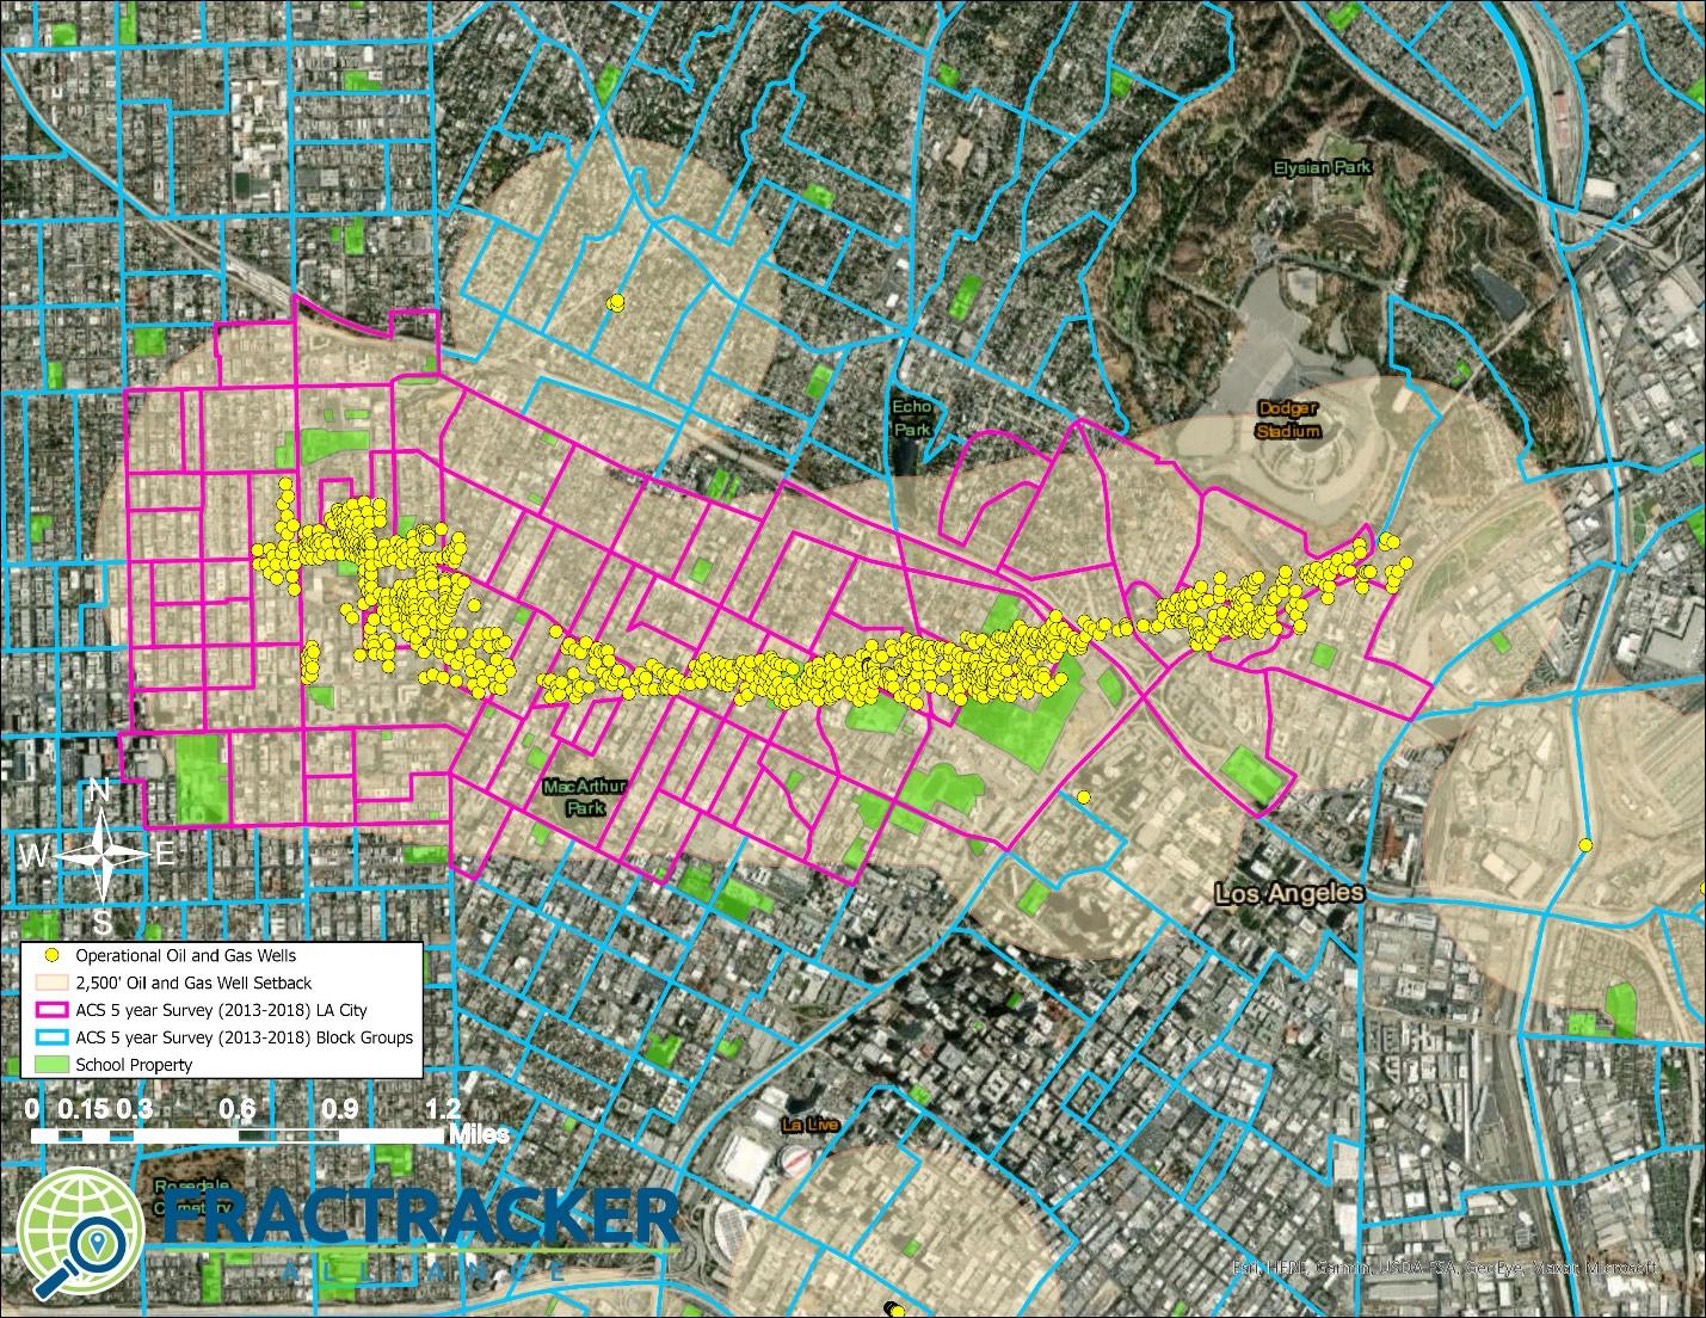
Figure 9. Los Angeles City Oil Field Frontline Community census areas within a 2,500’ setback area. The map shows the 2,500’ setback distance in tan, as well as the census block groups in both pink and blue. Pink block groups show the urban case populations used to generate the demographic summaries.
Production
The creation of public health policies such as 2,500’ setbacks to help protect Frontline Communities is controversial in California as many state legislators are still beholden to the oil and gas industry. The industry itself pushes back strongly against any proposal that could affect their bottom line, no matter how insignificant the financial impact may be. When AB345 was proposed, the industry’s lobbying organization Western States Petroleum Association claimed that institution of 2500’ setbacks would immediately shut down at least 30% of California’s total oil production. This number is an outright fabrication.
As shown in Table 1 above, a 2,500’ setback would impact the less than 9,000 active and new wells; 42% in Kern County and 29% in Los Angeles County. Ventura and Orange Counties are a distant 3rd and 4th, respectively. These counts are further broken down by field in Table 5 below. Statewide these wells accounted for just 12.8% of California’s current oil production by volume (as reported in barrels of oil/condensate by CalGEM), which is much smaller than the wholly unsubstantiated 30% decline claimed by industry.
Table 5. Counts of wells by well status for operational (active, idle, and new) oil and gas wells located within a 2,500’ setback. Fields include the count of wells within the 2,500’ setback and the amount of oil produced from those wells within the setback. The percentage of total oil from that field is also included.
| Oil Field | County | Well Count | Well Ct % of Total | 2019 Oil Prod (BBLS) | Oil Prod % of Total |
| Wilmington | Los Angeles | 2,514 | 83% | 2,292,669 | 22% |
| Kern River | Kern | 1,338 | 9% | 2,121,071 | 12% |
| Inglewood | Los Angeles | 891 | 97% | 1,806,354 | 96% |
| Midway-Sunset | Kern | 1,892 | 10% | 1,614,081 | 8% |
| Ventura | Ventura | 287 | 24% | 1,202,764 | 31% |
| Long Beach | Los Angeles | 687 | 100% | 1,036,506 | 100% |
| Brea-Olinda | Los Angeles | 695 | 97% | 967,223 | 95% |
| Huntington Beach | Orange | 528 | 83% | 753,494 | 42% |
| Placerita | Los Angeles | 448 | 100% | 508,182 | 100% |
| Santa Fe Springs | Los Angeles | 304 | 99% | 421,719 | 72% |
| Cat Canyon | Santa Barbara | 115 | 10% | 418,697 | 36% |
| Beverly Hills | Los Angeles | 156 | 100% | 351,877 | 100% |
| McKittrick | Kern | 334 | 18% | 346,738 | 10% |
| Montebello | Los Angeles | 227 | 98% | 318,657 | 97% |
| Fruitvale | Kern | 286 | 80% | 316,184 | 75% |
| San Ardo | Monterey | 180 | 13% | 313,339 | 4% |
| Torrance | Los Angeles | 219 | 100% | 307,413 | 100% |
| Seal Beach | Los Angeles | 175 | 88% | 282,790 | 74% |
| Shafter, North | Kern | 70 | 78% | 267,256 | 66% |
| Edison | Kern | 520 | 41% | 261,098 | 39% |
| Brentwood | Contra Costa | 4 | 100% | 230,868 | 100% |
| Oxnard | Ventura | 124 | 82% | 214,884 | 100% |
| Sansinena | Los Angeles | 162 | 100% | 207,474 | 100% |
| Poso Creek | Kern | 320 | 16% | 193,533 | 4% |
| Rosecrans | Los Angeles | 94 | 100% | 174,720 | 100% |
| Rio Bravo | Kern | 80 | 74% | 166,444 | 82% |
| Richfield | Orange | 231 | 100% | 165,426 | 100% |
| Coyote, East | Orange | 81 | 100% | 163,639 | 100% |
| San Vicente | Los Angeles | 48 | 100% | 162,940 | 100% |
In the case that setback regulations are crafted both to prohibit new drilling and to phase out existing operations within the setback distance, the industry would have the opportunity to respond with measures that preserve the majority of production volumes, particularly in the Central Valley. For example, in Kern County, the overwhelming majority of new wells drilled in 2020 are directional or horizontal; these drilling technologies would allow operators to access the same below ground resources from surface locations that are further away from and safer for communities. Further, for existing wells within the 2,500’ setback, current proposals would institute a phase out period. Existing wells could be allowed to continue to operate under the terms of their current permits but not allowed to expand or rework their operations to increase or extend production; alternatively (or in addition), well operators could continue for a prescribed timeframe formulated to allow them to recoup their investment (called “amortization”).
Los Angeles
It is clear that the oil fields of Los Angeles would be the most impacted if setbacks phased out the wells responsible for the highest risk to Frontline Communities. The majority of Los Angeles’s urban oil fields are located entirely within 2,500’ of homes, schools, healthcare facilities and daycares.
As shown above in Table 5, wells within the setback produce 96% of the oil in the Inglewood fields, 84% in the Long Beach field, and 100% of the oil in several other smaller fields. With the phase out of these wells, oil extraction would cease in these fields. Most of these fields produce very low volumes of oil and already have high counts of idle wells, 28% idle in Wilmington, 25% in Inglewood, and 56% in Long Beach for example. The sole outlier of this trend is the Wilmington field. The majority of production in the Wilmington field comes from wells located in the Long Beach harbor, enough of them located outside of the 2,500’ setback such that while 83% of the Wilmington field wells are within the 2,500’ setback, these wells account for only 22% of the field’s overall production.
Kern County
The situation in Kern County is quite the opposite of Los Angeles, where the majority of operational wells are located within 2,500’ of homes, residences, and other sensitive receptors like healthcare facilities. In Kern, the overwhelming majority of wells are located beyond 2,500’ and even 1 mile from sensitive receptors. While the Midway-Sunset and Kern River fields have the most wells within the 2,500’ setback area, those wells make up a small percentage of the total operational wells in the fields. As can be seen in the map in Figure 1, wells within the 2,500’ setback zone in the large Kern oil fields are entirely located on the borders of the fields. Overall, a 2,500’ setback in Kern County would only affect 7.1% of active/new wells, accounting for 5.97% of the county’s production.
The oil and gas industry and operators in states including Texas, Colorado, North Dakota, Pennsylvania, Ohio, West Virginia, New Mexico, and Oklahoma are very vocal of their ability to avoid surface disturbance and target oil and gas pools located under sensitive receptors (homes, schools, healthcare facilities, endangered species habitat etc.) using directional drilling. According to the industry, directional drilling has been used for nearly a century to extract resources from areas where surface disruption would impact sensitive communities and habitats.
The same is true for California, especially in Kern County and especially recently. An October 2020 draft environmental impact report by the Kern County Planning and Natural Resource Department disclosed that in a dataset of 9,803 wells drilled from 2000 to 2020 by the California Resources Corporation, the majority of wells were drilled directionally (46%) or horizontally (10%), as opposed to vertically. More recent wells in the County have utilized directional and horizontal drilling even more heavily: a 2020 dataset of wells drilled county-wide indicates that 76% were drilled directionally and an additional 7% were drilled horizontally; only 17% were drilled vertically. These statistics indicate that, even if all wells neighboring Frontline Communities in Kern County were to be phased out (itself a small percentage of the total number of wells in the county), there would only be a small impact on Kern County oil production owing to the prevalence of non-vertical techniques that allow operators the flexibility to access reserves from different surface locations. As noted previously, if all oil production from within the 2,500’ setback zone were to be immediately eliminated statewide, it would mean a maximum decrease of just 12.8% of California’s current annual oil production. But the availability of directional and horizontal drilling in Kern County, where the lion’s share of all drilling statewide occurs, means it is more likely that the decrease in production will be significantly less than 12.8% and likely much less than 10%.
Existing Well Phase Out
Any assertion that a 2,500’ setback would immediately affect oil production is baseless because current setback proposals would institute a phase out period for existing wells. For example, existing permitted wells could be allowed to continue to operate under the terms of their current permits but not allowed to expand or rework their operations to increase or extend production. Alternatively, under a policy approach known as amortization, well operators could continue for a prescribed timeframe formulated to allow them to recoup their investment.
If wells within the setback distance are phased out pursuant to a “no rework” policy, operators would be afforded some time to maximize production in order to ensure that operators receive a sufficient return on their investment under the terms of their existing permits before they shut down. Under such an approach, older wells with increasing risks of fugitive emissions through leaks at the surface and well casing failures could be sequentially phased out by placing a ban on rework permits not required for maintenance or safety. CalGEM permitted well reworks, including sidetracks and deeper drills, increase production and the lifespan of wells. The catalog of rework permits can be found on the CalGEM website.
Based on CalGEM’s production data from 2018 and 2019, a phase out effectuated by disallowing well reworks would result in an annual reduction of less than 1% of total oil production. Of the 52,997 wells reporting oil/condensate production volumes in 2018, 338 received a rework permit in the same year. In 2019, of the 48,860 wells reporting oil production volumes, 285 received rework permits. By volume, the wells that received rework permits accounted for 0.87% of oil production in 2018 and just 0.04% in 2019.
Conclusion
The oil and gas industry in California has consistently pushed back against Frontline Communities who demand public health protections against emissions from oil and gas operations. This occurs even when there will be little to no impact reducing production. It is an industry policy to refuse any concessions and oppose all measures, even to protect public health, by leveraging the industry’s wealth at every level of the political hierarchy.
Fatefully, 2020 has resulted in multiple wins for public health in California. While the failure of AB345 made it clear that the California state legislature is still beholden to the fossil fuel industry, the momentum has continued. Community grassroots groups in Ventura County successfully passed a 1,500’ setback ordinance for occupied dwellings and 2,500’ setbacks for sensitive receptor sites including healthcare facilities and schools. Just south of Ventura, the County of Los Angeles is also in the midst of a rule-making process that is considering multiple setbacks, including 1,000’ to 2,500’ distances. And a committee of the Los Angeles City Council just voted to develop a proposal that would phase out oil drilling across the city as a non-conforming use.
While Ventura and Los Angeles are making progress, Kern County is creating a new process to streamline oil and gas well permitting and has even proposed to decrease the existing zone-specific 300’ setbacks from homes to 210’.
Kern County Frontline Communities and the rest of California also deserve the same consideration as residents of Ventura and Los Angeles Counties. The research is clear that a setback of at least one mile in addition to more site specific public health interventions are necessary to reduce the negative health impacts resulting from these industrial operations within and neighboring Frontline Communities.
By Kyle Ferrar, Western Program Coordinator, FracTracker Alliance
Our home is less than .25 mile from entrance to Brea Olinda Oil and Gas Fields (since 1986)
In 2017 Linn sold its lease rights to Bridge Energy, LLC.
Since that transition we have witnessed the degradation of the Brea Hills, expanded 24 hour/7days p/wk activities. Several towers have popped up and commercial diesel fueled vehicles trafficking in and out via Site Dr. behind our home 24/7.
I personally suffer chronic asthma, headaches, eyes burning, and frequently smell odd burned type odors late at night into early morning hours.
City of Brea and/or County of Orange allow these activities to continue unchecked and unmonitored. Despite our close proximity and a few complaints we are not provided any information or protection with regard to the oil fields’ activities.
It’s unacceptable!
SHAME ON OUR CITY OF BREA MAYOR AND COUNCIL MEMBERS AND THE COUNTY OF ORANGE, FOR FAILING TO INFORM AND PROTECT IT’S CITIZENS WHO ARE CONTINOUSLY EXPOSED TO HARMFUL TOXINS!
Hi Jana,
Thank you so much for sharing your experience of living near neighborhood drilling with our audience. It is clear that oil companies are not being held accountable for the negative environmental health impacts they are causing in California. To change this, the coalition called VISION is pushing hard to establish public health setbacks for drilling new wells and to phase out existing extraction near communities. To lend your support to this movement, please take a moment to let Governor Newsom and regulators know what’s at stake. You can submit a letter to do just that here: https://actionnetwork.org/letters/no-drilling.
In solidarity!
Kyle Ferrar
Western Program Manager
FracTracker Alliance