Marcellus Shale Violations by Drilling Operator
DEP violations for Marcellus Shale gas wells, January 1, 2007 through September 30, 2010.
With updated Marcellus Shale violation, production, and well data for Pennsylvania on our DataTool, it is now possible to determine which of the drilling operators are the best and worst corporate citizens.
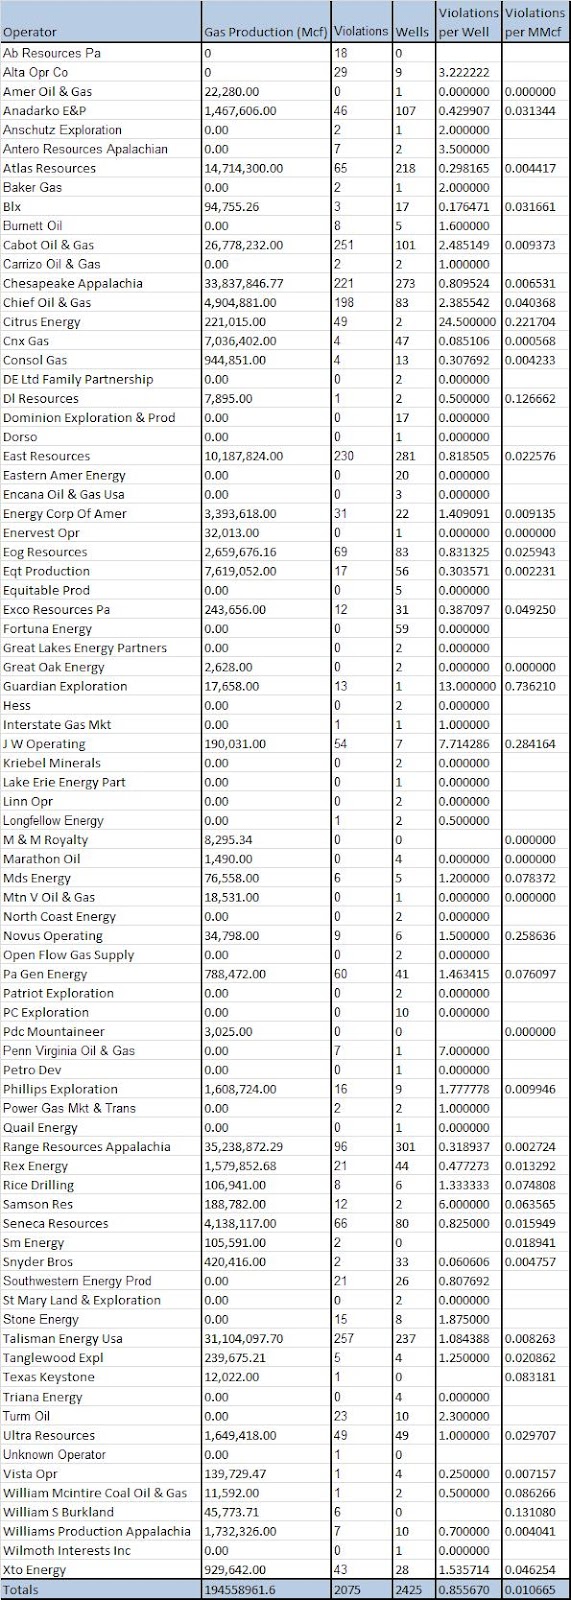
Pennsylvania Marcellus Shale Violations Data by Operator. Please note that for gas production values, Mcf refers to thousands of cubic feet, while MMcf means millions of cubic feet.
Although it runs the risk of being overwhelming, I wanted to provide our readers with the ability to browse the full list of data that I have assembled. It is too easy to think of the natural gas industry as a homogeneous entity in terms of their impact on the environment and communities, but in reality, different drillers have different track records. It is important to have the ability to judge each company separately, and now we have means of doing so.
Each of the three assembled categories above are based on the most complete information that we have, but I should note that they are not from the same time frame. The Marcellus Shale production data is from July 1, 2009 through June 30, 2010; the violations were issued between January 1, 2007 and September 30, 2010; and the wells column contains all spudded Marcellus wells from 2006 through November 3, 2010. Since all operators are evaluated the same way, I did not feel it was necessary to limit this review to data to the small period of time when these three sets were overlapping (1).
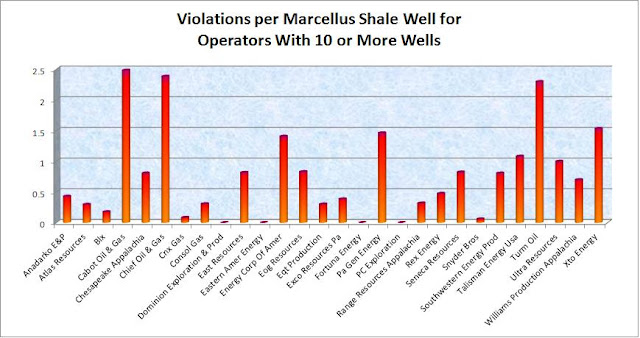
Clearly there is tremendous diversity in how many violations per well each company has. The top three offenders in this category–Cabot Oil and Gas, Chief Oil and Gas, and the somewhat ironically named Turm Oil–all have an average of over two violations per well. Referencing the chart above, Cabot and Chief have moderately high numbers of wells, and Turm has just a handful (2). Among the companies with over 200 Marcellus Shale wells, Range Resources and Atlas both have fewer than one violation per three wells, Chesapeake and East Resources both have a violation for about eight out of ten wells, and Talisman averages over a violation per well.
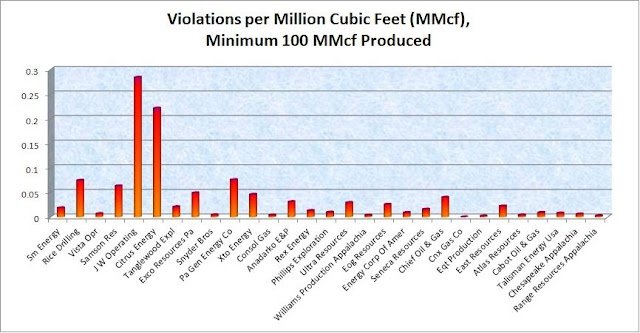
The number of violations per well is perhaps the most straightforward analysis of how seriously drilling operators treat their responsibilities to the rest of us, but it does not account for variances in the wells themselves. If you browse at the production data, clearly some of these wells are Thoroughbreds, while others are mules. One could therefore make the argument that the high producing wells are “worth” the extra violations that they might incur, because the production might equal that of several other less difficult ones. And, whether or not that is is the case, comparing violations to production instead of the number of wells acts as a sort of cost/benefit analysis of what these drilling companies have to offer Pennsylvania.
The top violators in this category are JW Operating with over 0.28 violations per million cubic feet (MMcf) and Citrus Energy with more than 0.22 violations per MMcf. Among the operators that produced at least 100 million cubic feet (3) of natural gas, the next closest is 0.08 violations per MMcf. There are six operators in the state that produced at least 10 billion cubic feet (Bcf) from Pennsylvania’s Marcellus Shale in the given time frame, and all of them have violations per MMcf values under 0.025.
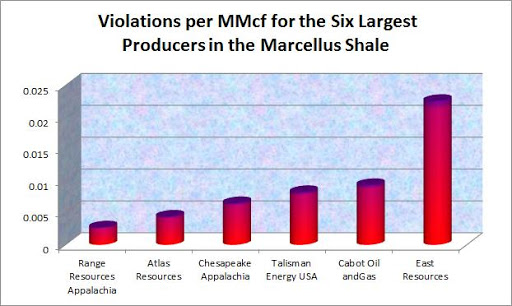
Violations per MMcf for all opoerators producing at lest 10 Bcf from the Marcellus Shale in Pennsylvania between July 1, 2009 and June 30, 2010.
Although all of these six values are well below the worst offenders (4), there is still quite a range of values, with East Resources committing over eight times as many violations per MMcf as Range Resources. While the largest drilling operators are more likely to have the resources to conduct their business properly, it is clearly more a priority for Range Resources and Atlas than for the rest of the pack.
1. There probably are some effects related to time that are reflected in the data. For example, if a well transfers hands from one operator to another, violations and production for the same well would be attributed to different operators.
2. This chart includes only those with a minimum of ten wells in order to make a more manageable display. This had the added effect of removing some of the outliers, such as Citrus Energy’s 24.5 violations per well. Some operators have violations but no wells. Perhaps they are subcontractors, but I have no information on that at this time.
3. As above, this cutoff was made for manageability of the chart display, and also trims outliers with low sample sizes.
4. Also, all but East Resources are below the statewide average of 0.01 violations per MMcf.
>Excellent idea, the performance list should be made highly visible to the public. Provides an opportunity to identify those companies who have no respect for environmental safety. Might also encourage the industry to bring greater pressure to bear upon careless employees, who cause company violations. Knowing that performance is held up to public scrutiny in a review with your peers. Shareholders in some of these companies, should be concerned about the risks to their investment.
>I wish for a tally of how many current and future lives will be caused suffering as a result of this "oh so wonderful" gas bounty. The drillers should have to pass a test where they prove to a DEP emplyee they can administer a well operation from begining to end without adverse effects on wildlife and humans. Just because profits are high does not mean community inhabitants are more disposable!
>Thanks for posting this.
I wish someone would come up with the total number of gallons of fresh water destroyed (ie 6-10Mil gallons x number of fracks), which are not considered violations, but "just" part of the process.
Ann F
>Thanks for the analysis. That is what I was trying to show. Using production rather than number of wells makes sense. Also, I wonder about the classification of administrative and health and safety violations. Some administrative violations (Improper encapsulation of waste, Failure to maintain 2' freeboard in an impoundment) seem like they could have serious consequences.