LNG 101: A Guide to Liquefied Natural Gas
A Complete Guide to the Costs, Risks, and Realities of Fracked Gas Exports
A Complete Guide to the Costs, Risks, and Realities of Fracked Gas Exports
LNG stands for Liquefied Natural Gas. “Natural gas” is more accurately described as methane or fracked gas. The United States is the world’s largest producer of fracked gas and the largest exporter of LNG.
It is important to remember that LNG’s footprint extends to the rest of the natural gas industry. Extraction of methane gas in the U.S. is primarily done using hydraulic fracturing (fracking) with horizontal unconventional drilling. Most gas extraction occurs in the Barnett Shale region in Texas and the Marcellus Shale region in Appalachia. To make LNG, gas is gathered into a far-reaching network of pipelines that transport the gas to processing plants.

Fracked gas well pad in Wetzel County, WV. Photo credit Bill Hughes, 2014.
Methane gas must be cooled to -260° F to liquefy it, an energy intensive process that allows it to take up 600 times less space than it did when it was in its gaseous state. LNG is different from compressed natural gas (CNG), which is kept under high pressure at room temperature and takes up 100 times less space than it did when it was in its gaseous state. An individual liquefaction unit is called a “train” by the LNG industry. An LNG terminal usually has several trains.
The primary motivation for liquifying fracked gas is for transport and storage. LNG can be transported by cryogenic trucks and large double-hulled refrigerated ships called tankers. Once the LNG reaches its destination, it needs to be turned back into gas (called regasification) and transported by pipeline to customers. LNG customers include power plants, industrial users such as plastic and petrochemical manufacturers, and everyday residential customers.

LNG Process from extraction to end use. Graphic by FracTracker Alliance.
Not all LNG is sold. Some gas power plants perform “peak-shaving” to store gas compactly onsite as LNG for local use during periods of high electricity and residential gas customer demand (for example, when the weather is very hot or cold).

Natural gas power plant in Trumbull County, OH. Photo credit: Ted Auch, 2021.
Additionally, some of the gas that is transported to and from LNG facilities is often consumed to power the liquefaction, regasification, and transportation processes. LNG can also be used to power vehicles. Since LNG must be kept at very cold temperatures to avoid regasification, use as vehicle fuel is limited to heavy duty trucks, buses, and ships.
The LNG industry expanded rapidly after 2010. Fracked gas production increased by 30% during President Obama’s 8-year administration. In 2011 the DOE approved the first U.S. LNG export project, Sabine Pass LNG Terminal in Louisiana. In February 2016, Cheniere Energy Partners loaded the first LNG tanker at Sabine Pass destined for Brazil. Export approvals continued under the first Trump administration and the first portion of the Biden administration.
In January 2024, President Biden’s administration announced a pause on LNG export project approvals to non-free trade agreement (FTA) countries until the Department of Energy (DOE) could update the “underlying analyses for authorizations.” Previous macroeconomic studies had been released in 2012, 2015, and 2018.
The 2024 DOE study presented 600 pages of evidence showing that increasing LNG exports at its current rate would lead to large negative effects for the climate as well as the health and pocketbook of Americans.
The key takeaways new 2024 study were:
In January 2025 the DOE lifted the pause on LNG in compliance with President Trump’s day one Executive Order Unleashing American Energy. In May 2025, a public comment response document—in which FracTracker was mentioned directly—was released for the 2024 study. Contrary to the original well-supported findings of the study, this release declared “LNG supports our economy, strengthens our allies, and enhances national security,” and deemed that U.S. LNG exports are broadly in the best interest of the American public. Export authorizations for a half dozen new LNG terminals and terminal expansions were approved by the DOE throughout the first half of 2025.
The approval and construction process for new LNG projects is complicated and long. Coordination between multiple federal, state, and local agencies must occur, billions of dollars of capital must be raised, a large coastal location with deep port access must be secured, gas supply networks must be designated or built, and customers must be lined up for the final product. Furthermore, most proposed projects face strong community opposition. Understanding the process and terminology can help inform review of LNG related data, news, and announcements and help determine the best places for community engagement or intervention.
Companies seeking to export LNG must apply for authorization through the DOE’s Office of Fossil Energy and Carbon Management (FECM). According to the Natural Gas Act, the DOE must assess whether the export permit is in the interest of the public and whether the import country has a free trade agreement (FTA) with the United States. As of September 2025, the United States has an FTA in place for trade in methane gas with the following countries: Australia, Bahrain, Canada, CAFTA-DR (Costa Rica, Dominican Republic, El Salvador, Guatemala, Honduras & Nicaragua), Chile, Colombia, Israel, Jordan, Korea, Mexico, Morocco, Oman, Panama, Peru, and Singapore. If the U.S. has a FTA with a country, the export application is automatically deemed in the public interest and the DOE is required to approve the application. For export projects to non-FTA countries, the DOE is instructed to assess whether the proposal is consistent with the public interest by conducting an economic and environmental review of the application and ensuring that trade with that country is not explicitly prohibited by law or policy. Most projects apply for both FTA and non-FTA approval to be legally covered to sell LNG anywhere in the world. Import applications from any source are automatically deemed in the public interest and thus approved. In reality, most applications are approved.
To see the DOE’s most current list of LNG export applications, visit:
To see the most current announcements on LNG approvals, visit:
The Federal Energy Regulatory Commission (FERC) has jurisdiction over LNG export facilities, and grants permits for their siting, construction, and operation. FERC is therefore responsible for the environmental impact assessments outlining how the project plans to mitigate impacts to the environment and nearby public consistent with the National Environmental Policy Act (NEPA) and in cooperation with the DOE and Environmental Protection Agency (EPA). Regulators frequently approve LNG project plans even when environmental impact assessments downplay or overlook harms to local communities—favoring industry interests over public health, safety, and environmental justice considerations.
To see the most current list of projects managed by FERC, visit:
Other agencies including the U.S. Coast Guard (USCG), the U.S. Department of Transportation (DOT), and the Pipeline and Hazardous Materials Safety Administration (PHMSA) may also have oversight authority over projects. Local and state approvals and requirements must also be considered.
The long development process itself is broken into several phases, mainly pre- and post-final investment decisions (FID). A FID is the announcement that the company seeking to build the project has financing, a serious intent to construct, and long-term contracts with customers. The company also conducts a front-end engineering design (FEED) study to establish the technical design and overall estimated cost.
A project may have LNG export authorization from the DOE without having reached a FID on the project, considering the length of time and financial cost that go into the construction of a new LNG project. According to the National Center for Energy Analytics, $5 billion in capital is required per billion cubic feet (Bcf) of liquefaction and the construction period for a new terminal typically lasts 3-5 years. After the FID is announced, a contractor is granted an engineering, procurement and construction (EPC) contract to build the facility.
After construction, FERC grants a feedstock permit that allows the facility to start accepting natural gas. This begins the commissioning phase, which aims to test the capabilities of the terminal and correct any unforeseen issues. Long-term multi-decade contracts do not begin until the commissioning phase is completed, and shipments made during the commissioning phase are through contracts to short-term market buyers.
, Federal Energy Regulatory Commission (FERC).")
LNG Project Development Timeline. Data: Department of Energy (DOE), Federal Energy Regulatory Commission (FERC). Graphic: FracTracker Alliance.
U.S. LNG annual imports peaked in 2007 at 771 Bcf. LNG imports declined as domestic gas production and pipeline networks increased. In 2023, the majority of imported LNG was received by Everett LNG near Boston, Massachusetts and sourced from Trinidad, Tobago, and Jamaica. LNG imports remain important to New England during the winter because the region lacks the infrastructure to bring in enough domestic gas. Unlike other parts of the country, New England has no direct pipeline connections to major shale fields, and U.S. shipping laws require special American-built tankers to move LNG between U.S. ports. Since no such ships exist, New England cannot receive LNG from Gulf Coast export terminals and instead relies on imports from overseas to meet peak winter demand.
The LNG export industry has grown dramatically in the United States. In 2016, U.S. export capacity was just 1 Bcf per day. By 2022, the U.S. had become the world’s largest LNG exporter. As of 2024, U.S. LNG exports reached 11.9 Bcf per day. The 2024 DOE studies estimated that if all export projects already approved as of the end of 2024 were built and fully operational, they could consume roughly half of total U.S. natural gas production. This growth has solidified the U.S. as the leading producer and exporter of fracked gas.
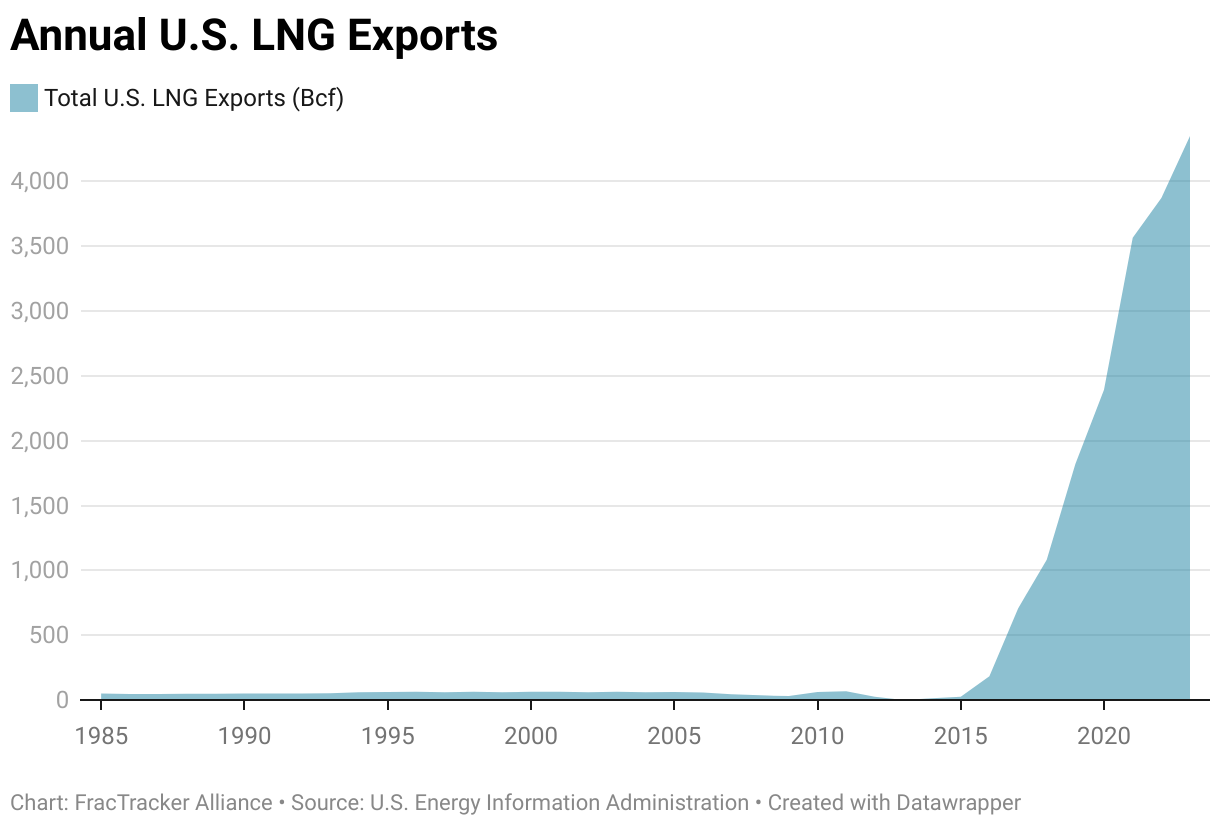
Annual U.S. LNG exports, 1985-2024. Source: EIA. Graphic: FracTracker Alliance.
DOE records show the U.S. exported a total of 4,367 Bcf of LNG to 46 countries by ISO container, truck, and vessel in 2024. This equated to approximately 10% of total U.S. natural gas production in 2024. EIA analysis reveals that 53% (6.3 Bcf per day) of that gas was sent to Europe (including Türkiye) and 33% (4 Bcf per day) was sent to Asia, with the remainder going to destinations including the Middle East, North Africa, and Latin America.
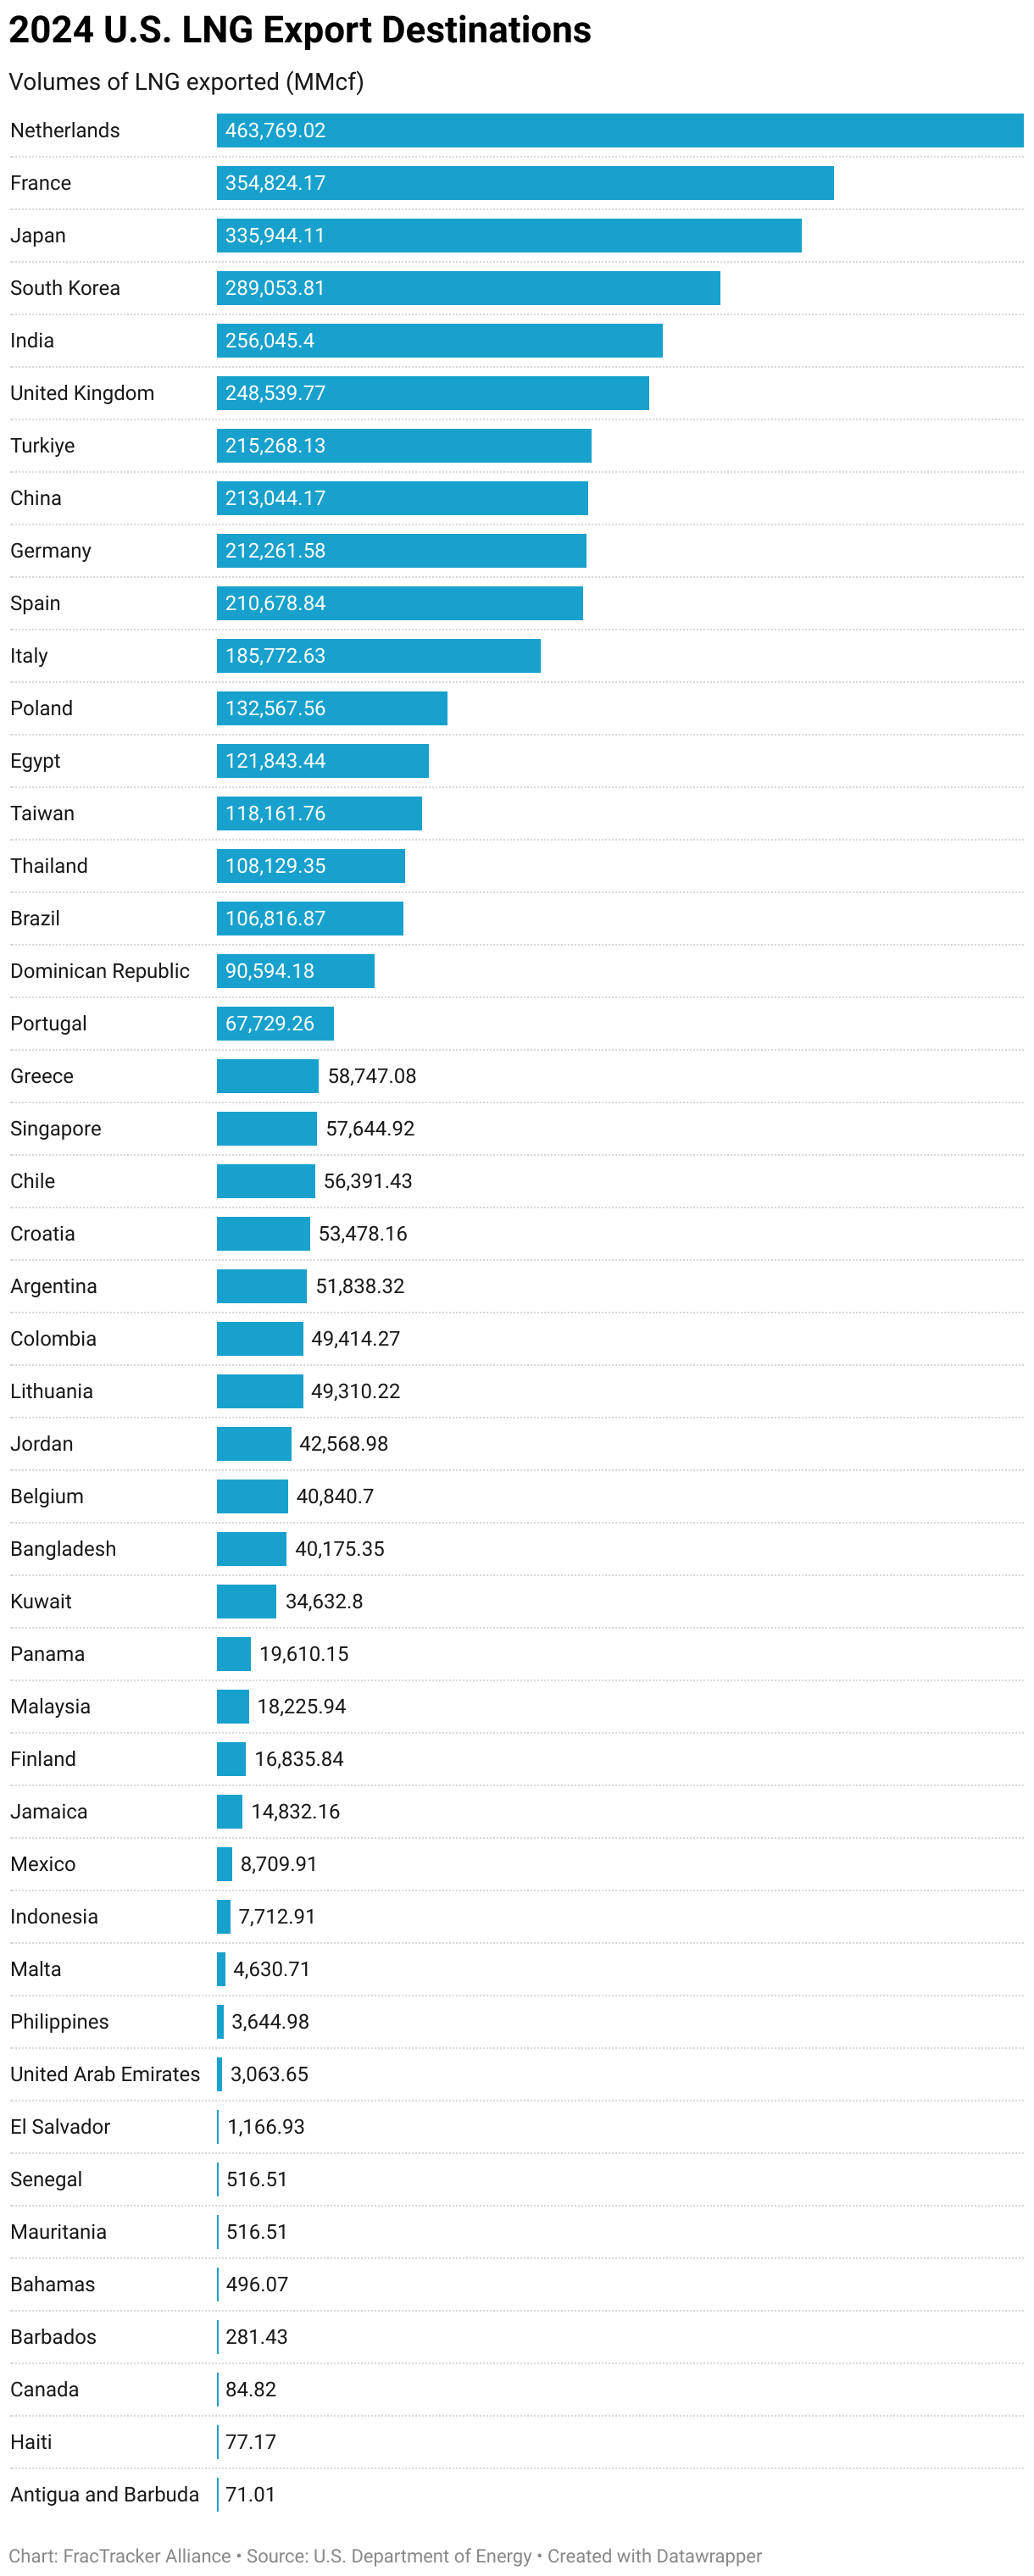
2024 U.S. LNG Export Destinations. Source: DOE: 1. U.S. Natural Gas Imports Exports and Re-Exports Summary (Jan 2000 -Dec 2024)_0.xlsx. Graphic: FracTracker Alliance.
Table 1. Commercially operating U.S. LNG import and export terminals
| Terminal | Capabilities | Location | Start Year |
| Calcasieu Pass LNG | Export | Hackberry, LA | 2022 |
| Cameron LNG | Export | Hackberry, LA | 2019 |
| Corpus Christi LNG | Export | Portland, TX | 2018 |
| Cove Point LNG | Export/Import | Lusby, MD | 2018 |
| Elba Island LNG | Export/Import | Savannah, GA | 2019 |
| Everett Marine Terminal | Import | Everett, MA | 1971 |
| Freeport LNG | Export/Import | Freeport, TX | 2019 |
| Northeast Gateway LNG | Import | Offshore Boston, MA | 2008 |
| Plaquemines LNG | Export | Plaquemines Parish, LA | 2024 |
| Sabine Pass LNG | Export | Sabine Pass, LA | 2016 |
Sources: EIA, Sierra Club. Last updated September 2025.
As of 2025 Texas and Louisiana exported the majority of LNG from the United States, with Louisiana responsible for 61% of exports. At the time of publication, there were 8 active U.S. export terminals.
")
LNG exports volumes by terminal in 2024. Volumes smaller than 1,000 MMcf and facilities outside of the continental U.S. are not displayed. Source: DOE: 3. U.S. LNG Exports and Re-Exports Details (Jan 2016 – Dec 2024)_0.xlsx.
At the time of publication, dozens of additional projects were at various stages in their DOE approval, FID, EPC, and construction processes.

U.S. LNG export terminals, active and under construction. Since the creation of this map, Woodside LNG and CP2 in Louisiana are also slated to begin construction. Source: EIA, map updated in January 2025.
To see current data on U.S. LNG import and export operations, visit:
For current information on LNG terminal and project status and activity:
There has been an overall increase in global LNG trade over the past two decades, but the global demand for natural gas has been forecasted by industry and other agencies to plateau between 2030-2040.

Global amount of LNG traded, 2010-2023. Source: EIA.
The largest LNG global exporters in 2024 were the United States, Australia, and Qatar.


Locations of global LNG import and export terminals. Source: Global Energy Monitor, last updated September 2024.
For more information on global LNG trade including terminals and capacities, visit:
The Institute for Energy Economics and Financial Analysis predicted a global oversupply of LNG by 2028, driven by a mismatch between major investments in new export capacity and slowing demand in Japan, South Korea, and Europe. This decline in demand is largely due to increased investment in renewable and low-carbon energy sources. LNG imports to other parts of Asia including China are also expected to slow, impacted by volatile gas prices and various logistical and political challenges.
As of 2025, over half of the LNG exported by the U.S. was sent to Europe. Following Russia’s invasion of Ukraine, Russia’s gas exports to Europe declined by 58% in 2022 and 89% in 2023. This collapse was driven by Europe’s efforts to cut reliance on Russian energy, Russia’s political weaponization of gas, and the September 2022 explosions that permanently disabled the Nord Stream pipelines. U.S. LNG was utilized to meet gas needs formerly supplied by Russian pipelines, but this demand was already decreasing as of 2024.
Methane gas supplies about a third of total U.S. energy consumption, with 32,500 Bcf consumed in 2023. The U.S. has large gas reserves, but when more gas is exported as LNG, domestic buyers must compete with global buyers for the same supply. Unlike oil, which is priced on the global market, U.S. gas prices are usually shaped by domestic supply and demand — and exports change that balance. DOE’s 2024 study found that in high-export scenarios, wholesale domestic gas prices could rise by more than 30% by 2050, adding over $100 per year to the average household’s energy costs. These increases would show up in three ways: higher home gas bills, higher electricity prices (since gas fuels much U.S. power generation), and higher costs for consumer goods as manufacturers pay more for energy.

U.S. energy consumption in 2023. Source: EIA.
According to the Institute for Energy Economics and Financial Analysis, LNG exports have caused residential gas prices to increase by 9% between 2016 and 2023 in a regionally varying and chaotic market. Approximately 60% of U.S. homes use gas for heating, cooking, and other uses. In an economy where everyday people are already financially burdened, increasing the price of basic needs is a disastrous proposal.

LNG requires methane gas sourced through fracking first and foremost. Fracking has been linked to negative health and environmental effects through air pollution and water and soil contamination.
Living near fracking has been associated with higher risks of health problems such as:
The fracking process extracts gas using water, respirable silica sand, and chemicals that are carcinogens, endocrine disruptors, and environmental toxins. Fracking can contaminate aquifers and private drinking water wells, exposing residents to harmful toxins and ruining their drinking water supply. In addition to the effects from the methane itself and the chemicals used in the extraction process, fracking mobilizes naturally occurring radioactive materials (NORM), including radium and radon, which can contaminate wastewater, equipment, and pipeline residues, creating risks for workers and nearby communities.
Leaks of methane along the fracked gas and LNG supply chain can result in poor air quality by contributing to the formation of ground level ozone and particulate matter (PM) pollution. This pollution damages airways, aggravates lung diseases, causes asthma attacks, increases rates of preterm birth, cardiovascular morbidity and mortality, and heightens stroke risk.
LNG terminals emit pollutants including:
The air pollutants emitted by LNG terminals can damage the lungs and cause asthma attacks, contribute to smog, trigger heart attacks, keep oxygen from reaching the heart and brain, and cause cancer. Multiple LNG terminals have documented permit violations or excess emissions events with limited penalties. Direct air pollution from LNG export terminals was estimated to cause 60 premature deaths and $957 million in total health costs per year. If all terminals and terminal expansions planned as of August 2024 were completed then these statistics would increase to 149 premature deaths and $2.33 billion in health costs.
Methane gas is highly flammable. Liquefied methane gas is stored at extremely low temperatures in large cryogenic tanks, generally at low pressure, but accidents and infrastructure malfunctions can still present a risk of fire and large-scale explosions. LNG in liquid form does not burn, but as it warms and vaporizes it produces methane vapors that are highly flammable when mixed with air, presenting serious safety risks if not properly stored. An explosion and fire at Freeport LNG in June 2022 was caused by the warming and expansion of LNG within piping due to an improperly isolated pressure relief valve. This incident thankfully caused no injuries or fatalities, but it shut down the facility for eight months.
Transportation of LNG poses risks for explosion in the event of an accident. LNG transportation by rail is a particularly dangerous option, with EarthJustice estimating that 22 train cars carrying LNG equaled the energy of the atomic bomb dropped on Hiroshima, Japan in World War II. Unlike ocean faring vessels, trains go right through communities. The U.S. DOT and a D.C. Circuit Court of Appeals have acted to prohibit LNG transport by rail. However, PHMSA announced an advance notice of proposed rulemaking in June 2025 that would again permit transport of LNG by rail.

LNG Tanker near Corpus Christi LNG, TX. Photo credit: Ted Auch, 2023.
The construction of LNG facilities removes marshes, wetlands, and old growth forests that protect against erosion and serve as carbon sinks and habitats for wildlife. Marine ecosystems suffer from thermal pollution when water used for cooling or regasification is discharged back into the sea at elevated temperatures. Heavy dredging and increased ship traffic can devastate local economies reliant on shrimp and fish and threatens biodiversity.

Wetlands around Cameron LNG, LA. Photo Credit: Ted Auch, 2023.
Additionally, the Gulf Coast is impacted by hurricanes each year. LNG terminals replace thousands of acres of Gulf Coast wetlands, removing a natural sponge-like buffer that decreases flood heights and storm surges during hurricanes. Flooding during hurricanes facilitates contamination past LNG facility fencelines into the surrounding communities and environment. Drinking water contamination and toxic impacts on fisheries, agriculture, and ecosystems can occur. Hurricanes can also damage LNG facilities and lead to increases in air pollution. During Hurricane Laura in 2020, a pressure system failure caused Sabine Pass LNG to release tons of methane, nitrogen oxide, and carbon monoxide into the atmosphere. The same storm caused Cameron LNG to lose power for over a month and release flares that looked like “fireballs.” Hurricane risks can be expected to increase as the climate crisis causes heavier rainfall, more severe storms, and sea level rise.
While the extraction, processing, and transport of fracked gas harms communities along the entire lifecycle of LNG production, there are particularly high risks borne by those living in closest proximity to the massive facilities that liquify and export LNG. Along the Gulf Coast, LNG terminals have been built near environmental justice communities that are home to people of color and low income populations who were already disproportionately burdened by toxic pollutants emitted by oil refineries, petrochemical manufacturers, and other industrial activity. The huge amounts of air pollution from LNG export facilities increases this already unacceptable exposure. The buildout is particularly dense in and near Cameron Parish, Louisiana, where three major export terminals exist and four more are under construction.

LNG Terminals near Cameron Parish, LA, active and under construction. Sources: Sierra Club, U.S. Census 2022 block group demographics, last updated September, 2025.
Advocacy groups like Louisiana Bucket Brigade, Vessel Project of Louisiana, South Texas Environmental Justice Network, and Healthy Gulf work tirelessly to fight proposed terminals, hold LNG companies accountable, and increase protections for the local communities that these facilities pollute. Sierra Club has filed multiple lawsuits in collaboration with other advocacy groups and community members against LNG developers for failure to consider environmental justice, environmental degradation, and climate change impacts. There is an acute need to increase protections for the environmental justice communities in these regions, which are sometimes called “sacrifice zones.”
The Robert D. Bullard Bullard Center for Environmental and Climate Justice found that FERC environmental impact assessments frequently authorize new LNG projects using flawed and incomplete environmental and climate justice analyses. Systemic racism, cumulative impacts from legacy pollution, and the concerns of frontline communities are often ignored. Considering these adverse effects, more terminals and expansions cannot be justified near these already overburdened communities.
Average global temperature surpassed the threshold of 1.5 ºC for the first time in 2024, making it the hottest year on record. Misinformation frames LNG as a “cleaner” fuel compared to other fossil fuels like coal, but burning any type of fossil fuel contributes to the climate crisis. A 2024 Cornell study estimated that the overall carbon footprint of LNG is 33% worse than coal. This is because of the long supply chain of LNG (transport, chilling, storage, shipping, and regasification), and the numerous places along that supply chain that release emissions (primarily methane and carbon dioxide). LNG is not a climate solution.
Methane is the main component of fracked gas. Typically, carbon dioxide is the most talked about greenhouse gas when discussing the climate crisis, but because of its chemical composition methane has a much higher global-warming potential than carbon dioxide. Over 20 years, methane can trap about 80 times as much heat as the CO2. It is estimated that about a third of current global warming is due to methane emissions. The largest industrial source of methane is the oil and gas industry. Methane leaks across the oil and gas supply chain account for a quarter of global methane emissions, due to leaks, intentional venting from open storage tanks, and the burning of excess gas (flaring).

Flaring at a compressor station in Butler County, OH. Photo Credit: Ted Auch, FracTracker Alliance, 2018.
Methane only lingers in the atmosphere for about a decade compared to the centuries that carbon dioxide remains. Therefore, reducing methane emissions is one of the fastest and most effective ways of curbing climate change in the short term. Methane emissions have been gaining attention and governments are developing plans to reduce their emissions as a way to help address the climate crisis. The EPA released a final rule on methane reduction from oil and gas operations in December 2023. The EPA estimated that the rule will avoid 58 million tons of methane emissions (enough gas to heat nearly 8 million homes in the winter) between 2024 to 2038. The EU released rules in May 2023 to limit methane emission for their LNG imports after 2030.
Methane and carbon dioxide emissions occur at every step of the LNG supply chain and it is a highly energy intensive process to chill methane gas to the temperatures needed for liquefaction and storage. Leaks, venting, and exhaust are responsible for up to 14% of LNG’s life-cycle emissions. A significant portion of the feedstock gas is often used in liquefaction, which can result in a 7-15% loss of gross product. The transportation process from extraction well to export terminal to storage to end user requires energy, which could come from the LNG itself or another power or fuel source. Regasification also requires energy. All in all, producing LNG adds significant extra emissions and energy use across the supply chain, making its climate footprint much larger than using the same gas domestically—and far larger than truly clean energy alternatives.

Calcasieu Pass LNG liquefaction and export facility, Cameron Parish, LA. Photo credit: Ted Auch, 2023.
LNG has been described by some as a “transition” fuel on the pathway to sustainable energy, but LNG has proven to increase gas demand and compete with renewable energy development. The Natural Resources Defense Council (NRCD) estimates that life-cycle greenhouse gas emissions for renewable energy sources are less than 7% of LNG emissions for solar power and less than 2% for wind power. The 2024 DOE study concluded that very large LNG projects with an export capacity of 4 Bcf per day could yield more annual greenhouse gas emissions alone than 141 countries did in 2023. Sierra Club estimates that CP2 LNG in Louisiana will emit 190 million tons of carbon dioxide per year, which is equivalent to the pollution from 51 coal-fired power plants. Instead of building more infrastructure to export and import LNG, the same funds can be put towards sustainable alternatives that can last for decades to come. In order for countries around the world to meet their climate targets, clean energy sources need to be prioritized.
Liquefied natural gas (LNG) is a complex energy product—highly energy-intensive to produce and promoted as a climate solution despite evidence to the contrary. Understanding the technical process, economics, and human health and environmental impacts is essential for regulators, investors, and advocates. The Department of Energy’s 2024 report provides strong evidence that large-scale LNG exports are harmful for both the economy and the climate. Expanding exports will inevitably harm frontline communities, local economies, and ecosystems, while the financial gains flow primarily to LNG corporations and their investors. LNG is not a bridge fuel; it is another way to entrench fossil fuel dependence. The U.S. should be investing in renewable energy and climate solutions, not in infrastructure that will lock our country and others into decades of additional fossil fuel use at the very moment we must accelerate the transition.
Liquefied Natural Gas (LNG) | Department of Energy
Liquefied natural gas – U.S. Energy Information Administration (EIA)
Liquified Natural Gas (LNG) 101 | NRDC
US LNG Export Tracker | Sierra Club
Tracker Map – Global Energy Monitor
The Center for Oil and Gas Organizing
Environmental Integrity Advocate’s Guide For Challenging LNG Projects
 https://www.fractracker.org/a5ej20sjfwe/wp-content/uploads/2016/05/ChieftainSands_Chetek_WI_Processing3.jpg
3000
4496
FracTracker Alliance
https://www.fractracker.org/a5ej20sjfwe/wp-content/uploads/2025/09/2025-Wordmark-Logo.png
FracTracker Alliance2025-09-03 15:51:572025-09-03 15:53:53Docket No. PHMSA-2025-0050: Comment Opposing LNG by Rail Transport
https://www.fractracker.org/a5ej20sjfwe/wp-content/uploads/2016/05/ChieftainSands_Chetek_WI_Processing3.jpg
3000
4496
FracTracker Alliance
https://www.fractracker.org/a5ej20sjfwe/wp-content/uploads/2025/09/2025-Wordmark-Logo.png
FracTracker Alliance2025-09-03 15:51:572025-09-03 15:53:53Docket No. PHMSA-2025-0050: Comment Opposing LNG by Rail Transport https://www.fractracker.org/a5ej20sjfwe/wp-content/uploads/2025/09/katie-moum-pB8f9uLM8r0-unsplash.jpg
1000
1500
Kyle Ferrar, MPH
https://www.fractracker.org/a5ej20sjfwe/wp-content/uploads/2025/09/2025-Wordmark-Logo.png
Kyle Ferrar, MPH2025-09-03 14:56:112025-09-08 13:26:15Threats of Permitting New Liquefied Natural Gas Terminals in the Pacific Northwest
https://www.fractracker.org/a5ej20sjfwe/wp-content/uploads/2025/09/katie-moum-pB8f9uLM8r0-unsplash.jpg
1000
1500
Kyle Ferrar, MPH
https://www.fractracker.org/a5ej20sjfwe/wp-content/uploads/2025/09/2025-Wordmark-Logo.png
Kyle Ferrar, MPH2025-09-03 14:56:112025-09-08 13:26:15Threats of Permitting New Liquefied Natural Gas Terminals in the Pacific Northwest https://www.flickr.com/people/10175246@N08
https://www.fractracker.org/a5ej20sjfwe/wp-content/uploads/2025/04/Lighthouse_on_shannon_river_8051332659_2.jpg
1000
1500
Shannon Smith
https://www.fractracker.org/a5ej20sjfwe/wp-content/uploads/2025/09/2025-Wordmark-Logo.png
Shannon Smith2025-03-31 14:18:352025-04-01 16:56:15Greenwashed “Security”: The Truth Behind Ireland’s LNG Terminal Plans
https://www.flickr.com/people/10175246@N08
https://www.fractracker.org/a5ej20sjfwe/wp-content/uploads/2025/04/Lighthouse_on_shannon_river_8051332659_2.jpg
1000
1500
Shannon Smith
https://www.fractracker.org/a5ej20sjfwe/wp-content/uploads/2025/09/2025-Wordmark-Logo.png
Shannon Smith2025-03-31 14:18:352025-04-01 16:56:15Greenwashed “Security”: The Truth Behind Ireland’s LNG Terminal Plans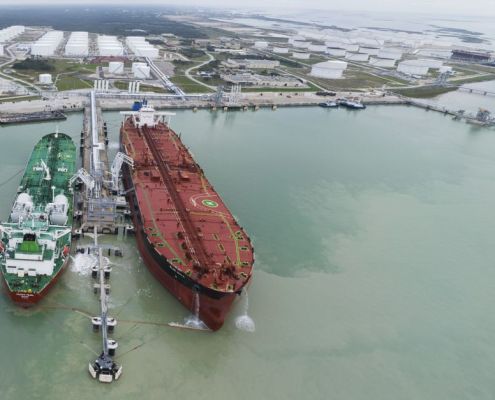 https://www.fractracker.org/a5ej20sjfwe/wp-content/uploads/2023/01/52559751431_cb5a42eb32_k.jpg
627
1500
Ted Auch, PhD
https://www.fractracker.org/a5ej20sjfwe/wp-content/uploads/2025/09/2025-Wordmark-Logo.png
Ted Auch, PhD2023-01-11 12:13:492023-01-11 12:58:06Book Review Part II: ‘Public Responses to Fossil Fuel Export: Exporting Energy and Emissions in a Time of Transition’
https://www.fractracker.org/a5ej20sjfwe/wp-content/uploads/2023/01/52559751431_cb5a42eb32_k.jpg
627
1500
Ted Auch, PhD
https://www.fractracker.org/a5ej20sjfwe/wp-content/uploads/2025/09/2025-Wordmark-Logo.png
Ted Auch, PhD2023-01-11 12:13:492023-01-11 12:58:06Book Review Part II: ‘Public Responses to Fossil Fuel Export: Exporting Energy and Emissions in a Time of Transition’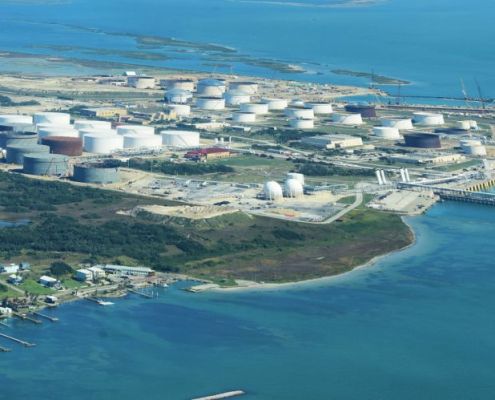 Ted Auch, FracTracker Alliance, 2019. Aerial support provided by LightHawk.
https://www.fractracker.org/a5ej20sjfwe/wp-content/uploads/2022/12/49785941742_59bf57a542_k.jpg
499
1500
Ted Auch, PhD
https://www.fractracker.org/a5ej20sjfwe/wp-content/uploads/2025/09/2025-Wordmark-Logo.png
Ted Auch, PhD2022-12-19 17:38:302023-01-11 11:15:04Book Review Part I: ‘Public Responses to Fossil Fuel Export: Exporting Energy and Emissions in a Time of Transition’
Ted Auch, FracTracker Alliance, 2019. Aerial support provided by LightHawk.
https://www.fractracker.org/a5ej20sjfwe/wp-content/uploads/2022/12/49785941742_59bf57a542_k.jpg
499
1500
Ted Auch, PhD
https://www.fractracker.org/a5ej20sjfwe/wp-content/uploads/2025/09/2025-Wordmark-Logo.png
Ted Auch, PhD2022-12-19 17:38:302023-01-11 11:15:04Book Review Part I: ‘Public Responses to Fossil Fuel Export: Exporting Energy and Emissions in a Time of Transition’ https://www.fractracker.org/a5ej20sjfwe/wp-content/uploads/2022/04/Russia-Ukraine-Energy-feature.jpg
667
1500
FracTracker Alliance
https://www.fractracker.org/a5ej20sjfwe/wp-content/uploads/2025/09/2025-Wordmark-Logo.png
FracTracker Alliance2022-04-20 13:25:452022-04-20 17:23:17Mapping Energy Systems Impacted by the Russia-Ukraine War
https://www.fractracker.org/a5ej20sjfwe/wp-content/uploads/2022/04/Russia-Ukraine-Energy-feature.jpg
667
1500
FracTracker Alliance
https://www.fractracker.org/a5ej20sjfwe/wp-content/uploads/2025/09/2025-Wordmark-Logo.png
FracTracker Alliance2022-04-20 13:25:452022-04-20 17:23:17Mapping Energy Systems Impacted by the Russia-Ukraine War https://www.fractracker.org/a5ej20sjfwe/wp-content/uploads/2021/06/National-Map-2021-Feature.jpg
667
1500
Erica Jackson
https://www.fractracker.org/a5ej20sjfwe/wp-content/uploads/2025/09/2025-Wordmark-Logo.png
Erica Jackson2021-06-30 08:00:252022-05-02 15:24:21Updated National Energy and Petrochemical Map
https://www.fractracker.org/a5ej20sjfwe/wp-content/uploads/2021/06/National-Map-2021-Feature.jpg
667
1500
Erica Jackson
https://www.fractracker.org/a5ej20sjfwe/wp-content/uploads/2025/09/2025-Wordmark-Logo.png
Erica Jackson2021-06-30 08:00:252022-05-02 15:24:21Updated National Energy and Petrochemical Map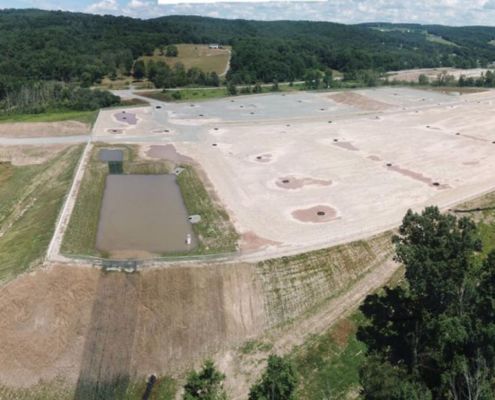 https://www.fractracker.org/a5ej20sjfwe/wp-content/uploads/2020/09/Aerial-view-of-site-preparation-work-at-the-New-Fortress-LNG-plant-site-scaled.jpg
568
1500
Karen Edelstein
https://www.fractracker.org/a5ej20sjfwe/wp-content/uploads/2025/09/2025-Wordmark-Logo.png
Karen Edelstein2020-09-15 10:13:212021-08-24 14:53:19LNG development puts Wyalusing, Pennsylvania in the cross-hairs
https://www.fractracker.org/a5ej20sjfwe/wp-content/uploads/2020/09/Aerial-view-of-site-preparation-work-at-the-New-Fortress-LNG-plant-site-scaled.jpg
568
1500
Karen Edelstein
https://www.fractracker.org/a5ej20sjfwe/wp-content/uploads/2025/09/2025-Wordmark-Logo.png
Karen Edelstein2020-09-15 10:13:212021-08-24 14:53:19LNG development puts Wyalusing, Pennsylvania in the cross-hairs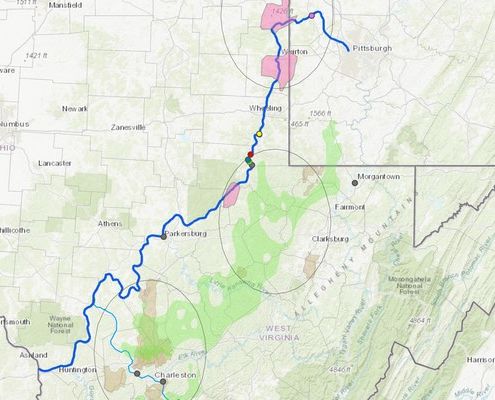 https://www.fractracker.org/a5ej20sjfwe/wp-content/uploads/2018/12/Appalachian-Storage-Feature.jpg
400
900
Erica Jackson
https://www.fractracker.org/a5ej20sjfwe/wp-content/uploads/2025/09/2025-Wordmark-Logo.png
Erica Jackson2018-12-19 12:31:022025-01-14 15:37:24Storing Natural Gas Liquids in Appalachia
https://www.fractracker.org/a5ej20sjfwe/wp-content/uploads/2018/12/Appalachian-Storage-Feature.jpg
400
900
Erica Jackson
https://www.fractracker.org/a5ej20sjfwe/wp-content/uploads/2025/09/2025-Wordmark-Logo.png
Erica Jackson2018-12-19 12:31:022025-01-14 15:37:24Storing Natural Gas Liquids in Appalachia![]()
216 Franklin St, Suite 400, Johnstown, PA 15901
Phone: +1 (717) 303-0403 | info@fractracker.org
FracTracker Alliance is a 501(c)3 non-profit: Tax identification number: 80-0844297


