A Review of Oil and Gas Emissions Data in Pennsylvania
By Wendy Fan, 2016 Intern, FracTracker Alliance
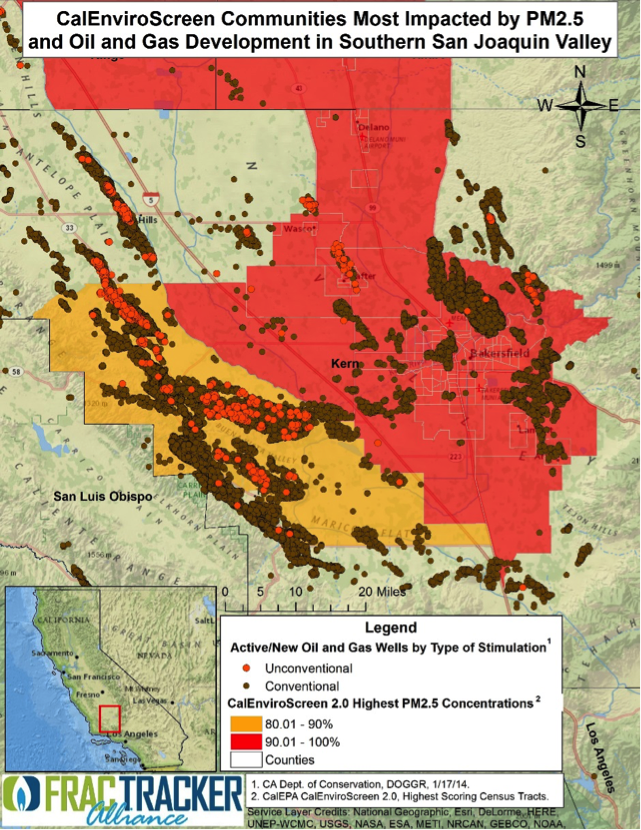
From 2011-2013, the PA Department of Environmental Protection (DEP) required air emission data to be conducted and reported by oil and gas drillers in Pennsylvania. We have tried to look at this data in aggregate to give you a sense of the types and quantities of different pollutants. Corresponding to their degree of oil and gas drilling activity, Washington, Susquehanna, Bradford, Greene, and Lycoming counties are the highest emitters of overall pollutants between the specified years. Despite the department’s attempt to increase transparency, the data submitted by the operators severely underestimates the actual amount of pollutants released, especially with regard to methane emissions. Furthermore, gaps such as inconsistent monitoring systems, missing data, and a lack of a verification process of the self-reported data weaken the integrity and reliability of the submitted data. This article explores the data submitted and its implications in further detail.
Why Emissions Are Reported
The U.S. Energy Information Administration (EIA) estimates that U.S. natural gas production will increase from 23 trillion cubic feet in 2011 to over 33 trillion cubic feet in 2040. Pennsylvania, in particular, is one of the states with the highest amount of drilling activity at present. This statistic can be attributed to resource-rich geologic formations such as the Marcellus Shale, which extends throughout much of Appalachia. While New York has banned drilling using high-volume hydraulic fracturing (fracking), Pennsylvania continues to expand its operations with 9,775 active unconventional wells as of June 10, 2016.
Between 2000-2016, drillers in Pennsylvania incurred 5,773 violations and $47.2 million in fines. The PA DEP, which oversees drilling permits and citations, has undergone criticism for their lack of action with complaints related to oil and gas drilling, as well as poor communication to the public*. In order to increase transparency and to monitor air emissions from wells, the DEP now requires unconventional natural gas operators to submit air emission data each year. The data submitted by operators are intended to be publicly accessible and downloadable by county, emission, or well operator.
* Interestingly, PA scored the highest when we rated states on a variety of data transparency metrics in a study published in 2015.
Importance of Data Collected
PA’s continual growth in oil and gas drilling activity is concerning for the environment and public health. Pollutants such as methane, carbon dioxide (CO2), and nitrous oxides (NOx) are all major contributors to climate change, and these are among the more common emissions found near oil and gas activities. Long-term exposure to benzene, also commonly associated with drilling sites, can result in harmful effects on the bone marrow and the decrease in red blood cells. Vomiting, convulsions, dizziness, and even death can occur within minutes to several hours with high levels of benzene.
With such risks, it is crucial for residents to understand how many wells are within their vicinity, and the levels of these pollutants emitted.
Air Monitoring Data Findings & Gaps
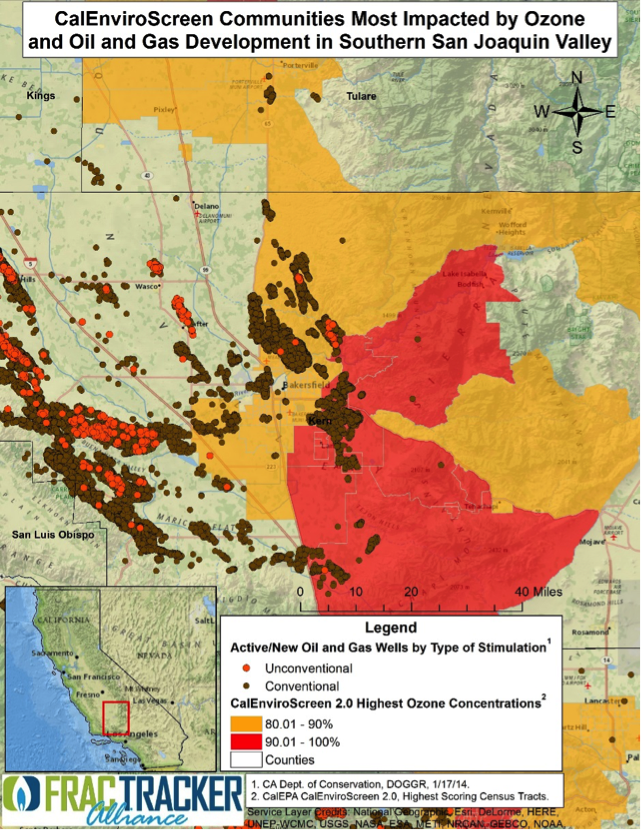
Although the DEP collects emission data on other important pollutants such as sulfur oxides (SOx), particulate matter (PM10 and PM2.5), and toluene, this article focuses only on a few select pollutants that have shown the highest emission levels from natural gas activity. The following graphs illustrate emissions of methane, carbon dioxide (CO2), carbon monoxide (CO), nitrogen oxides (NOx), benzene, and volatile organic compounds (VOCs) for the top 10 counties with the highest amounts of natural gas activity. PA wells drilled data (often called SPUD data) will also be referenced throughout the article. Data source: PA SPUD Data.
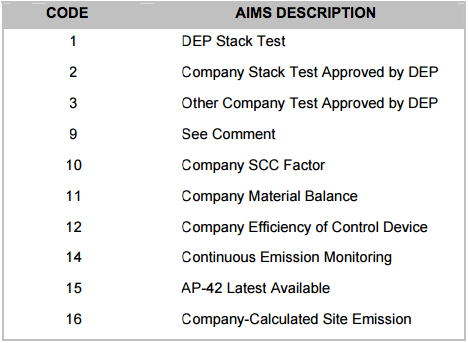
PA DEP’s Calculation Methods Codes for Emissions
Well operators self-report an estimate of total emissions in tons per year through either an online or paper reporting system. They must also indicate the method they used to generate this estimate with the Calculation Methods Codes for Emissions (table shown right).
For more information on how the data is prepared and what are the reporting requirements, refer to PA DEP’s Instruction for Completing the Annual Emissions Statement Reporting Forms.
Total Amount of Unconventional Wells 2000-2016
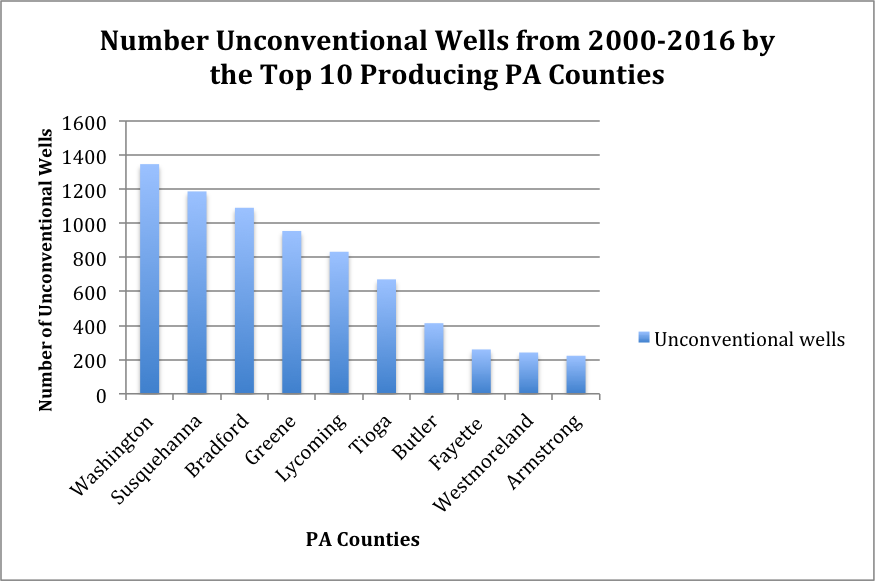
Figure 1
Overall, Washington, Susquehanna, Bradford, Greene, and Lycoming counties were the main emitters of all selected pollutants (methane, CO2, CO, NOx, VOCs, and benzene) throughout Pennsylvania based on tons per year (Fig 1). This trend may be correlated to the amount of natural gas activity that exists within each state as shown in the graph above. The top three Pennsylvania counties with the highest amount of oil and gas activity since 2000 are Washington, Susquehanna, and Bradford with 1,347; 1,187; and 1,091 unconventional active wells, respectively.
Methane Emissions
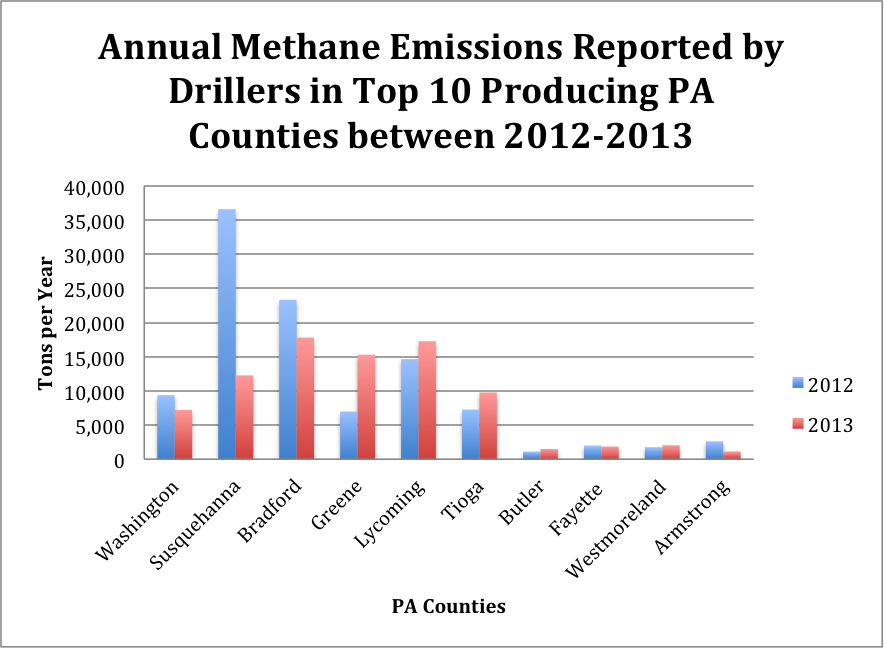
Figure 2
In 2012, Susquehanna, Bradford, and Lycoming counties reported the highest amount of methane released with levels at 36,607, 23,350, and 14,648 tons, respectively (Fig 2). In 2013, Bradford, Lycoming, and Greene counties reported the highest amount of methane released with levels at 17,805, 17,265, and 15,296 tons, respectively.
Although the overall trend of methane emission declines from 2012 to 2013, there is an unusual drop in Susquehanna County’s methane emissions from 2012 to 2013. Susquehanna’s levels went from 36,607 tons to 12,269 tons in that timeframe. However, the DEP SPUD data recorded an increase of 190 active wells to 214 active wells from 2012 to 2013 in that same county. Though the well operators did not provide details for this shift, possible reasons may be because of improved methods of preventing methane leaks over the year, well equipment may be less robust as it once was, operators may have had less of a reason to monitor for leaky wells, or operators themselves could have changed.
Lackawanna and Luzerne counties reported zero tons of methane released during the year of 2012 (not shown on graph). There are two possible reasons for this: both counties did not have any unconventional wells recorded in the 2012 SPUD data, which may explain why the two counties reported zero tons for methane emissions, or the levels submitted are a significant underestimation of the actual methane level in the counties. (While there were no new wells, there are existing wells in production in those counties.)
Considering that methane is the primary component of natural gas activity, the non-existent level of methane reported seem highly implausible even with inactive wells on site. Typically, an old or inactive gas well can either be abandoned, orphaned, or plugged. By definition, abandoned wells have been inactive for more than a year, and orphaned wells were abandoned prior to 1985. (Because of this distinction, however, no unconventional wells can be considered “orphaned.”) To plug a well, cement plugs are used to cover up wellbores in order to cease all flow of gas. The act of physically plugging up the wells paints an illusion that it is no longer functioning and has ceased all emissions.
Because of this flawed impression, systematic monitoring of air emissions is often not conducted and the wells are often ignored. Several studies have shown even abandoned and plugged wells are still spewing out small and at times large quantities of methane and CO2. One study published in 2014 in particular measured 19 abandoned wells throughout Pennsylvania, and concluded that abandoned wells were significant contributors to methane emissions – contributing 4-7% of total anthropogenic (man-made) methane emissions in PA.
View methane emissions map full screen: 2012-2013
Carbon Dioxide Emissions
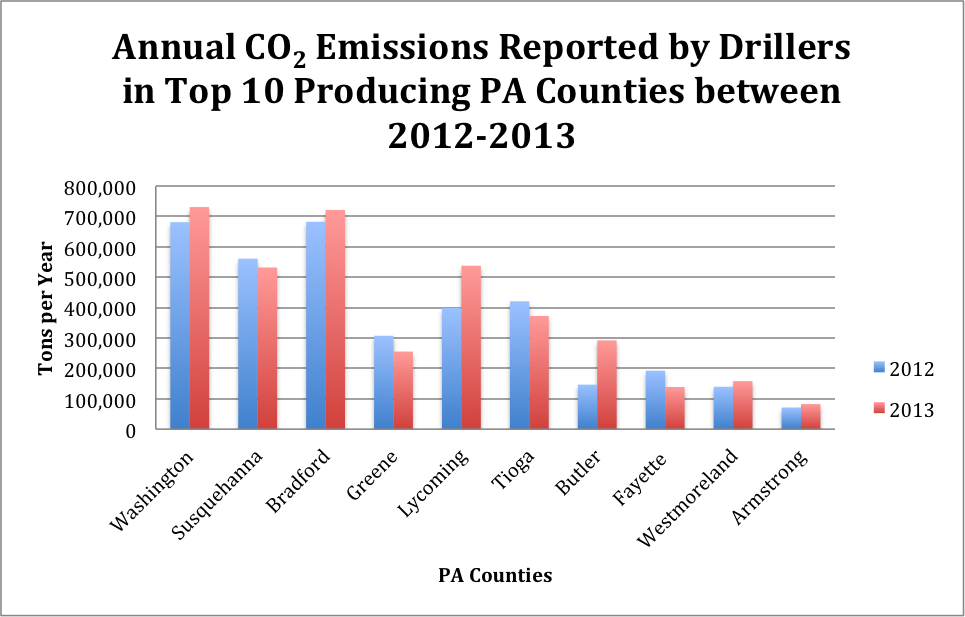
Figure 3
In 2012, Bradford County reported 682,302 tons of CO2 emitted; Washington County reported 680,979 tons; and Susquehanna reported 560,881 tons (Fig. 3). In 2013, Washington continued to lead with 730,674 tons, Bradford at 721,274 tons, and Lycoming with 537,585 tons of CO2 emitted.
What’s intriguing is according to SPUD data, Armstrong, Westmoreland, and Fayette also had considerable natural gas activity between the two years as shown on the map. Yet, their levels of CO2 emission are significantly lower compared to Lycoming or Susquehanna Counties. Greene County, in particular, had lower levels of CO2 reported. Yet, they had 106 active wells in 2012 and 117 in 2013. What is even more unusual is that Bradford County had 9 more wells than Greene County in 2013, yet, Greene County still had significantly higher CO2 levels reported.
Reasons for this difference may be that Greene County lacked the staff or resources to accurately monitor for CO2, the county may have forgotten to record emissions from compressor stations or other fugitive emission sources, or the method of monitoring may have differed between counties. Whatever the reason is, it is evident that the levels reported by Greene County may not actually be an accurate depiction of the true level of CO2 emitted.
View CO2 emissions map full screen: 2012-2013
Carbon Monoxide Emissions
Spudded wells in PA with reported CO emissions by county 2011-13
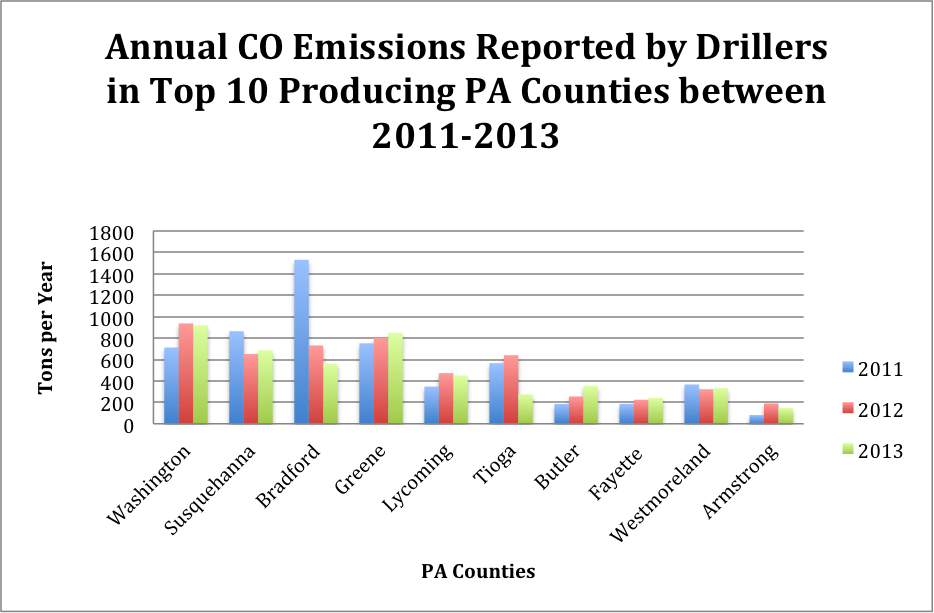
Figure 4
According to the PA SPUD data, the number of new wells drilled in Bradford County dropped from 389 in 2011 to 163 in 2012 to 108 to 2013. The diminishing number of newly drilled wells in this particular county may explain the noticeable outlier in CO emission as seen on the graph (Fig 4).
View CO emissions map full screen: 2011-2013
NOx and VOCs
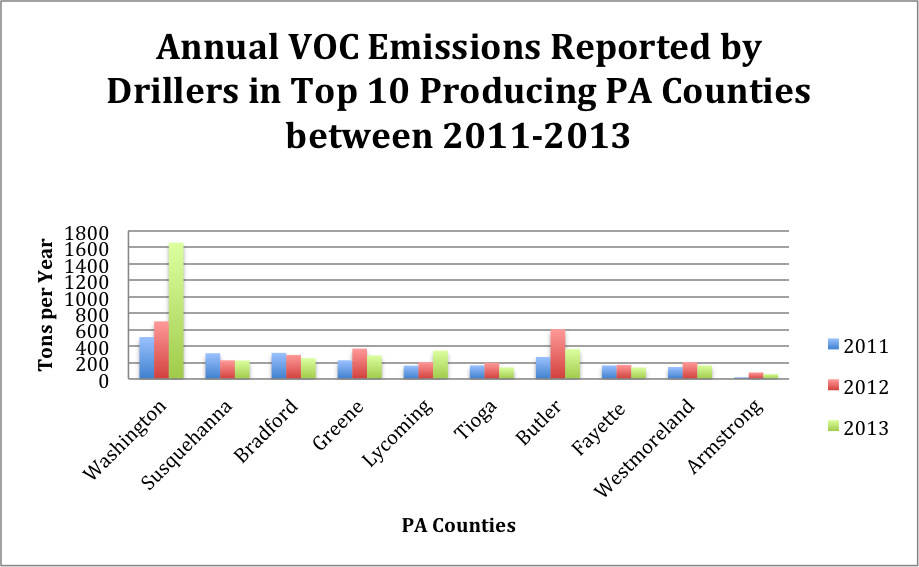
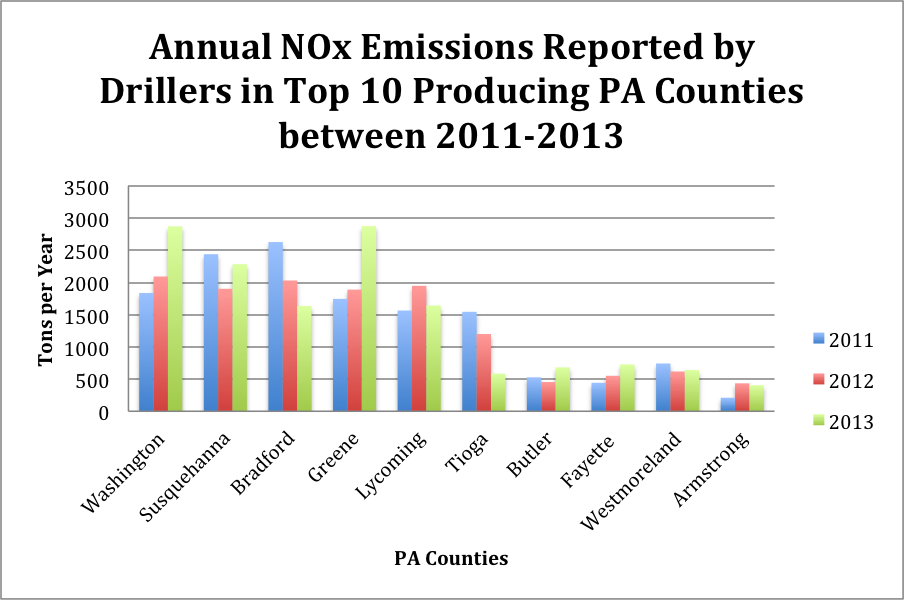
Compressor stations are also known to emit VOC, NOx, and various greenhouse gases; they run 24/7 and serve multiple wells. Compressor stations are necessary to move the natural gas along the pipelines, and thus, may still be required to function even after some wells have ceased operation. Furthermore, there can be multiple compressor stations in a region because they are installed at intervals of about 40 to 100 miles. This suggests that in addition to drilled wells, compressor stations provide additional avenues for NOx or VOC to leak into the air.
View NOx and VOC emissions maps full screen: VOC 2011-2013 | NOx 2011-2013
Benzene Emissions
Spudded wells in PA with reported benzene emissions by county 2011-13
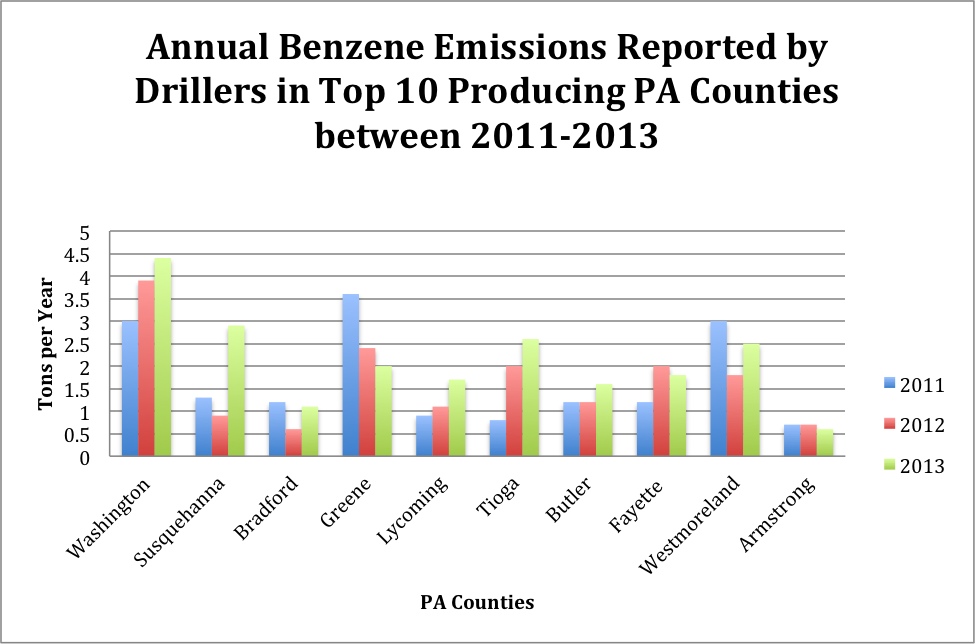
Figure 7
The levels of benzene emitted varied the most when compared to the other pollutants presented previously. Generally, the high levels of methane, CO2, and NOx emitted correlate with the high amount of natural gas activity recorded for each county’s number of drilled unconventional wells. However, it is interesting that both Westmoreland and Fayette counties had fewer active wells than Bradford County, yet, still reported higher levels of benzene (Fig 1, Fig 7).
An explanation for this may be the different monitoring techniques, the equipment used on each site which may vary by contractor or well access, or that there are other external sources of benzene captured in the monitoring process.
View benzene emissions map full screen: 2011-2013
Questions Remain
Although the collection and monitoring of air emission from wells is a step in the right direction, the data itself reveals several gaps that render the information questionable.
- The DEP did not require operators to report methane, carbon dioxide, and nitrous oxide in 2011. Considering that all three components are potent greenhouse gases and that methane is the primary component in natural gas production, the data could have been more reliable and robust if the amount of the highest pollutants were provided from the start.
- Systematic air monitoring around abandoned, orphaned, and plugged wells should still be conducted and data reported because of their significant impact to air quality. The DEP estimates there are approximately 200,000 wells that have been abandoned and unaccounted for. This figure includes older, abandoned wells that had outdated methods of plugging, such as wood plugs, wood well casings, or no plug at all. Without a consistent monitoring system for fugitive air emissions, the public’s true risk of the exposure to air pollutants will remain ambiguous.
- All emissions submitted to the DEP are self-reported data from the operators. The DEP lacks a proper verification process to confirm whether the submitted data from operators are accurate.
- The finalized data for 2014 has yet to be released despite the DEP’s April 2016 deadline. The DEP inadvertently posted the reports in March 2016, but quickly removed them without any notification or explanation as to why this information was removed. When we inquired about the release date, a DEP representative stated the data should be uploaded within the next couple of weeks. We will provide updates to this post when that data is posted but the DEP.
Overall, PA DEP’s valiant attempt to collect air data from operators and to increase transparency is constrained by the inconsistency and inaccuracy of the dataset. The gaps in the data strongly suggest that the department’s collection process and/or the industry’s reporting protocol still require major improvements in order to better monitor and communicate this information to the public.