11% of organic farms near drilling in US, potentially 31% in future
By Juliana Henao & Samantha Malone, FracTracker Alliance
Currently, 11% (2,140 of 19,515 total) of all U.S. organic farms share a watershed with active O&G drilling. Additionally, this percentage could rise up to 31% if unconventional O&G drilling continues to grow.
Organic farms represent something pure for citizens around the world. They produce food that gives people more certainty about consuming chemical-free nutrients in a culture that is so accustomed to using pesticides, fertilizers, and herbicides in order to keep up with booming demand. Among their many benefits, organic farms produce food that is high in nutritional value, use less water, replenish soil fertility, and do not use pesticides or other toxic chemicals that may get into our food supply. To maintain their integrity, however, organic farms have an array of regulations and an extensive accreditation process.
What does it mean to be an organic farm?
The accreditation process for an organic farm is quite extensive. USDA organic regulations include:
- The producer must manage plant and animal materials to maintain or improve soil organic matter content in a manner that does not contribute to contamination of crops, soil, or water by plant nutrients, pathogenic organisms, heavy metals, or residues of prohibited substance.
- No prohibited substances can be applied to the farm for a period of 3 years immediately preceding harvest of a crop
- The farm must have distinct, defined boundaries and buffer zones, such as runoff diversions to prevent the unintended application of a prohibited substance to the crop or contact with a prohibited substance applied by adjoining land that is not under organic management.
There are additional regulations that pertain to crop pest, weed, and disease standards; soil fertility and crop nutrient management standards; seeds and planting stock practice standards; and wild-crop harvesting practice standards, to name a few. A violation of any one of these USDA regulations can mean a hold on the accreditation of an organic farm.
The full list of regulations and requirements can be found here.
Threats Posed by Oil & Gas
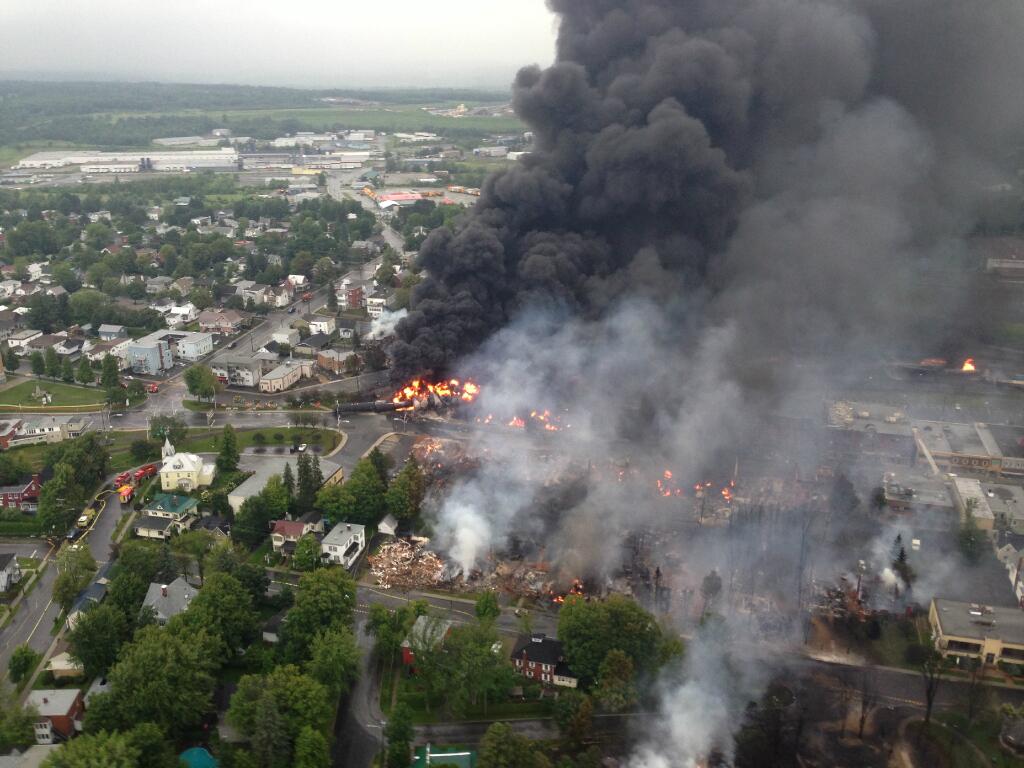
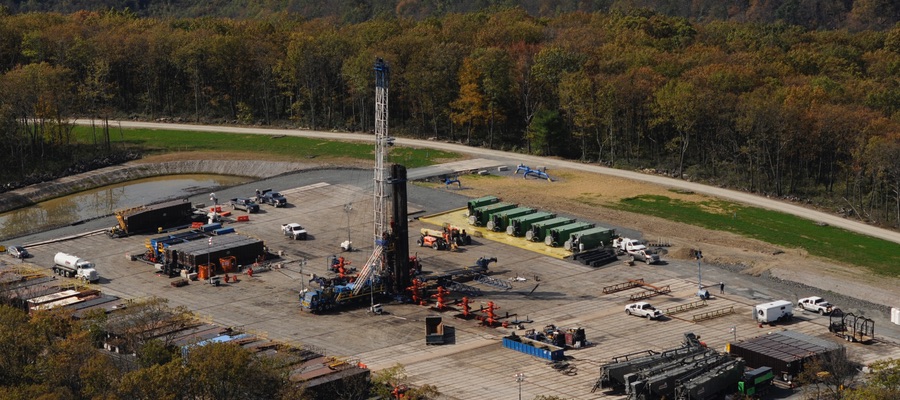
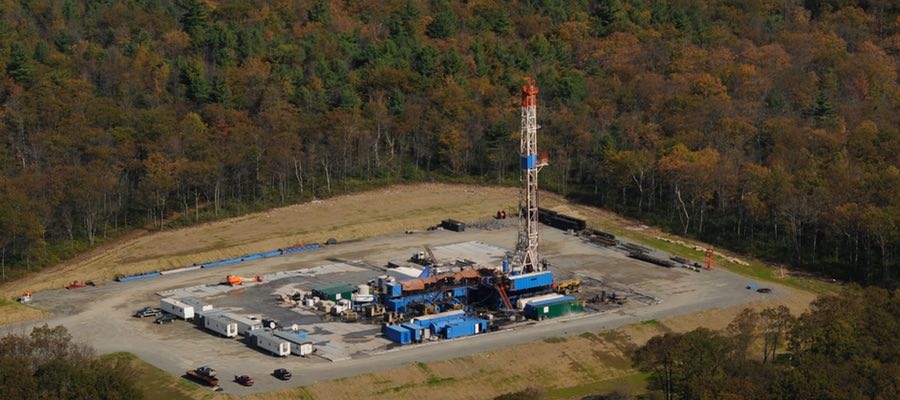
Nearby oil and gas drilling is one of many threats to organic farms and their crop integrity. With a steady expansion of wells, the O&G industry is using more and more land, requiring significant quantities of fresh water, and emitting air and water pollution from sites (both in permitted and unpermitted cases). O&G activity could not only affect the quality of the produce from these farms, but also their ability to meet the USDA’s organic standards.
To see how organic farms and the businesses surrounding wells are being affected, Ted Auch analyzed certain dynamics of organic farms near drilling activity in the United States, and generated some key findings. His results showcase how many organic farms are at risk now and in the future if O&G drilling expands. Below we describe a few of his key findings, but you can also read the entire article here.
Key Findings – Organic Farms Near Oil & Gas Activity
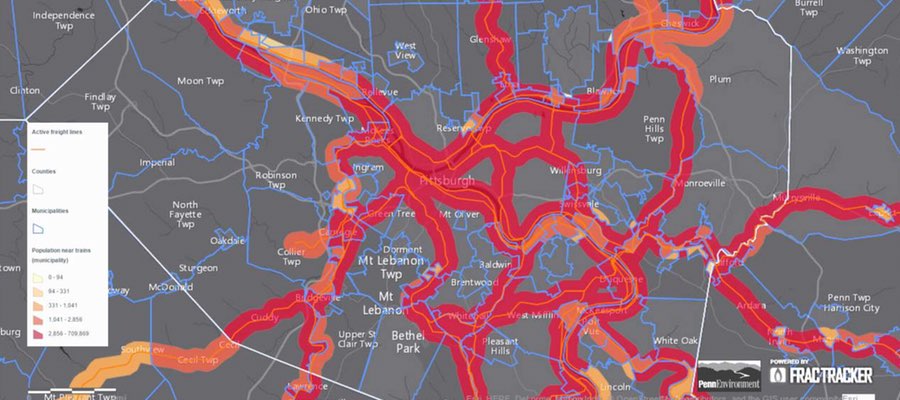
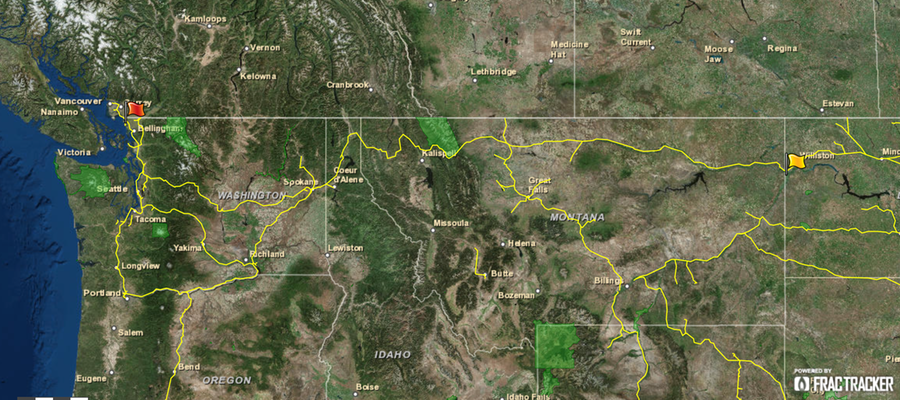
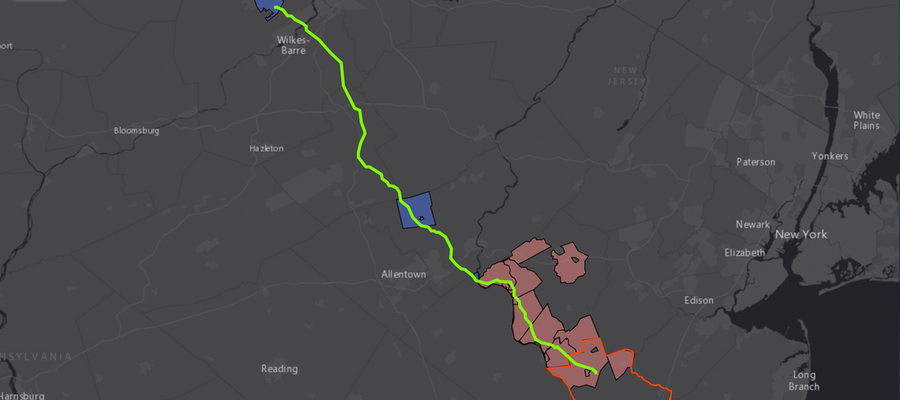
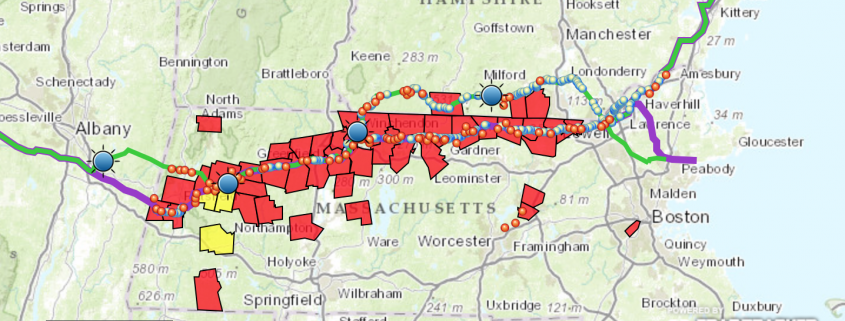
Explore this dynamic map of the U.S. organic farms (2,140) within 20 miles of oil & gas drilling. To view the legend and see the map fullscreen, click here.
Of the 19,515 U.S. organic farms in the U.S., 2,140 (11%) share a watershed with oil and gas activity – with up to 31% in the path of future wells in shale areas. Why look at oil and gas activity at the watershed level? Watersheds are key areas from which O&G companies pull their resources or into which they emit pollution. For unconventional drilling, hydraulic fracturing companies need to obtain fresh water from somewhere in order to frack the wells, and often the local watershed serves as that source. Spills can and do occur on site and in the process of transporting the well pad’s products, posing risks to soils and waterways, as well.
Figure 1, below, demonstrates the number of organic farms near active oil & gas wells in the U.S. – broken down by five location-based Regions of Concern (ROC).
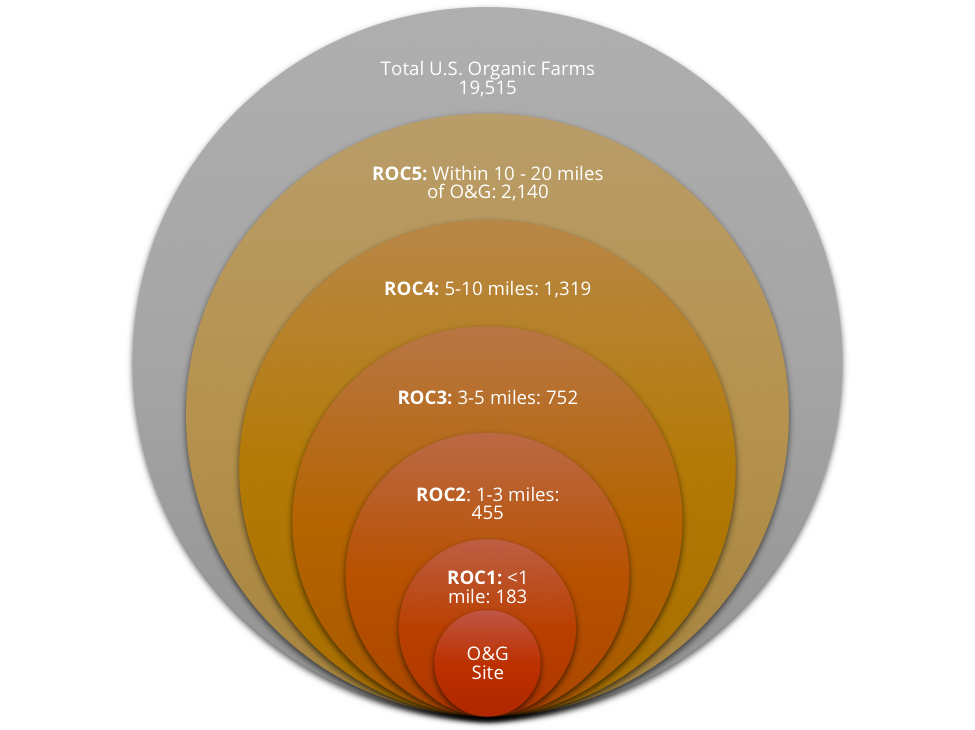
Figure 1: Total and incremental numbers of US organic farms in the 5 O&G Regions of Concern (ROC).
The most at-risk farms are located in five states: California, Ohio, Michigan, Texas and Pennsylvania. Learn more about the breakdown of the types of organic farms that fall within these ROCs, including what they produce.
Out of Ohio’s 703 organic farms, 220 organic farms are near drilling activity, and 105 are near injection (waste disposal) wells.
Conclusion
More and more O&G drilling is being permitted to operate near organic farms in the United States. The ability for municipalities to zone out O&G varies by state, but there is currently no national restriction that specifically protects organic farms from this industrial activity. As the O&G industry expands and continues to operate at such close proximities to organic farms in the US, there are a variety of potential impacts that we could see in the near future. The following list and more is explained in further detail in Auch’s research paper:
- A complete alteration in soil composition and quality,
- A need to restore wetland soils that are altered beyond the best reclamation techniques,
- A dramatic decline in organic farm and land productivity,
- A changing landscape,
- Wildlife habitat fragmentation, and
- Watershed resilience … to name a few.
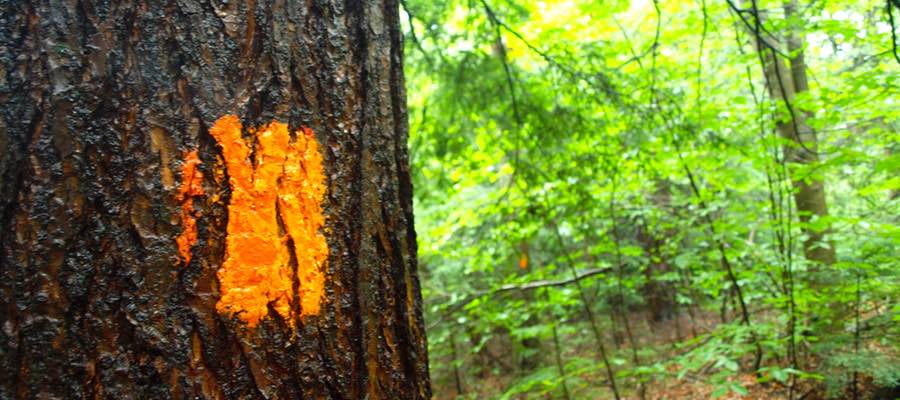
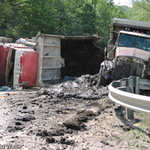
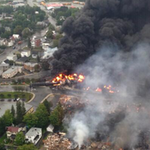
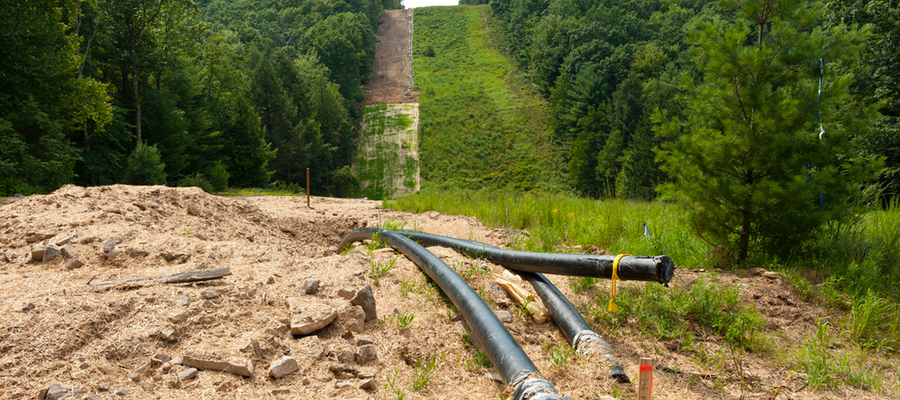
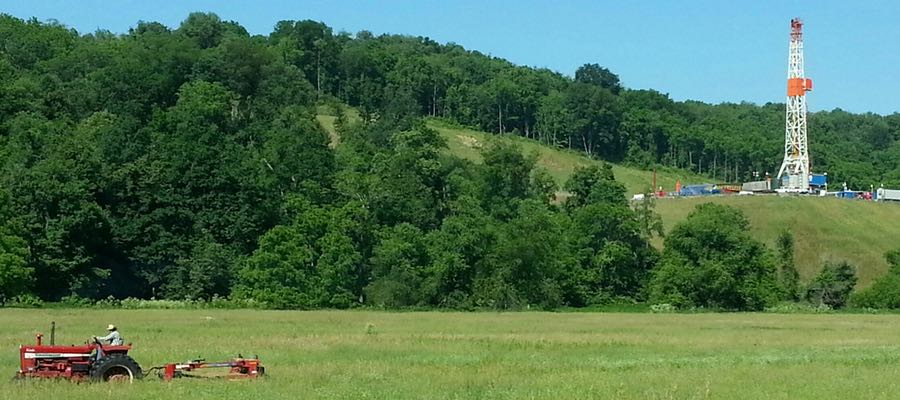
PA feature image taken by Sara Gillooly, 2013