The majority of FracTracker’s posts are generally considered articles. These may include analysis around data, embedded maps, summaries of partner collaborations, highlights of a publication or project, guest posts, etc.
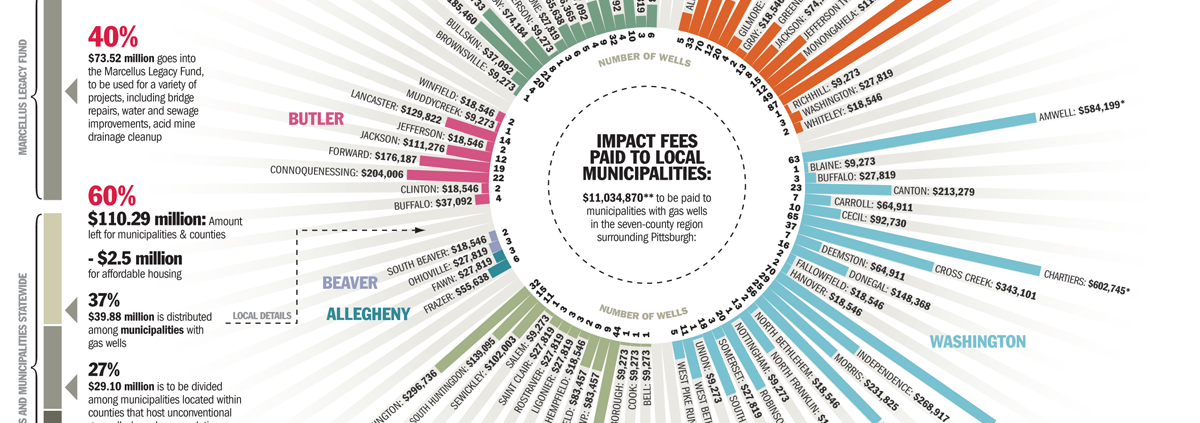
A captivating view of gas drilling’s impact from an economic standpoint. Click on the image for more information by the Pittsburgh Post-Gazette about how 7 counties in Southwest PA may use the funds they receive from PA’s impact fee.
https://www.fractracker.org/a5ej20sjfwe/wp-content/uploads/2012/06/20120607impact_fees_1200.png11131200FracTracker Alliancehttps://www.fractracker.org/a5ej20sjfwe/wp-content/uploads/2025/09/2025-Wordmark-Logo.pngFracTracker Alliance2012-06-07 14:10:552020-07-21 10:39:39Marcellus Impact Graphic by Pittsburgh Post-Gazette
According to the Pennsylvania Fish and Boat Commission (PFBC), only 22,000 of the 86,000 miles of flowing water in PA have been sampled by biologists from their organization. As of 2011, about 12,800 miles were designated as wild trout waters. (It is hard to believe that we have so many streams to begin with!) In recent years, many groups in the Commonwealth have increased their efforts to assess these streams due to increases in potential water quality threats, such as land development and unconventional natural gas extraction. By default, unassessed streams are given the lowest classification category by the PA Department of Environmental Protection (PA DEP). It is important to prioritize streams according to their water quality, the potential for wild trout populations, and the risk posed by nearby human activities. Why trout? Glad you asked. While there are many other ways to determine water quality, the presence of wild trout increases the streams’ water quality protection classification in PA.
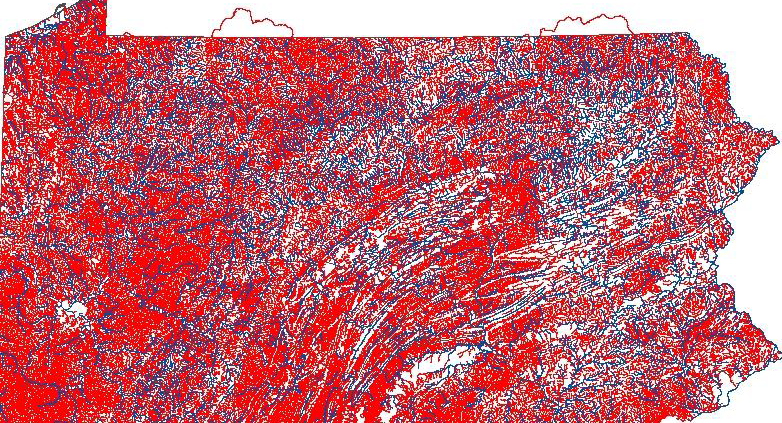
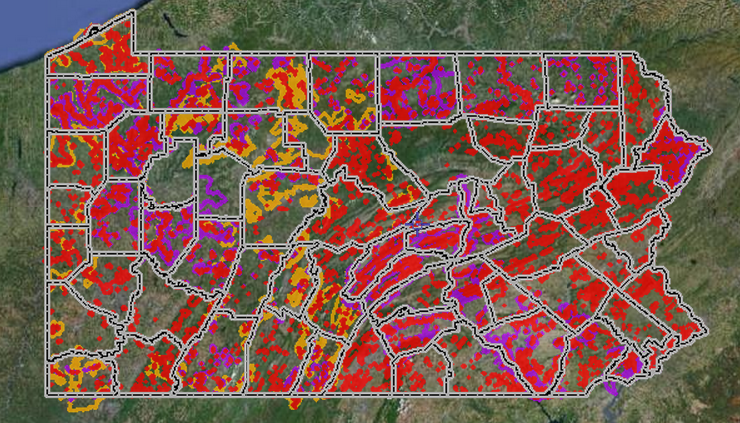
A few weeks ago I spoke with an engaging gentleman from Susquehanna University, Dr. Jonathan Niles, who is working on a unique stream sampling project through the PFBC with a number of partners to do just that. Pennsylvania’s Unassessed Waters Initiative seeks to classify the 92% of streams that don’t have monitoring data about. In 2010, PFBC partnered with two universities to survey trout populations in 30 streams each under a small grant. This work was expanded in 2011 with even more entities signing on, including Susquehanna University, and resulted in a significant increase in the number of classified streams. The project involves entering the GPS locations of the unassessed streams and then collecting trout population data from the field. In the past two years the Unassessed Waters Initiative has surveyed 1,049 streams and documented wild trout in about 55% of those streams. Check out the progress they have made in the two maps below, the first from 2008 before sampling efforts were increased, and the second from 2012:
Unassessed Waters in PA – 2008 – Unassessed streams in red, Assessed in blue
Unassessed Waters in PA – 2012 – Unassessed streams in red, Assessed in blue
In addition to the sampling protocol set forth by PFBC, Dr. Niles and his students Caleb Currens, John Panas, and Sam Silknetter collected benthic macroinvertibrate (which are PA DEP water quality indicators) and algae species data, conducted fish population estimates on every stream (not just where there was more than 5 fish of a certain species), sampled fish diets, and collected water for additional heavy metals and contaminant analysis. The preliminary fishery data from last year are currently being reviewed by the PADEP.
Some of the Initative’s efforts have focused on the quality of streams near shale gas drilling operations, especially due to the risk that erosion and sedimentation poses to trout’s habitat. Dr. Niles feels that the data collected from initiatives like this one provide valuable operating insight for development and natural gas companies, as sensitive areas can be avoided by companies – saving them time and money.
With funding from the National Fish and Wildlife Foundation, the Iinitiative has been funded again this year. Dr. Niles’ team is contracted to assess 20 streams in Loyalstock that were previously unassessed. An additional 40 streams will be assessed by Dr. Niles’ team elsewhere in PA. While they have made extraordinary progress, there is still much work to be done. What does a project with such a broad geographic scope like this one cost? In addition to travel and salary costs, each benthic macroinvertebrate sample runs about $200-250 to analyze in a lab. It is likely that this year alone there will be at least 60 samples collected by Dr. Niles’ team, if not more. The financial cost of conducting this kind of research may seem high, but the failure to do so could cost Pennsylvanians much more. It is our hope, here at FracTracker, to keep up-to-date with the Unassessed Waters Initiative as the teams go out this year. Check back soon for more information, or contact us if you would like to get involved with either the sampling or funding of this initiative: info@fractracker.org.
Below are photos of Dr. Niles’ assessment team taken during their field sampling trips.
In addition to the Fish and Boat’s own crews, the following 15 groups are partners for this year’s Unassessed Waters Initiative:
Penn State University
California University of Pennsylvania
Susquehanna University
Clarion University
Lycoming College
Kings College
Keystone College
Juniata College
Allegheny College
Mansfield University
Lock Haven University
Duquesne University
Loyalsock Creek Watershed Association
Western Pennsylvania Conservancy
Trout Unlimited – Eastern Abandoned Mines program
By Samantha Malone, MPH, CPH – Communications Specialist, FracTracker; and DrPH Student, University of Pittsburgh, Graduate School of Public Health, Environmental and Occupational Health department. (email) malone@fractracker.org
Special thanks to Jon Niles (Susquehanna University) and Bob Weber (PA Fish and Boat Commission) for their contributions to this article and efforts in the field!
https://www.fractracker.org/a5ej20sjfwe/wp-content/uploads/2012/05/UnassessedStreamsPA.png458782FracTracker Alliancehttps://www.fractracker.org/a5ej20sjfwe/wp-content/uploads/2025/09/2025-Wordmark-Logo.pngFracTracker Alliance2012-05-29 17:46:182020-07-21 10:39:38Surveying Unassessed Waters in PA
Ever wonder what we do with all the gas we’ve been producing?
In 2011, the United States consumed about 24.4 trillion cubic feet (Tcf) of natural gas, a 2.4 percent increase from 2010. From that total, just over 2 Tcf was used to fuel operations necessary to get the product to market, including production and recovery efforts as well as transportation of the product through pipelines. The remainder of the natural gas, about 22.3 Tcf, made its way to consumers.
Residential, commercial, and vehicle fuel usage have all been relatively flat over the past dozen years, save for a slight dip between 2005 and 2007, when the wellhead price of gas was around $6 to $8 per thousand cubic feet (Mcf). On the other hand, the amount used for electric power has increased 46 percent, while industrial usage has fallen 17 percent over the same period of time.
Much of this variation may be due to external factors, such as changes in industrial production or the fact that price of coal roughly doubled over the same time frame. And as a whole, the United States must have made significant progress in increased residential efficiency, because although there are 32 million more people now than in 2000, the residential sector actually saw a slight decrease in overall natural gas consumption.
But has the recent surge in domestic drilling activity reduced our dependence of foreign oil? Although oil imports were about one third less in 2011 than the 2005 peak, many experts think that is due to a combination of high prices (due mainly to Asian demand) and the less-than-robust US economy making fill-ups at the pump more painful, and therefore, less frequent.
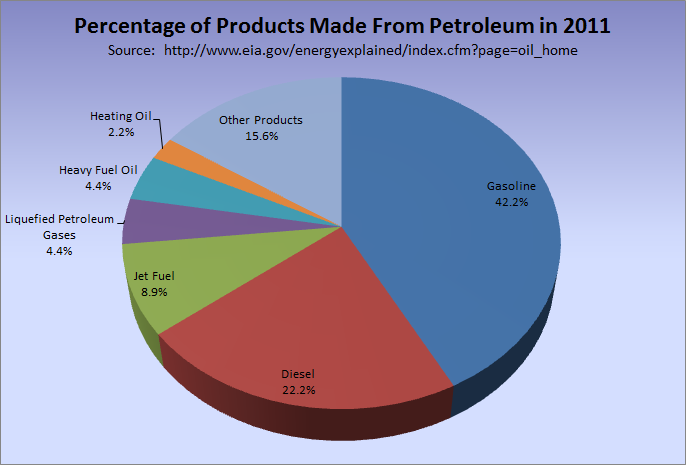
Consider that in the United States, the way we use natural gas and petroleum are really quite different. While many developing nations have millions of natural gas vehicles, the United States had fewer than 120,000 compressed natural gas (CNG) and liquefied natural gas (LNG) powered vehicles in 2010, explaining why vehicle fuel is barely a factor in the chart above. Compare that to petroleum, below, where gasoline, diesel, and jet fuel account for nearly three quarters of all petroleum usage:
Consumers can hardly be faulted for not buying natural gas powered vehicles: according to an interactive map on the US Department of Energy site, there are exactly seven CNG filling stations within a 100 mile radius of downtown Pittsburgh, and no LNG stations within that area.
So natural gas is not yet a major factor in replacing our primary use of petroleum, which is really to move people and things around. That could change though, if production remains high and prices remain low. That last part might be what has prevented a movement toward natural gas vehicles: currently, the price of CNG is about $2.13 per gallon equivalent, but if gas prices go back up to around $8 per Mcf (from the current $2.78) then gas may not seem like such a good deal again. One can only presume that fluctuations such as those factor into why the investments for CNG and LNG infrastructure is so limited.
The Haynesville Shale is a gas rich formation that underlies parts of Louisiana, Texas, and Arkansas. Technically a mudstone, it was deposited in the Upper Jurassic epoch, about 150 million years ago. As the chart below demonstrates, the Haynesville Shale is a major player in terms of shale gas extraction in the United States:
Unfortunately, the exact production values were not released along with this chart, but the Haynesville is clearly competitive with both the Barnett Shale and the Marcellus Shale, and may in fact outproduce both of them. So let’s take a look at the Haynesville, and with it, a look at the data distribution of the three states where it is located.
Haynesville Shale activity. Please click the grey compass rose and double carat (^) to hide those menus. For more information, click the blue “i” tool, then any map feature.
Arkansas
Arkansas has 64 wells drilled into the Haynesville formation, only a handful of which were drilled in the 21st Century. In fact, many of the wells listed are quite old, dating to the 1940’s. Taken together, the small number of wells and the age of those wells makes it clear that Arkansas is not much of a factor in the total output of the Haynesville Shale. In fact, the Haynesville wells in Louisiana stop well south of the border with the Natural State.
In terms of their data, the Arkansas Oil and Gas Commission provides access to data that many other states do not, including well stimulation data. Unfortunately, the data export feature seems to be a bit buggy, but luckily, the Haynesville data is practically unchanged from when I downloaded the data in 2010. Much of the dataset has location information in decimal degrees–the standard latitude and longitude format of the digital age. Many of the wells are only available in the archaic and arcane Public Land Survey System, which is still the legal way to describe locations in many western states. Louisiana
In all likelihood, the Pelican State contains the largest share of recoverable gas from the Haynesville formation. This assertion is based on activity rather than production: 2,400 Haynesville wells have been permitted since 2006, of which 2,194 have been spudded, and 1,985 have been completed.
The data released by Louisiana’s Department of Natural Resources has a certain elegance to it, in that the dates for permits, spuds, and original well completion can all be found on the same spreadsheet. What’s more, the same dataset contains location information in the preferred decimal degree format for the top and bottom of the wells, meaning that it is possible to map the lateral portion. Texas
With almost 100,000 producing gas wells in 2010, Texas accounts for one fifth of all such wells in the United States. The heart of the Haynesville Shale continues into the Lone Star State from the western border of Louisiana.
And yet, there are no wells in Texas on the map above. Why? I can tell you that as of the writing of this, there are 816 Haynesville wells in Texas, according to the well search tool of the agency which oversees the oil and gas industry, the Railroad Commission of Texas (RRC). I can quickly find production values, and even the lease number, and in other queries, there are even scans of original paperwork available online, digitally, and free of charge. What they don’t provide is location data. This omission seems to be consistent with the following statement on the RRC site:
The on-line research queries are intended for use by individuals needing specific information from the Railroad Commission. The use of automated tools to retrieve volumes of data can cause severe degradation of the Railroad Commission’s systems. If the query system detects that data is being retrieved using an automated tool, the Commission will end the session for that user.
The first sentence contains the philosophy, while the second statement frankly comes across as a lame excuse in 2012, especially for a state with such substantial activity and a healthy severance tax. It seems inconsistent to dedicate so much server space to scans of images without informing you where the location is–it’s a convoluted approach to data transparency, if ever there were one.
Perhaps my interest in mapping is a source of bias, but to me, the location of the well is the single most important data point. How can you determine what the potential impact of a well would be if you don’t even know where it is?
https://www.fractracker.org/a5ej20sjfwe/wp-content/uploads/2025/09/2025-Wordmark-Logo.png00Matt Kelso, BAhttps://www.fractracker.org/a5ej20sjfwe/wp-content/uploads/2025/09/2025-Wordmark-Logo.pngMatt Kelso, BA2012-05-17 15:09:012020-07-21 10:39:38A Look at the Haynesville Shale
Usually, I try to let readers know the state of affairs related to oil and gas extraction by taking a hard look at publicly available data. Sometimes, however, it seems like the simplest questions have an answer that starts off with, “Well, it’s complicated…” Such is the case when it comes to fines issued by the the Pennsylvania Department of Environmental Protection’s (PADEP) Office of Oil and Gas Management. Luckily PADEP releases data about fines issued to operators in its compliance report, but unfortunately, it can be confusing to interpret. Let’s take a closer look:
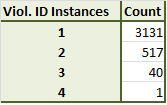
The first point of confusion is the compliance report itself. Specifically, there are more rows of data than there are violations, as counted by PADEP. The answer seems to be that PADEP counts the number of unique violation ID numbers, however sometimes (but not always), the same Violation ID will be used for multiple rows of data on the violation report. When I downloaded Marcellus violation data from January 1, 2005 through May 2, 2012, there were 4,293 rows of violation data, but only 3,689 unique violation ID’s.
Distribution of Violation ID frequency on the PADEP Marcellus Shale compliance report, January 1, 2005 through May 2, 2012.
If a violations are counted by unique Violation ID numbers, what then are we to make of the other 604 items on the list? They all have violation numbers, but share them with between one and three other incidents. My perception is that this is one of those decisions made in the field that has unanticipated consequences with respect to database maintenance. That is just a guess though–I’ve contacted PADEP for clarification on this point, and will be sure to relay that information when I receive it.
The second confusing aspect of the fines data is fairly similar in nature, in that identical fine amounts will often appear for multiple violations (or rows of violation data, as the case may be). This is an ostensibly reasonable thing to do; if PADEP can deal with a suite of related violations all at once, why not do so? But it does beg the question of whether the full fine is posted for each item on the compliance report, or whether it has been prorated between them.
I believe the former case to be correct. Take for example, the recent announcement of a fine issued by PADEP to Ultra Resources for improper storage of flowback water at a Potter County site. The announcement mentions a $40,000 fine, but the data reflects three fines assessed to Ultra for that amount on March 23, 2012 for three incidents with unique Violation ID numbers.
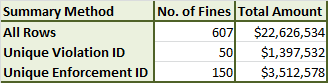
The implication is that if you go through the dataset and add up the value of all the fines, the result will almost certainly be wildly inflated. The same is true for the number of fines that have been assessed. However, there is something linking the three records together in the Ultra example: they all share the same Enforcement ID number. So perhaps that is the key? Let’s take a look at the total number and value of Marcellus fines assessed, with the data organized in three different ways:
Aggregated number and value of Marcellus related fines in PA from 1-1-2005 to 5-2-2012, by method.
Given that the three Ultra violations in the example above all had unique Violation ID numbers but shared the same Enforcement ID, my expectation was that aggregating the data by unique Enforcement IDs would yield the smallest (and most accurate) statewide totals. Clearly, that hypothesis needs to be relegated to the scrap heap, based on the table above.
And to be honest, I don’t have a better hypothesis on deck. I have also asked PADEP for clarity on this point, and will be happy to share that information when I receive a reply. But for now, I’m not even sure if it is possible to tease the correct answers from the data that have been provided. Which is a shame, because if we knew a reliable methodology for doing so, it would be possible to explore the topic in much more interesting detail, finding answers for questions like: Which company gets fined the most? What’s the ratio of violations to fines assessed? How many days pass between a violation being issued and a fine? (For this last one, I can tell you that the maximum amount of time so far is 755 days–I just can’t provide a reliable distribution of the results).
I like to give the DEP credit where it is due: they are making tremendous progress in their dissemination of oil and gas data. Two years ago, there were no compliance, production, or waste reports. Drilled well data was available, but much of it didn’t have location data, and you had to copy and paste from web tables to a spreadsheet, which didn’t always work very well. And some of the location data for permits were miles away from the actual well site with the corresponding API number. PADEP has come a very long way in the reliability and accessibility of their oil and gas data. Here’s hoping that trend continues.
https://www.fractracker.org/a5ej20sjfwe/wp-content/uploads/2025/09/2025-Wordmark-Logo.png00Matt Kelso, BAhttps://www.fractracker.org/a5ej20sjfwe/wp-content/uploads/2025/09/2025-Wordmark-Logo.pngMatt Kelso, BA2012-05-09 14:10:102020-07-21 10:39:38Pennsylvania Marcellus Fines Data
By Samantha L. Malone, MPH, CPH – Communications Specialist, FracTracker & DrPH Student, University of Pittsburgh Graduate School of Public Health, Environmental and Occupational Health department
Last week I attended the Institute of Medicine’s Workshop on The Health Impact Assessment of New Energy Sources: Shale Gas Extraction in Washington, DC. This was part of a larger research initiative to understand the potential health impacts of shale gas extraction as a whole. The meeting involved very balanced discussions among presenters and attendees, not on whether gas drilling should occur, but how it will impact health and how the effects can best be studied. For those of you who could not attend in person, here are some key points that were raised:
Dr. Aaron Wernham of Pew Charitable Trusts discussed the advantages of incorporating a Health Impact Assessment into the decision making process for drilling, highlighting an HIA’s ability to address local concerns and data gaps. For example, he mentioned that data has indicated there was a jump in syphilis rates in Ft. McMurray, Canada where drilling is heavy. Learn more about where HIA’s have been used in the U.S. here.
Traffic problems associated with drilling activity have been documented in many parts of the country, including Sublette County, WY. Learn more»
Dr. Charles Groat from the University of Texas at Austin discussed his research that suggests that most of the problems (violations/incidents) related to shale gas drilling are not those unique to unconventional natural gas extraction such as hydraulic fracturing, but to the more conventional processes and shale gas drilling’s surrounding infrastructure. He felt that many if not all of these are preventable if the entire industry implemented best practices. He posits that it is the intensity of drilling that has actually been the biggest contributor to the incidents and public concern about the safety of this process.
Dr. Allen Robinson from Carnegie Mellon University found that if the air emissions from active well sites were aggregated, they would be a significant contributor to regional air pollution. Emission are dependent on the composition of the gas (wet vs. dry).
Three quarters of the sand used for shale gas operations comes from Minnesota and Wisconsin (which could mean long transportation distances depending on the shale play where it is used). There is a significant amount of water used to clean the sand prior to transport, as well.
Research by Eric J. Esswein, M.S.P.H. of the National Institute of Occupational Safety and Health (NIOSH) indicates that respirable silica, found in the sand used for hydraulic fracturing, is the greatest exposure hazard to workers on shale gas drilling sites. Silica is often released into the air when the sand is mixed into the frac fluid. Part of this risk is due to the lack of awareness about how long term exposure to it could result in irreversible lung damage and because half face respirators do not fully protect the workers from silica. This exposure can be significantly reduced by installing special technological controls on the mixing equipment. While hydrogen sulfide (H2S) can be present on sites, Mr. Esswein reports that workers are well informed and prepared for this hazard. The second most concerning exposure on the work site is diesel particulate matter. Mr. Esswein emphasized that presently the most worker incidents are still related to mechanical problems/falls/traffic, not chemical exposures.
Dr. Timothy Kelsey discussed economic and community impacts in PA, noting that a significant challenge to the local economy presents when the drilling trend begins to slope downward. He also briefly mentioned that he has not seen significant community impacts being felt in northeastern PA that are normally associated with boom and bust cycles of resource extraction. However, there was some contention about that statement from attendees. For example, according to PennFuture, National Public Radio (NPR) recently reported that a group of churches in northern Tioga County opened the area’s first-ever homeless shelter to feed persons displaced by the influx of natural gas industry employees. Individuals working at a nearby drilling site reportedly made donations to help the work of the Jemison Brethren in Valley Christ Church. The establishment of this shelter was necessitated by the unintended impact of the shale gas industry on those in need of affordable housing — the poor and under-employed. In Williamsport, for example, the influx of industry workers caused moderately priced $400-per-month apartments to skyrocket to $1200. This set off a cascade of effects that ended with the lowest income persons being forced out of available housing.
Dr. Michael Honeycutt from the Texas Commission on Environmental Quality suggested that regulatory agencies in states where drilling is heavy should be actively monitoring ambient air (see map below) and periodically conducting fly overs of gas facilities with infrared cameras to detect fugitive emissions into the air.
This map displays the sites where TCEQ collects air sampling data and areas of non-attainment or near non-attainment for air quality standards. Click on it to be taken to TCEQ’s dynamic version.
Select slides from all of the presentations from this meeting are available for download here. Under the Other Meeting Resources tab on the right, click Presentations.
https://www.fractracker.org/a5ej20sjfwe/wp-content/uploads/2012/05/TexasAirMonitoringMap.png7441500FracTracker Alliancehttps://www.fractracker.org/a5ej20sjfwe/wp-content/uploads/2025/09/2025-Wordmark-Logo.pngFracTracker Alliance2012-05-07 12:31:322020-07-21 10:39:37Drilling Health Concerns and Research Covered at IOM Event
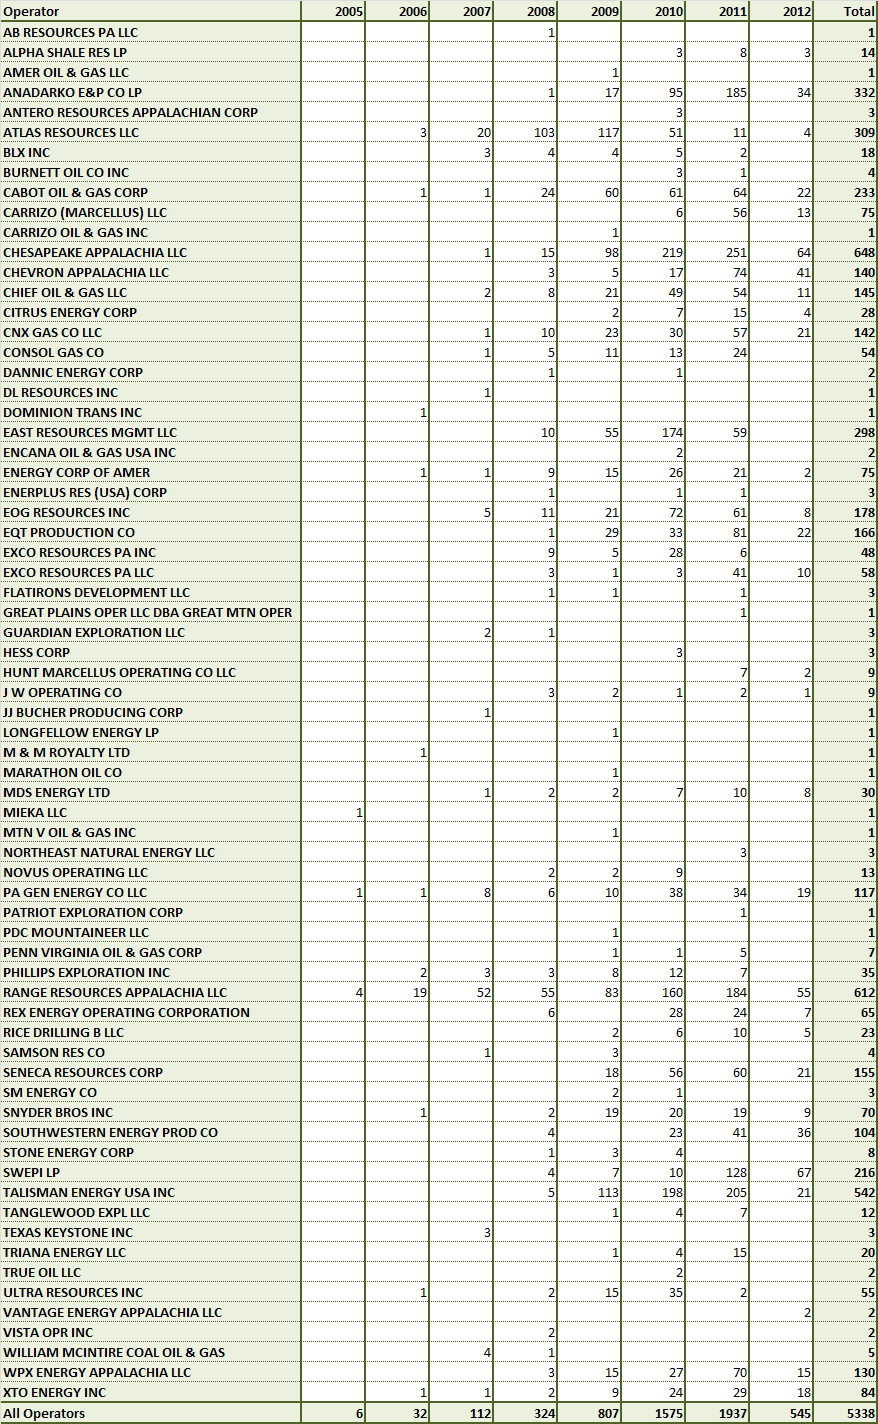
The roster of companies that drill into Pennsylvania’s Marcellus Shale is a long one: there are 70 different operators listed on the Marcellus Spud Report at the PADEP website. Here is a list of each operator, complete with annual totals since 2005:
Marcellus Shale wells drilled by operator by year, through May 2, 2012
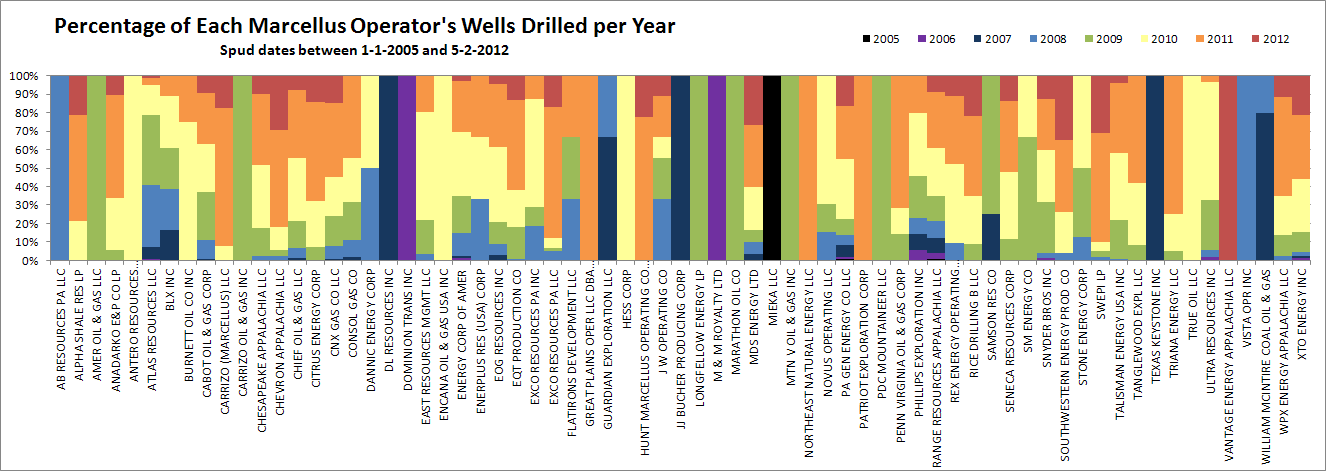
With the chart below, you can view the same data in a different way:
Percentage of each operator’s drilling activity by year. Please click the above image for a full sized view.
This graph is particularly useful for highlighting new operators, as well as those that are no longer drilling wells. When I show data trends for operators over time, I typically get multiple comments about mergers, acquisitions, and subsidiaries within the industry. Such comments are welcome, and yet any attempt to account for them on my end will almost certainly be incomplete, and therefore potentially misleading. For that reason, I have elected not to aggregate operators in any way, tempting though it may be to combine “Exco Resources PA Inc” and “Exco Resources PA Llc”.
Here are a few more observations about the data:
Atlas Resources drilled an industry-high 117 Marcellus Shale wells in 2009. The company is still active, but not on the same scale, drilling just 11 wells last year, and only four wells in the first four months of 2012.
The DEP has apparently made some retroactive changes to the operators for wells drilled in previous years. In this violations analysis from November, for example, Dominion Exploration and Production has 17 wells between 2006 and 2011. Now, the only Dominion well is for Dominion Trans Inc. The balance of Dominion wells was likely transferred to either Consol Gas Co or CNX Gas Co Llc, both subsidiaries of Consol Energy, which purchased Dominion’s Marcellus holdings in 2010.
Whatever prompted the DEP to reassign Dominion wells to other operators apparently didn’t apply for Shell’s 2010 acquisition of East Resources. Or at least it didn’t apply for all of East’s wells–in November, East was credited as being the operator for 342 wells, while they currently are on record for 298. Shell, which does business as SWEPI on this list, had no wells until 2011 on the November list, whereas now, they are listed as the operator for 21 wells that were spudded between 2008 and 2010.
With 545 wells drilled through the first 123 days of 2012, the industry is on pace to drill 1,617 Marcellus wells in Pennsylvania this year, down from 1,937 wells last year.
https://www.fractracker.org/a5ej20sjfwe/wp-content/uploads/2025/09/2025-Wordmark-Logo.png00Matt Kelso, BAhttps://www.fractracker.org/a5ej20sjfwe/wp-content/uploads/2025/09/2025-Wordmark-Logo.pngMatt Kelso, BA2012-05-04 15:13:592020-07-21 10:39:37Drilled Wells by Operator Over Time in PA’s Marcellus
At FracTracker, you could say that we are a bit obsessed about maps and data. The amazing map below was created and is updated by the PA Natural Heritage Program (PNHP). While this is a recurring project for PNHP, with the increase in shale gas activity in recent years it is ever more important to protect and document changes to sensitive ecosystems.
Important Natural Heritage Areas
Click on the map to check out a statewide interactive map featuring data from the County Natural Heritage Inventory. The results presented in this map represent a snapshot in time, highlighting the sensitive natural areas within Pennsylvania. Core habitat is outlined in red (places where any disturbance could be detrimental to certain ecological species), supporting landscape in purple, and landscape conservation areas in yellow.
By clicking on the map, you will be taken to the Heritage Program’s site where you can search the map by county, watershed, or an address to learn more about the protected areas near you. On this page you can learn about the species of special concern such as the Copperhead, the Bog Turtle, and Northern Cricket Frog.
About the Inventory
The County Natural Heritage Inventory is a cooperative program undertaken by the PNHP partnership. The County Natural Heritage Inventories (CNHI) have been systematic studies of the critical biological resources of the state, county by county. The primary focus of CNHIs has been on species of concern: those plants, animals, natural communities, and habitats most at risk of extinction at the global or local level. These projects are designed to identify, map and discus areas that support species of concern, exemplary natural communities and broad expanses of intact natural ecosystems that support components of Pennsylvania’s native species biodiversity. These areas are prioritized based upon their ecological qualities and provided with recommendations regarding their management and protection.
These studies were conceived as tools to assist in planning to avoid the accidental destruction of habitats supporting species of concern at both the county and municipal levels and have been used effectively in that capacity. CNHIs have been incorporated into comprehensive plans, consulted to plan development projects, and utilized by conservation organizations to prioritize their work. Additionally, these studies have been used to help in the development of recreational amenities, promotion of tourism industries and assistance in community development. CNHIs have also been a primary source for much of the Pennsylvania Natural Diversity Inventory permit review data. CNHIs can actually streamline economic and infrastructure developments by providing information on sensitive environmental features early in the planning process when adjustments can be made at little cost or delay.
The County Natural Heritage Inventory is a planning tool, and is not intended to be used as a substitute for environmental review. For more information, view the Statewide CNHI fact sheet.
Ohio is on the western edge of two enormous black shale formations in Appalachian Basin: the 390 million year old Devonian Period Marcellus Shale and the Utica Shale, formed from deposits in the Ordovician Period about 460 million years ago. Image source: Ohio Environmental Protection Agency
The Ohio Department of Natural Resources (ODNR) has made it easy to find shale gas data from these two formations.
This is provided that you are only interested in horizontal wells. ODNR sums up their opinion of the importance of horizontal wells thusly:
Effective immediately, the vertical permits (stratigraphic test well permits) have been removed from this listing. In the initial phases of both Marcellus and Utica exploration, they were listed to reflect exploratory activity. They are no longer necessary with the increase of horizontal permitting activity. As always, they are available through the Oil and Gas On-line Well Search (1).
To me, this seems like an arbitrary line in the sand for the ODNR to take, but then again, each state has its own quirks with dissemination of their oil and gas data. In Pennsylvania, for example, there is no way to determine a well’s source formation without a file review, other than whether or not the well is drilled into the Marcellus. And in New York, the entire debate is couched around the phrase “High Volume Horizontal Hydraulic Fracturing”, a specificity unmatched elsewhere in the basin, that includes well stimulations using more than 80,000 gallons of fluid. In many respects, the ways in which the states release their data are datapoints unto themselves, but then, that is the subject of a different post altogether.
So let’s take a look at the trends in Ohio for the deep shale gas formations:
Ohio shale gas permits, including Marcellus (blue) and Utica (red). Please note that Marcellus wells include horizontal and vertical permits, while Utica includes only permits for horizontal wells. Please click the gray compass rose and double carat (^) to hide those menus.
Horizontal Marcellus Shale permits issued in Ohio through 4-9-2012
Clearly, there is not nearly as much activity as there is in Pennsylvania or even West Virginia. Altogether, there have been 13 horizontal Marcellus permits issued in the Buckeye State, the most recent of which was nearly ten months ago. Seven of the permitted locations have been drilled so far.
Here’s the data from the Utica Shale:
Horizontal Utica Shale permits issued in Ohio through 4-9-2012
Altogether, there have been permits issued for 194 horizontal Utica wells, 60 of which have been drilled so far. Moreover, it seems to be in a period of rapid expansion; a distribution is reminiscent of the Marcellus in Pennsylvania in 2006 to 2007 (see link above).
Only nine of the sixty drilled wells were in production in 2011, four of which produced some oil from early completion and flowback phases, but no natural gas as of yet. None of the horizontal Utica wells were in production for the entire year in 2011.
Here are the statewide totals from the horizontal Utica wells:
Statewide production values from horizontal Utica Shale wells in Ohio in 2011
It is worth noting that over 59 percent of the gas production came from one well publicized Harrison County gas well–its 1.5 billion cubic feet of production is reported to be the source of 2 percent of the entire state’s gas production.
While that is an impressive quantity of gas from one well, it might be the oil production that is raising eyebrows in the industry. As this post is being written, oil prices are at $104 per barrel, and natural gas is trading at $1.92 per thousand cubic feet (Mcf). While there really isn’t much data to go on to determine if the results are typical, if there continues to be oil associated with the Utica gas to that extent, we may see more drilling rigs focused on the older formation, and fewer on the Marcellus.
The well database is here. There are some limitations on the utility of this database, however, as users cannot use formation as a search parameter, and searches are limited to 1,000 records. Upon request though, the ODNR did send me a DVD full of data. The information is available, it just takes some fortitude to slog through it.
https://www.fractracker.org/a5ej20sjfwe/wp-content/uploads/2025/09/2025-Wordmark-Logo.png00Matt Kelso, BAhttps://www.fractracker.org/a5ej20sjfwe/wp-content/uploads/2025/09/2025-Wordmark-Logo.pngMatt Kelso, BA2012-04-20 12:19:572020-07-21 10:39:36Shale Gas Trends in Ohio: Abandoning Marcellus, Embracing Utica
The following line chart shows the number of Marcellus Shale wells drilled in Pennsylvania from January 2007 through March 2012, and the number of violations issued (1) by PADEP over the same period of time:
Drilled Wells and Violations in PA’s Marcellus Over Time
While drilling activities in Pennsylvania’s Marcellus Shale really got under way in 2005, the threshold of 10 wells drilled in a month didn’t happen until 2007, so the earlier data has been omitted in favor of charts that are a little less crowded. Here are a few milestones that have happened along the way:
First month with more violations than wells: April 2008 (difference=8)
First month with 50 violations: June 2008 (n=82)
First month with 50 wells: June 2009 (n=75)
First month with 100 violations: July 2009 (n=101)
First month with 100 wells: November 2009 (n=111)
First month with 100 more wells than violations: September 2010 (n=109)
First month with 200 wells: August 2011 (n=212)
Longest streak with more wells than violations: 15 months (January 2007 to March 2008) (2)
Longest streak with more violations than wells: 7 months: (February to August 2009)
Second longest streak with more wells than violations: 11 months (May 2011 to March 2012)
Second longest streak with more violations than wells: 2 months (Aug.-Sept 2008 and Dec. 2009-Jan 2010)
Included in violations is the total number of records from the compliance report linked above during the given time period where the “Marcellus only” and “Inspections with violations only” fields are set to “Yes”. This inflates the number of incidents reported by PADEP, which keeps track through the number of unique violation ID’s issued, so that if two instances are issued the same violation ID, it will be counted as one violation.
This streak may well be longer if months prior to 2007 were included
https://www.fractracker.org/a5ej20sjfwe/wp-content/uploads/2025/09/2025-Wordmark-Logo.png00Matt Kelso, BAhttps://www.fractracker.org/a5ej20sjfwe/wp-content/uploads/2025/09/2025-Wordmark-Logo.pngMatt Kelso, BA2012-04-11 14:47:032020-07-21 10:39:36Drilling and Compliance in PA’s Marcellus Over Time