PA Data Shows Marcellus Wells 1.5 to 4 Times More Likely to Have Violations
Analysis by Offending Versus Drilled Wells
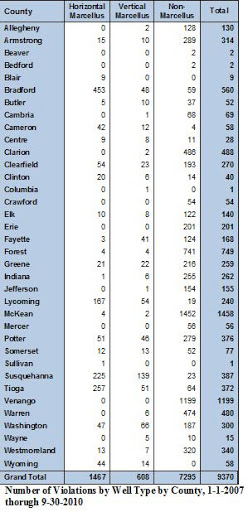
This map shows Marcellus Shale and other oil and gas violations issued between 1-1-2007 and 9-30-2010. [map removed]
In a recent post, I examined the relationship between different types of wells in Pennsylvania and the number of violations per offending well. This post expands on that theme by examining the number of violations per wells drilled, and addresses a number of complications that are associated with that analysis.
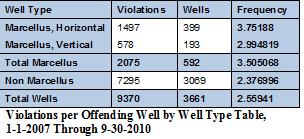
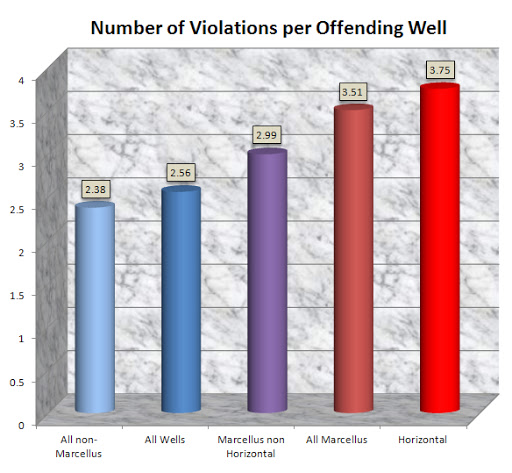
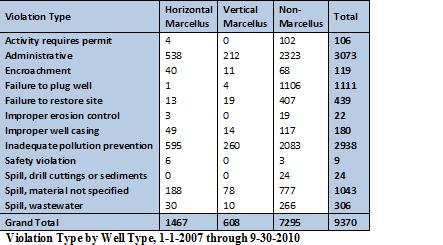
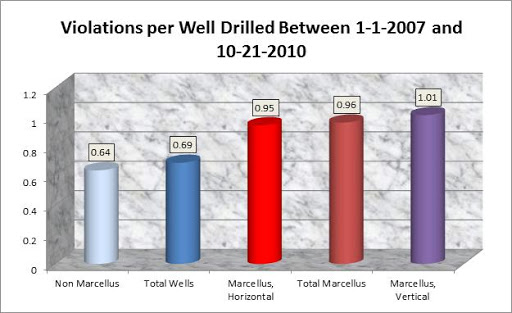
This graph shows the mean number of violations per well type in Pennsylvania. This is based on a list of 9,370 violations provided by the PA DEP from 1-1-2007 through 9-30-2010. Please note that this reflects only wells where violations occurred, not every well of this type within Pennsylvania.
This chart shows that of all the offending wells, Marcellus Shale wells clearly have more violations per well than their conventional counterparts, and that among the Marcellus wells, those that were drilled horizontally have more violations associated with them than vertical wells do.
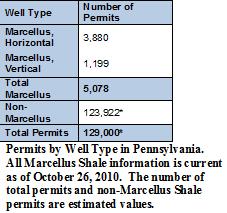
I focused on offending wells rather than total wells for two reasons. First, all of the data that I needed to do this analysis was complete from one source except for which wells were flagged as horizontal, which I obtained from permit information on the Department of Environmental Protection (DEP) website. On the other hand, I do not have any sort of estimate for the total number of wells drilled in the state. PASDA maintains a list of DEP data which contains at least 123,000 oil and gas locations, but there is no indication which of these have been drilled. The DEP maintains a list of drilled wells since 1998 on their website, but that omits well over a century of hydrocarbon production.
My second reason for focusing on offending wells was that I thought the values for the “All non-Marcellus” and “All Wells” categories would be bloated by their antiquity. After all, commercial oil wells have been in the state since 1859, while DEP data shows that the earliest Marcellus Shale well was spudded on March 6, 2006, and drilling began on the earliest horizontal well on February 12, 2008.
Even though the violations that I was considering were all issued after January 1, 2007, I had some reason to suspect a data skew of this sort: abandoned wells. The DEP violation list indicated 1,111 violations where the drilling operator failed to plug a well, all but five of which were not Marcellus Shale wells. This category alone accounts for nearly 12% of the total violations, and is almost certainly dominated by wells that were drilled long before the start date of the violation dataset.
Drilled Well Analysis
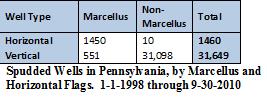
Keeping these factors in mind, I still wanted to take a look at how many violations per drilled well there were in the various categories, so I compared the violations data to the list of wells since 1998 mentioned above.
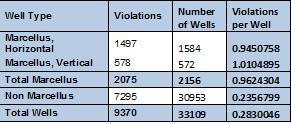
Number of Violations by Well Type for wells drilled between 1-1-1998 and 10-21-2010. All violations are from 1-1-2007 through 9-30-2010.
Number of Violations by Well Type for wells drilled between 1-1-1998 and 10-21-2010. All violations are from 1-1-2007 through 9-30-2010.
Obviously, my prediction of bloated values for non-Marcellus Shale wells is not supported by these numbers, with more than four times as many violations per drilled Marcellus Shale well than its conventional counterpart. Still, I am uncomfortable with this presentation of the data, due to the fact that it includes eight more years of traditional wells than Marcellus Shale wells. It does allow for the likelihood that older wells were included in the violation list, but perhaps overly so.
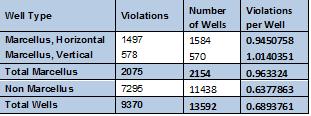
Number of Violations by Well Type for wells drilled between 1-1-2007 and 10-21-2010. All violations are from 1-1-2007 through 9-30-2010.
Number of Violations by Well Type for wells drilled between 1-1-2007 and 10-21-2010. All violations are from 1-1-2007 through 9-30-2010.
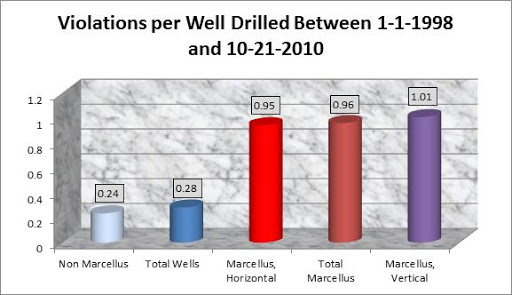
These are the numbers that are most affected by the large abandoned well data skew, and still Marcellus Shale wells are 1.5 times more likely to have a violation than their more conventional counterparts. All of the values for Marcellus Shale wells are nearly identical to the set from 1998 onward, because all but two of those wells are in both datasets. I consider the two datasets to be bookends for non-Marcellus Shale wells and total wells, since the data is skewed by time in different ways. Marcellus Shale wells are therefore somewhere between 1.5 and 4 times more likely to have violations than all other wells in the Commonwealth.
Horizontal Wells
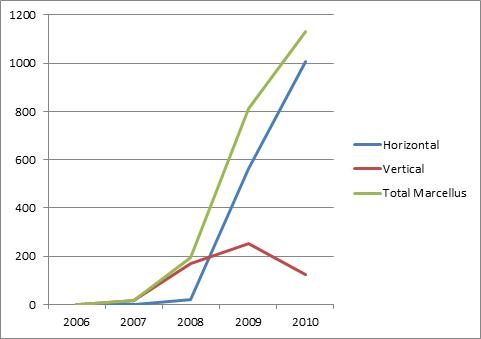
Marcellus Shale Wells by Type and Year, 2006 through 2010
But what about horizontal wells? When we considered violations per offending well, they had 0.76 more violations per well than vertical Marcellus Shale wells, but when compared to the total number of wells of those types, vertical wells actually had slightly more violations than horizontal wells. Why is this?
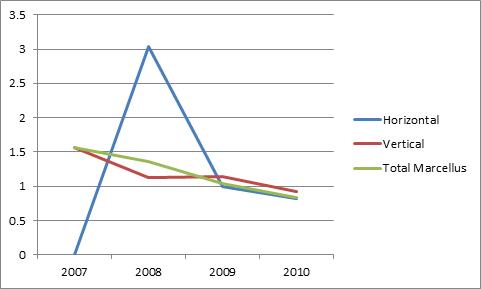
Marcellus Shale Violations per Drilled Well, 2007 through 2010
The 2008 spike in horizontal violations per drilled well is based on a very small sample size, and does not account for the difference that we are looking for. The opposing trends of the rapid expansion of horizontal wells and the steady erosion of the number of violations per well drilled certainly does, however. Most of the vertical wells were drilled when there were more violations per well, and most of the horizontal wells were drilled when there were fewer.
All of this begs the question: Why are there so many fewer violations per well than there were three years ago? Is it because the industry is more in compliance with the regulations, or that the DEP is not equipped to monitor the rapidly expanding industry? Are we getting the same level of environmental protection from the Commonwealth as we did in 2007? These questions should be a part of the policy discussion as Pennsylvania continues to understand the effects of Marcellus Shale drilling operations.