The majority of FracTracker’s posts are generally considered articles. These may include analysis around data, embedded maps, summaries of partner collaborations, highlights of a publication or project, guest posts, etc.
This page has been archived. It is provided for historical reference only.
Clearfield Blowout, June 2010
Photo credit: PA DEP
By Samantha Malone, MPH, CPH – CHEC Communications Specialist and DrPH Student, University of Pittsburgh Graduate School of Public Health
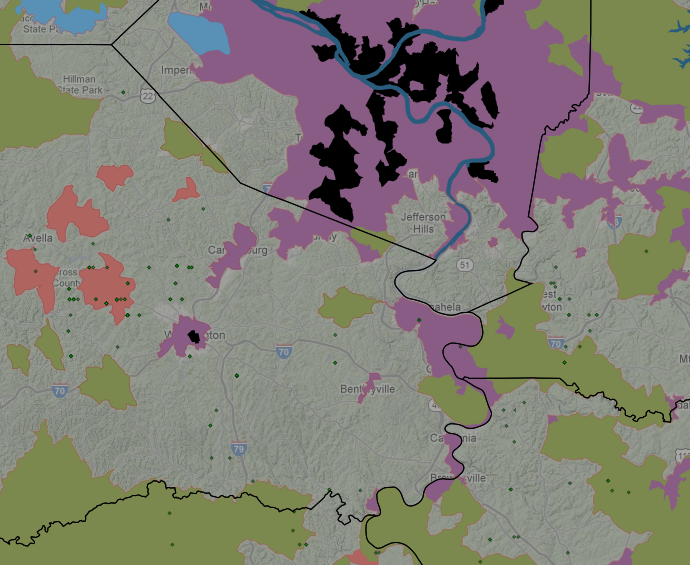
It came at a conspicuous time; on June 3, 2010 a Marcellus gas well blew out in Clearfield County, PA – less than two months after the BP Oil Spill in the Gulf (and before that spill was capped).
Luckily, the Clearfield blowout did not kill or injure workers or spill five million gallons into the ocean, but it does raise significant public health preparedness and environmental health questions.
The Pennsylvania Department of Environmental Protection (PA DEP) released a report stating that untrained EOG Resources personnel and improper control of the well were the cause of the blowout that released wastewater and methane gas into the atmosphere for 16 hours. EOG also failed to notify the DEP about the incident until several hours after it began.
The Clearfield well site in question is located in the center of PA off of I-80 (see map below).
[image removed]
Figure 1. The red square indicates multiple violations that occurred in one geographic location, the Clearfield blowout. Click on “i” to learn more about each square (record). (The map used to be private and visible on the DataTool only to members of CHEC, but it can now be seen by anyone.)
Many concerns and questions are associated with a blowout of this type:
Not including the danger to workers from the initial blowout, what if the gas being released had ignited?
What if the site had not been in the State Game Lands and been in a more populated or possibly urban area like Lawrenceville, a neighborhood in the city of Pittsburgh?
What if an explosion had occurred that caused the wastewater and gas to be released for much longer?
How can emergency responders be better prepared to handle issues of this magnitude?
How can communication channels be improved to reduce the amount of time between incident and proper response?
On the part of emergency responders, some progress is being made. CHEC continues to receive reports that more and more local first responders, including volunteer firefighters, are being trained in PA and WV to deal with potential accidents and blowouts on well sites. Additionally, the PA DEP has hired a team of responders throughout the state who are no more than five hours away from any drill pad.
Read the DEP’s full report on the Clearfield gas well blowout. [link removed]
https://www.fractracker.org/a5ej20sjfwe/wp-content/uploads/2025/09/2025-Wordmark-Logo.png00FracTracker Alliancehttps://www.fractracker.org/a5ej20sjfwe/wp-content/uploads/2025/09/2025-Wordmark-Logo.pngFracTracker Alliance2010-09-28 10:20:002020-07-21 10:35:41A Look Back at the Clearfield Blowout – Public Health Preparedness Considerations
By Samantha Malone, MPH, CPH – CHEC Communications Specialist and BCHS Doctoral Student, University of Pittsburgh, Graduate School of Public Health
Archived
This page has been archived. It is provided for historical reference only.
Water Contamination Potential
When the ‘new’ methods for gas extraction first appeared on the horizon in Pennsylvania, many citizens expressed concern that their water could become contaminated by the hydraulic fracturing process used to obtain natural gas from the Marcellus Shale. At the same time, the natural gas industry’s PR group, the Marcellus Shale coalition, claimed that “hydrofracking has [a] safe record and spurs [the] economy.” Preliminary research conducted by the Agency for Toxic Substances and Disease Registry (ATSDR) and the U.S. EPA in Pavillion, Wyoming suggest that a portion of citizens’ concerns might be warranted. (To learn more, read the PDFs numbered 2, 3, and 4 at the end of this post.)
Some researchers believe that gas extraction cannot be done without negatively impacting water quality due to the likelihood of well casings leaking over time (Dusseault, 2000). See excerpt below:
The consequences of cement shrinkage are non-trivial: in North America, there are literally tens of thousands of abandoned, inactive, or active oil and gas wells, including gas storage wells, that currently leak gas to surface. Much of this enters the atmosphere directly, contributing slightly to greenhouse effects. Some of the gas enters shallow aquifers, where traces of sulfurous compounds can render the water nonpotable, or where the methane itself can generate unpleasant effects such as gas locking of household wells, or gas entering household systems to come out when taps are turned on. Methane from leaking wells is widely known in aquifers in Peace River and Lloydminster areas (Alberta), where there are anecdotes of the gas in kitchen tap water being ignited. Because of the nature of the mechanism, the problem is unlikely to attenuate, and the concentration of the gases in the shallow aquifers will increase with time. (Dusseault, 2000)
Whether natural gas drilling – when done properly – can contaminate well water or the acquifer from which well water is obtained is a significant research question. Public health would suggest that this is an imperative issue considering the number of violations sited against companies drilling in Pennsylvania by the PA DEP. (See map below that shows Marcellus Shale wells drilled since 2007 and violations as of September 22, 2010. To view an individual record, click the “i” in the toolbar below the map and then click on the record about which you would like to obtain more information.)
[image removed]
The potential impacts that the natural gas industry could have on water quality and public health are some of the major reasons that the U.S. EPA is conducting a $1.9 million study on hydraulic fracturing, including a life-cycle analysis of the process. In order to better understand the relationship between drilling products and water resources, the EPA recently sent a letter to select hydraulic fracturing service providers that requests they release the constituents of their fracturing fluid, as well as specific information about other industry processes.
By Kyle Ferrar, MPH – EOH Doctoral Student, University of Pittsburgh GSPH
Archived
This page has been archived. It is provided for historical reference only.
Wastewater discharges are regulated through national pollutant discharge elimination system (NPDES) permits, and are based on the concept “the solution to pollution is dilution.” However, what happens when the diluting capacity of a river diminishes? If the natural gas industry will be producing 20 million gallons per day (MGD) of wastewater in 2011, but only retrieves 20% to 70% of the water used to drill and hydrofracture a well, over 28.5 to 100 MGD must be withdrawn from water resources1. Water withdrawals for the natural gas industry are permitted through the Pennsylvania Department of Environmental Protection (PA DEP) with the approval of the Department of Conservation and Natural Resources (DCNR). As water is withdrawn, the volumes of stream flow decrease. Water withdrawals must be conducted responsibly, so that the volumes of stream flow are not impacted. Decreasing flow decreases the assimilative capacity of waterways to dilute pollution, such as TDS. In the late summer and fall, lack of precipitation causes drought conditions, and accounts for the lowest flow periods each year. But in 2008 through 2010, flow in parts of the Monongahela River have been less than half than what they are typically, at this time of the year, according to the Army Corps of Engineers2.
[image removed]
Figure 1. Permitted surface water withdrawals in Pennsylvania are shown on the map, active as of April 2, 2010.
Figure 1 shows the permitted water withdrawals in Pennsylvania for commercial, industrial, and agricultural use, as well as the permitted water withdrawals for the oil and natural gas industry. There is a multitude of groups that rely on water withdrawals for their livelihood, including the oil and gas industry, labeled as red stars. The capacity of river flow to dilute pollutants to safe levels also depends on river flow, and has precise limits. The current assimilative capacity for pollution and TDS in the Monongahela River is showing signs of saturation, and is characteristically oversaturated during the dry season. Monongahela River communities are already urged to rely on bottled water rather than their own municipal tap water, for certain periods of the year. Therefore, at the current rate of natural gas industry water withdrawals, there is no longer any room left for further economic development of water resources in other sectors of industry within the Monongahela River basin, if public health is to be conserved.
The current water management practices of the natural gas industry during the regional dry season are likely to have contributed to higher TDS concentration in the Monongahela River. New regulations for treatment and discharge of wastewater are designed so that the wastewater does not result in a severe impact, but the issue of mediating sustainable withdrawals has not been addressed. The majority of the pollution in the Monongahela River is still suspected to be caused by issues of legacy pollution, such as extensive acid mine drainage within the watershed3. On the other hand, the water withdrawals in the Monongahela River watershed are potentially causing a cumulative impact on flow volume in the river that magnifies all forms of pollution by increasing the pollutant concentrations. Much more research needs to be conducted on this issue, to ensure safe and sustainable permitting practices for water withdrawals.
References
Penn State University, College of Agricultural Sciences, Agricultural Research and Cooperative Extension. 2010. Shaping proposed changes to Pennsylvania’s total dissolved solids standard, a guide to the proposal and the commenting process.
Puko, Tim. Silty Salty Monongahela River at risk from pollutants. Tuesday August 24, 2010. Pittsburgh Tribune Review.
Anderson, Robert M. Beer, Kevin M. Buckwalter, Theodore F. Clark, Mary E. McAuley Steven D. Sams, James I. Williams, Donald R. 2000. Water Quality in the Allegheny and Monongahela River Basins. USGS circular 1202.
https://www.fractracker.org/a5ej20sjfwe/wp-content/uploads/2025/09/2025-Wordmark-Logo.png00FracTracker Alliancehttps://www.fractracker.org/a5ej20sjfwe/wp-content/uploads/2025/09/2025-Wordmark-Logo.pngFracTracker Alliance2010-09-22 12:51:002020-07-21 10:35:41Do the natural gas industry’s surface water withdrawals pose a health risk?
This page has been archived. It is provided for historical reference only.
As of September 7th, 55 of 73 drilling companies that operate in the Marcellus Shale field in Pennsylvania have reported their production data, which has been compiled into a single Excel spreadsheet by the Pennsylvania Department of Environmental Protection (PA DEP). Click here to see the list. This dataset is quite raw, and far from complete. Even so, a review of the preliminary data is a worthwhile exercise, as it gives us some insight into the industry that we were unaware of before.
Production Overview
Before getting into the specifics of production, a few overall numbers for the state would be appropriate. Altogether, there were 5,678 rows of data, representing 3,954 distinct wells. Only 3,076 of the rows have production data.
Production refers not only to oil and gas, but to waste products, as well. The spreadsheet tracks production data in the following categories: Basic Sediment, Brine, Condensate, Drill Cuttings, Drilling, Frac Fluid, Gas, and Oil. It is not known whether the final release of the data, which is scheduled for November 2010, will have a greater or fewer number of categories. The data comes unsorted and without explanation, so the units of measure for all categories are not entirely certain at this time.
Basic Sediment
The first category, Basic Sediment, is a solitary occurrence, and the volume of production is listed as 1,179. Whether this reported amount is miscategorized, irrelevant, or just exceedingly rare is not known at this time. The exact nature of what Basic Sediments refers to is not clear at this time, either.
Brine
Eight hundred-one (801) of the reported Marcellus wells produced brine, with volumes ranging from 2 to 24,165. For the moment, there is no choice but to assume that all of this is reported in the same unit, which will be assumed to be gallons. To give an idea of distribution, some arbitrary comparisons have been made here as well: 149 of the 800 wells have brine production of 100 or less, and 12 of them have production of 10,000 or more. The total brine production reported statewide was 1,196,001.19.
Condensate
Condensate is presumed to be waste water from the process of removing gas that comes to the surface embedded in water, which must then be extracted in condensate tanks. Of all of the wells in the state, 124 reported on Condensate, but the vast majority of those came back with a volume of zero. There are eight wells that reported non-zero volumes, and those range from 18.08 to 113,096.34 for a total of 187,855.85 units.
Drill Cuttings
Drill Cuttings is the term used to describe the rocks and sediments that are removed in order to make the original well. There are ten items in this category, which range in value from 250 units to 8,527, for a statewide total of 15,594.07 units. The measure of unit is again unknown.
Drilling
The distinction between Drilling and Drill Cuttings is not clear at this time. Four hundred ninety-seven (497) wells reported production in this category, yielding between 0 and 27,200 units of product for a statewide total of 898117.53. As a point of comparison, 291 of the 497 wells produced 1,000 units or less, while 15 wells produced 10,000 units or more. Uncertainties about the unit of measure that were expressed in the Drill Cuttings section apply here, as well.
Frac Fluid
The following category is Frac Fluid, which should refer to the chemical additives that make up one percent or less of the solution that is injected into the wells to release pockets of gas which are trapped in the shale deposits. According to this data, however, statewide production in this category exceeds the production of Brine, which is the term usually used to describe the salty waste water that comes up from the wells that would include the Frac Fluid as a small component. We must, therefore, question whether there might be some discrepancies in the way in which different companies report their data, or whether the results are due to a simple unit of measure issue. At any rate, there are 383 wells reporting Frac Fluid production statewide for a total of 1,621,721.19 units, with individual values ranging from 0 to 32,778. Of those 383 wells, 157 produced 1,000 units or less, while 54 produced 10,000 units or more, and gallons seems like the most likely unit of measure.
Gas and Oil Production
Production by Reporting Operator
There are 872 wells with production information for gas, of which 240 wells are reporting zero gas production. Of the remaining 632 wells, production values range from 29 to 2,841,152 units for a statewide total of 179,779,048. According to http://geology.com/usgs/marcellus-shale/, production at the wellhead level is commonly recorded in terms of thousands of cubic feet (MCF), which would put the reported production of the Marcellus Shale wells in the state at about 180 billion cubic feet (BCF) for the year. Of the 632 wells with non-zero values, 271 produced 100 million cubic feet (MMCF) or less, while 360 produced more than that amount.
There is also oil production associated with the Marcellus Shale drilling operations, and values in this category have been recorded for 385 wells in the state. Only 155 of these wells have a production value other than zero, however. Values range from 10.76 to 20,741.66 units, which are presumed to be barrels, for a statewide total of 402,253.38 barrels.
In addition to these categories, there are also 2,600 records that are included in the report but don’t have production data for any of the categories. These are distinct from items in the categories listed above with a listed production volume of zero.
A Significant Undertaking and Further Discussion
Credit should be given to the PA DEP for undertaking the project of mandating and publishing production reporting of the Marcellus Shale gas extraction industry in the state. Further credit should be given since this data was provided well ahead of the planned release date of November 1, 2010. And they should be praised for publicly listing companies that were not in compliance with the regulations that demand the production reporting in the first place (click here to see the list of 33 compliant and 40 non-compliant companies).
But when you take the time to look at the data, the thing that stands out more than anything is that it is a disorganized mess. It is clearly incomplete; all forms of production are tossed into the same column, and no units of measure are provided for anything. Compare that with the records kept by Arkansas or Texas.
9/27/10 Updates…
A non-profit stakeholder group called STRONGER, State Review of Oil and Natural Gas Environmental Regulations, Inc., recently assessed the quality of the Pennsylvania’s hydraulic fracturing oversight program and presented the results in a report. In this report, STRONGER praised the strength of the PA DEP’s waste identification tracking and reporting process – In other states, production data are being tracked more extensively, but waste data are limited at best. Along those same lines, legislation is being proposed that will require more extensive reporting obligations on the part of well operators.
https://www.fractracker.org/a5ej20sjfwe/wp-content/uploads/2025/09/2025-Wordmark-Logo.png00Matt Kelso, BAhttps://www.fractracker.org/a5ej20sjfwe/wp-content/uploads/2025/09/2025-Wordmark-Logo.pngMatt Kelso, BA2010-09-21 09:15:002020-07-21 10:35:41Marcellus Shale Production Data – The Good, The Bad, The Ugly
By Tim Puko
Reposted from the Pittsburgh Tribune-Review
Archived
This page has been archived. It is provided for historical reference only.
The Monongahela River is at a crossroads.
Not just at the Point, where the dark, silty Mon — lifeblood to heavy industry — merges with the clearer Allegheny. The Mon might be one of the country’s most endangered rivers, according to scientists studying the river.
Since 2008, the river has filled each summer with levels of contaminants higher than in at least 10 years. What role the region’s gas boom might play in the pollution is unknown. State environmental officials are employing stronger regulations and may ask for federal intervention to save the river from new threats and a legacy of mine pollution…
… This spring, the DEP began the process to have the river designated as “impaired,” which would allow the federal government to set standards for river polluting. The Environmental Protection Agency would commission a study to determine limits for industrial dumping of total dissolved solids in the river.
To give you an idea of some of the water management issues facing the Mon and western PA, below is a snapshot created by Kyle Ferrar of CHEC. Natural gas drilling and hydrofracturing wastewaters are being discharged into surface water locations at the points marked with red stars. Surface water withdrawals classified as agricultural, commercial, industrial, and mineral are identified on surface waters with the diamonds.
[image removed]
Also, read this Pittsburgh Post-Gazette article about a recent public health presentation conducted by Dan Volz, Chuck Christen, and Samantha Malone of CHEC that discusses the contaminants estimated to be entering the Mon from facilities receiving natural gas drilling waste fluids.
For those who live in the four-state river basin where DRBC controls drilling development [image removed] … the Delaware River Basin Commission issued a moratorium on further Marcellus drilling while they prepare regulations. The DRBC is one of the first regulatory agencies to impose such a restriction.
https://www.fractracker.org/a5ej20sjfwe/wp-content/uploads/2025/09/2025-Wordmark-Logo.png00Guest Authorhttps://www.fractracker.org/a5ej20sjfwe/wp-content/uploads/2025/09/2025-Wordmark-Logo.pngGuest Author2010-09-14 14:16:002020-07-21 10:35:40Mon River Declared ‘Impaired’
Natural gas drilling site in Susquehanna County taken by Garth Lenz.
View other RAVE photos in the online gallery.
By Samantha Malone, MPH, CPH
Archived
This page has been archived. It is provided for historical reference only.
As Dr. Volz and I presented as part of Geneva College’s Colloquia Series today – right in the heart of PA’s Marcellus Shale play – I found myself brainstorming on what issues FracTracker’s DataTool can be used to help address, and what future research questions might result from its use. The next few blog posts of mine will follow that theme.
So the first question I would like to propose is what will happen to our region’s farms and their products if an industry can offer $5,000 an acre and 18% royalties (an approximation based on recent verbal reports from owners of mineral rights) to farmers, many of whom are feeling the squeeze financially?
This is a close up map of southwestern PA to take a closer look at how land is being used in Washington County, PA and comparing that with where gas wells are being drilled. The coral area of land, where more than 50% of it is cultivated as you can see, has several wells located within it.
Since many farmers are experiencing financial hardships, it is understandable that the monetary assistance that can at times be provided by leasing out their mineral rights would be a very beneficial (and attractive) option for the farmers. But what does this new temptation mean for the quality of our nation’s agriculture down the road? How will public health be affected, e.g. will access to local and fresh foods improve or decline? Will certain land owners be less motivated to farm? Will they use their signing bonuses and royalty checks to purchase new and better farming equipment, which hypothetically would improve the quality and quantity of the agricultural system? Or even, will more events like this one occur, when cattle had to be quarantined because they came in contact with waste water that leaked from an impoundment?
I would like to personally add… The consideration should be made that this is quite a rural / socio-economic environmental justice issue. On a related note, in this link you can read about an economic study published through the Institute for Public Policy and Economic Development. Below is the summary of the project’s purpose and goals.
The purpose of this project was to assess the current social and economic conditions relating to gas well development in the Marcellus Shale formation in Pennsylvania, with the goal of obtaining baseline data for future longitudinal assessment of subsequent community changes that occur in Appalachian counties. The study includes:
A Survey of Residents living in the Marcellus Region. A mail survey of a sample of households within selected Appalachian counties in the Marcellus Shale region in Pennsylvania was carried out to ascertain current views of residents concerning gas industry development in their areas and to obtain information about their perceptions of their communities.
Interviews with Key Informants. Interviews of approximately 60 stakeholders from public, private, nonprofit, and institutions were conducted in Pennsylvania, Texas, and Arkansas to ascertain their perceptions of current and future economic, social, and environmental impacts associated with large scale natural gas development.
This is an invitation to hear your opinions about any or all of the topics discussed above.
https://www.fractracker.org/a5ej20sjfwe/wp-content/uploads/2025/09/2025-Wordmark-Logo.png00FracTracker Alliancehttps://www.fractracker.org/a5ej20sjfwe/wp-content/uploads/2025/09/2025-Wordmark-Logo.pngFracTracker Alliance2010-09-09 22:05:002020-07-21 10:35:40What will happen to our farms?
This page has been archived. It is provided for historical reference only.
Reposted Article – Reuters
U.S. government officials urged residents of a Wyoming farming community near natural gas drilling sites not to use private well water for drinking or cooking because of chemical contamination.
“Sample results indicate that the presence of petroleum hydrocarbons and other chemical compounds in groundwater represents a drinking water concern,” the Environmental Protection Agency said in a statement about tests of 19 water wells around the town of Pavillion.
https://www.fractracker.org/a5ej20sjfwe/wp-content/uploads/2025/09/2025-Wordmark-Logo.png00Guest Authorhttps://www.fractracker.org/a5ej20sjfwe/wp-content/uploads/2025/09/2025-Wordmark-Logo.pngGuest Author2010-09-02 16:08:002020-07-21 10:35:40EPA Finds Wyoming Drinking Water Wells Contaminated Near Gas Drilling Sites
This page has been archived. It is provided for historical reference only.
Penn Future’s “Keep the Promise” tour will provide opportunities for people to speak up about/ask questions about the coupling of a severance tax to forced pooling. A severance tax would mean that the gas coming out of drilled Marcellus Shale wells would be subject to a particular tax (to benefit the PA’s budget and possibly conservation groups and the like). Forced pooling refers to the practice of compelling landowners who have not or do not want to lease their mineral rights to be part of a drilling unit with neighbors who have agreed to allow drilling to occur. The snapshot to the left shows all Marcellus Shale drilling permits vs drilled wells since 2007. [image removed]
You must sign up ahead of time. The sessions will have local legislator(s) present:
September 8, 2010
South Hills, Allegheny County — 8:00-10:00 a.m.
Georgetown Centre, 526 East Bruceton Road, Pittsburgh, PA 15236
Participants: *Jan Jarrett, PennFuture President and CEO *Representative David Levdansky (D-Allegheny and Washington) *John Arway, Executive Director, Pennsylvania Fish and Boat Commission *Roy Kranyk, Executive Director, Allegheny Land Trust
September 9, 2010
Jersey Shore, Lycoming County — 7:00-9:00 p.m.
Robert H. Wheeland Center, 1201 Locust Street, Jersey Shore, PA 17740 (part of Citizens Hose Company, Station 45)
Participants: *Jan Jarrett, PennFuture President and CEO *Representative Garth Everett (R-Lycoming) *Representative Mike Hanna (D-Clinton and Centre) *Representative Richard Mirabito (D-Lycoming) *Joel Long, Clinton County Commissioner *Tim Schaeffer, Director of Policy, Planning and Communications, Pennsylvania Fish and Boat Commission *Dave Rothrock, President, Pennsylvania Council of Trout Unlimited
September 10, 2010
Scranton, Lackawanna County — 8:00- 10:00 a.m.
Radisson Lackawanna Station Hotel, 700 Lackawanna Avenue, Scranton, PA 18503
Participants: *Jan Jarrett, PennFuture President and CEO *Senator Lisa Baker (R-Luzerne, Monroe, Pike, Susquehanna, Wayne and Wyoming) *Representative Kevin Murphy (D-Lackawanna) *Robert Hughes, Executive Director, Eastern Pennsylvania Coalition for Abandoned Mine Reclamation *Tim Schaeffer, Director of Policy, Planning and Communications, Pennsylvania Fish and Boat Commission
September 13, 2010
Gettysburg, Adams County — 8:00-10:00 a.m.
The Dobbin House, 89 Steinwehr Avenue (Business Route 15 South), Gettysburg, PA 17325
Participants: *Jan Jarrett, PennFuture President and CEO *Department of Conservation and Natural Resources (DCNR) Secretary John Quigley *Senator Richard Alloway (R-Adams, Franklin and York) *Representative Dan Moul (R-Adams and Franklin) *Larry Martick, District Manager, Adams County Conservation District *Kyle Shenk, The Conservation Fund *Loren Lustig, Boating Advisory Board, Pennsylvania Fish and Boat Commission *Andrew Heath, Executive Director, Renew Growing Greener Coalition
September 16, 2010
Horsham, Montgomery County — 8:00-10:00 a.m.
Otto’s Brauhaus, 233 Easton Road, Horsham, PA 19044 (along PA Route 611)
Participants: *Jan Jarrett, PennFuture President and CEO *Representative Tom Murt (R-Montgomery and Philadelphia) *Representative Rick Taylor (D-Montgomery)
September 17, 2010
Essington/Tinicum, Delaware County — 8:00-10:00 a.m.
Lazaretto Ballroom, 99 Wanamaker Avenue, Essington, PA 19029
Participants: *Jan Jarrett, PennFuture President and CEO *Senator Edwin Erickson (R-Delaware and Chester) *Representative Nick Miccarelli (R-Delaware) *Representative Greg Vitali (D-Delaware) *Olivia Thorne, President, League of Women Voters of Pennsylvania
RSVP today to secure your spot at a tour event. Pre-registration is required two days prior to each event. There will be no on site registration.
Information Complements of:
Tracy Carluccio
Deputy Director
Delaware Riverkeeper Network
300 Pond Street, 2nd Floor
Bristol, PA 19007
Phone: 215 369 1188 ext 104 www.delawareriverkeeper.org
https://www.fractracker.org/a5ej20sjfwe/wp-content/uploads/2025/09/2025-Wordmark-Logo.png00FracTracker Alliancehttps://www.fractracker.org/a5ej20sjfwe/wp-content/uploads/2025/09/2025-Wordmark-Logo.pngFracTracker Alliance2010-08-30 13:49:002020-07-21 10:35:40Opportunities to Make Your Voice Heard about Forced Pooling
This page has been archived. It is provided for historical reference only.
Among our initial discussions with stakeholders and users of the DataTool, it was often suggested that CHEC introduce new data categories instead of the standard ones that define data on the DataTool, and then list those groups on the blog for people less familiar with the navigation of FracTracker’s DataTool.
Matt Kelso, our new data manager, has quickly assessed the data currently found on the DataTool and made some recommendations as to how all of the datasets can be defined and posted on the blog. The metadata (descriptions of the data’s origins, keywords, timeliness, etc) associated with each dataset is also an important feature within the DataTool that also needed some attention. In addition to taking an inventory of the datasets that have been posted to data.fractracker.org (the DataTool), Kelso attempted to bring some clarity to the various categories, and made some notes as to the quality of the metadata that was provided. The 79 datasets that currently exist on the DataTool can fit into one of the following categories (frequencies of each are parenthetical):
Comparative data
Demographics (4)
Geologic formations – gas fields (3)
Geologic formations – other (2)
Physical geography (2)
Political boundaries (6)
Wildlife habitat (4)
Environmental Data
Air quality (6)
Land quality (1)
Water quality (3)
Industry Activity
Drilling permits (28)
Gas well sites (6)
Incident reports and regulations (7)
Community Impact
Community health data (2)
Interview data (3)Other
Other (2)
In fact, the two datasets best described by “Other” are tests that have been scheduled for deletion. This is not to say that there might not eventually be more legitimate categories—perhaps an agricultural or economic dataset will eventually be uploaded to the site, but until they are, it is probably best to keep the number of categories to a minimum. Currently users do not need to choose one of the above categories to define their datasets, but we are considering adding that as a requirement, with perhaps an option for a secondary category. We would appreciate your feedback on that issue and the proposed categories.
Some users have experienced difficulty using the geographic search tool located on the Explore page. Kelso suggests that rather than drawing a rectangle on the screen to define a geographic location (as it stands now), it might be better to allow users to narrow their searches by a specific state or region. In reality, it is only as reliable as the data that’s been provided. For example, there are five datasets that relate to Marcellus drilling permits in Ohio, but if you look up the word “Ohio” there will not be any results, since the information was entered as “oh”. For this reason, Kelso suggests that the data uploader be required to select a geographic location from a drop-down box, as well.
We welcome your suggestions!
https://www.fractracker.org/a5ej20sjfwe/wp-content/uploads/2025/09/2025-Wordmark-Logo.png00FracTracker Alliancehttps://www.fractracker.org/a5ej20sjfwe/wp-content/uploads/2025/09/2025-Wordmark-Logo.pngFracTracker Alliance2010-08-30 11:50:002020-07-21 10:35:39Adding Data Categories to Blog and DataTool
Piloting FracTracker in the Marcellus Shale Region
Archived
This page has been archived. It is provided for historical reference only.
By Conrad (Dan) Volz, DrPH, MPH – Assistant Professor, Department of Environmental and Occupational Health, University of Pittsburgh, Graduate School of Public Health (GSPH); Director, Center for Healthy Environments and Communities; Director, Environmental Health Risk Assessment Certificate Program, GSPH
This document explains the fractracker.org web-platform for tracking shale gas environmental and environmental health, social and behavioral health, emergency preparedness, community, general, and public health, and associated land use impacts. Over time, we envision it to be able to track economic, demographic, and other important variables that any organization or individual is interested in exploring. This is being written in part because we at CHEC have been actually overwhelmed in the past few weeks by requests from other shale gas plays to use the platform.
So to start, FracTracker is funded by the Heinz Endowments, managed by the Center for Healthy Environments and Communities (CHEC) [a center within the Department of Environmental and Occupational Health at the University of Pittsburgh, Graduate School of Public Health], and hosted by the Foundation for Pennsylvania Watersheds. The platform architecture was built by Rhiza Laboratories [a division of Maya designs].
If you notice at the top of this blog that it says it is dedicated to tracking Marcellus Shale gas extraction impacts—please do not be put-off if you are interested in other shale gas plays or even in other oil and gas extraction and hybrid activities. This site can help you — and also you can help it!
FracTracker’s Data Tool is being piloted in the Marcellus Shale, but any citizen, organization, activist, even government organizations and industries themselves can use this tool to help visualize oil and gas extraction impacts in any region of the country or even throughout the world. It is mainly being developed though to help in tracking impacts of unconventional gas and oil and other byproduct extraction by stimulation technology commonly referred to as hydrofracturing within the United States. Although a better term might be ‘high pressure chemical fluid fracturing’; industry words don’t characterize well many of the processes, as we often hear about flowback and produced water, which are best labeled contaminated fluids. Flowback water bears as much resemblance to water as waste effluent from steel or chemical plants do.
So our focus right now is to pilot this web-platform in the Marcellus Shale and general Appalachian Devonian shale formations that are primarily in Pennsylvania, New York and West Virginia but also cover portions of Ohio, Maryland, Virginia, Kentucky and even across Lake Erie. The site was launched in the last week of June 2010 at a meeting in Bedford, PA that included data providers and users from community groups, environmental organizations, regulatory agencies, academia, and foundations-primarily from the state of Pennsylvania. Following this ‘kickoff’ meeting, others have been held in Pittsburgh, PA (SW PA – epicenter of gas extraction), Danville, PA (NE PA – an epicenter of gas extraction activity), and Ithaca NY. The purpose of these meetings has been to inform groups and institutions about this tool and get buy-in for data gathering and sharing and most importantly forming a network of groups interested in visualizing impacts of gas extraction operations and predicting environmental and social impacts, and health effects under multiple scenarios of the development of the industry. Certainly we know from past shale gas and oil plays that this is unlike industrial process such as coal burning for power production in that the oil and gas industry develops over a wide geographical area with many sources for both air and water pollution. Many gas extraction processes are small enough to not need permitting under existing regulations, but taken as a whole will contribute widely to air pollution effects such as ozone formation and surface water quality deficits from disposal of contaminated fluids into sewage treatment plants.
Our funding for this project is thus limited right now to Marcellus Shale, but it has always been envisioned that the platform would be used across the country. The design of this tool is therefore an ongoing project. Although CHEC does not have funds to actively manage data from other shale plays currently, we certainly encourage groups-individuals-regulatory agencies-environmental organizations to use the tool in areas of the country that you are interested in and to populate the data tool with databases that would be useful in showing locations of wells, population density, income, natural resources, landforms, endangered species, air and water quality, health outcomes, watersheds and rivers etc. All data must be geolocated (with a latitude and longitude), as that is what allows visualization of the dataset on the Google earth maps.
The tool is really pretty easy to use once data is stored on it (getting data on it is not so simple at the present time, as there are only a few types of file formats it accepts, and knowledge of how to transform some databases is necessary; we are working on that also). It is quite easy to overlay databases on each other to visualize and tell stories about extraction activities and for academics it is an interesting hypothesis generating device. Two stories highlighted on the blog that were easily produced were:
Overlay of sewage treatment plants (STP) accepting contaminated fluids in PA with watersheds and rivers; and
Marcellus Shale gas extraction permits in PA with existing ozone monitors operated by regulatory authorities
The overlay of STP accepting contaminated fluids from drillers and watershed and rivers was important to be able to see the proliferation of disposal into the Monongahela River and calculate the total poundage of dissolved solids, strontium, barium and chlorides going into that watershed; as a result we are launching a study of the major cations and anions and organic compounds that are being put directly into this critical drinking water source. Overlaying Marcellus Shale drilling permits and drilled wells onto a map showing the location of ozone monitors helped us visualize the many areas in PA where there are no ozone monitors but will or are undergoing extraction activity-given the present monitoring scheme—ground level ozone formation due to organic vapor release from fracing ponds-evaporation centers-condensers-cryo plants and compressors cannot be determined; so as a result we are launching an ultraviolet spectroscopy study (UV-DOAS) of volatile organic compounds being released in a heavily developed area south of Pittsburgh.
I also encourage environmental organizations, community groups, and regulatory authorities to contact CHEC if you would like to use FracTracker or if you would like to discuss ways in which we can all work together. We can certainly help users of the web-platform work through technical issues associated with its use – but again and most importantly, since we are public health scientists, getting data on health effects even perceived health effects, is a way to document effects from this industry for use in more detailed epidemiological studies. Having reports from other shale gas plays is important to do good population-based science. We feel that the networking aspect of this across the country is maybe its most important outcome. We are interested in talking with organizations that want to pursue funding to work on this in other areas. To these end please contact Samantha Malone, MPH, CPH -CHEC Communications Specialist (contact information below) to discuss using FracTracker’s blog and data tool. If you would like to talk about networking opportunities ask for me when you call 412-624-9379.
Gesundheit – Dan Volz
FracTracker General Contact Information:
Samantha L. Malone, MPH, CPH
Communications Specialist, CHEC
Phone: (412) 624-9379
Email: malone@fractracker.org
https://www.fractracker.org/a5ej20sjfwe/wp-content/uploads/2025/09/2025-Wordmark-Logo.png00FracTracker Alliancehttps://www.fractracker.org/a5ej20sjfwe/wp-content/uploads/2025/09/2025-Wordmark-Logo.pngFracTracker Alliance2010-08-24 16:00:002020-07-21 10:35:39FracTracker Blog and Data Tool for Use in Shale Gas and Oil Plays throughout the Country