Potential Shale Gas Extraction Air Pollution Impacts
How Organic Compounds Contained in the Shale Layer Can Volatilize Into Air, Become Hazardous Air Pollutants and Cause Ozone Formation
By: Conrad Dan Volz, DrPH, MPH; Drew Michanowicz, MPH, CPH; Charles Christen, DrPH, MEd; Samantha Malone, MPH, CPH; Kyle Ferrer, MPH – Center for Healthy Environments and Communities (CHEC), University of Pittsburgh, GSPH, EOH department
Part II explains how volatile organic compounds (VOC’s), which are HAP’s, form ozone in the lower atmosphere (otherwise known as ground level ozone) and uses maps generated for other regional studies of other precursor contaminants to lay a basis for formation ozone over the Marcellus area.
Part I: How organic compounds in the shale layer enter air and become Hazardous Air Pollutants
Since this article is on potential human exposure to airborne volatile organic compounds from shale gas operations, we will limit the following narrative conceptual model to how organic compounds in the shale gas layer itself can be mobilized by the hydraulic fracturing and above ground operations to become airborne and present an inhalation hazard.
An exhaustive search of the literature was done to obtain peer reviewed articles on Marcellus or other shale play flowback and produced water and concentrations of organic compounds in this water; no scientific articles were found that look specifically at organic compounds when well stimulation technology is used. Additionally, no papers were found that characterize organic compounds in flowback or produced water from Marcellus Shale wells over the region, which may vary significantly; anecdotal information suggests that wet gas containing organic compounds is an important byproduct in SW PA, whereas dry gas is more common in NE PA.
However, we can piece together good evidence that flowback and produced water from shale layers themselves contain organic compounds that could offgas into the environment when brought to the surface. First, gas-productive shale formations occur in Paleozoic and Mesozoic rocks in the continental United States and are characterized as fine-grained, clay- and organic carbon–rich rocks that are both gas source and reservoir rock components of the petroleum system (Martini et al., 1998). Gas is of thermogenic or biogenic origin and stored as sorbed hydrocarbons, as free gas in fracture and intergranular porosity, and as gas dissolved in kerogen and bitumen (Schettler and Parmely, 1990; Martini et al., 1998). Kerogen and bitumen are extremely large molecular weight and a diverse group of organic compounds that could also be broken into many smaller organic compounds during the hydrofracturing process given the high pressures used, the temperatures at depth and the chemical additives added to make the water slick. The USGS factsheet 2009–3032 states clearly that hydrofrac water “in close contact with the rock during the course of the stimulation treatment, and when recovered may contain a variety of formation materials, including brines, heavy metals, radionuclides, and organics that can make wastewater treatment difficult and expensive” to dispose of, although no supporting documentation is provided (Soeder and Kappel, 2008).
Certainly gas shales contain numerous organic hydrocarbons; we know, for example, that the Marcellus contains from 3-12% organic carbon (OC), the Barnett: 4.5% OC, and the Fayetteville: 4-9.8% OC (Arthur et al, 2008 ). A whitepaper describing produced water from production of crude oil, natural gas and coal bed methane and prepared by researchers at the Argonne National Laboratory, reports that volatile hydrocarbons occur naturally in produced water and that produced water from gas-condensate-producing platforms contains higher concentrations of organic compounds then from oil-producing platforms (see below a description of organics from oil and gas producing platforms in the Gulf of Mexico) (Veil et al., 2004). Organic components of this produced water consist of C2-C5 carboxylic acids, ketones, alcohols, propionic acid, acetone and methanol. The concentration of these organics in some produced waters can be as high as 5,000 parts per million (ppm). This study further states that
Produced waters from gas production have higher contents of low molecular-weight aromatic hydrocarbons such as benzene, toluene, ethylbenzene, and xylene than those from oil operations; hence they are relatively more toxic than produced waters from oil production. (Veil et al., 2004)
… aliphatic and aromatic carboxylic acids, phenols, and aliphatic and aromatic hydrocarbons. Partially soluble components include medium to higher molecular weight hydrocarbons (C6 to C15). They are soluble in water at low concentrations, but are not as soluble as lower molecular weight hydrocarbons. They are not easily removed from produced water and are generally discharged directly. (Veil et al., 2004)
A dated but very informative paper on the contaminants in produced water in the Gulf of Mexico is “Petroleum drilling and production operations in the Gulf of Mexico” by C.S. Fang (1990). Here, “produced water” is referring to formation water or water condensed from the flowing gas mixture in the production tubing string only since these wells are not stimulated. The paper states that the largest discharge by volume from an offshore platform is from produced water. The organic compounds in the produced water come from three sources:
- Organic compounds extracted from the crude oil,
- Chemicals added to produced water or put into a producing well – such as corrosion and scale inhibitors, scale solvents, biocides, antifreeze, and oil and grease, and
- Impurities in the chemicals used.

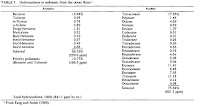
The authors of this paper also found significant organic compounds in ocean floor sediments near oil and gas platforms. This of course has important ramifications for what organics are contained in frac pond sludge from on shore shale gas extraction and hint that this material should be tested using TCLP methods to see if it is hazardous waste. Certainly buried pits containing sludge could continue to offgas organic vapors from this sludge material. The table below extracted from this paper shows the organic contaminants in the ocean floor sediments.

So now that we have established the mobilization of organic chemicals in flowback and produced water, how do they get into the air which we breathe? If you remember back to your chemistry class in high school or college you may remember something known as the Henry’s Law constant. The Henry’s Law constant (H) of an organic compound determines its ability to enter the air. Compounds that have high H’s can enter the air from water easily, whereas compounds with low relative H’s enter the air less well- and they enter the air from the water phase dependant on their concentration in water, their concentration in air and the prevailing temperature and pressure. Again, remember PV=nRT (pressure times volume equals the mole fraction times the gas constant times temperature in degrees Kelvin) Hang in there, I know it is coming back to all of you. They enter the air then when the concentration of the compound in air is lower than that in water, which is generally the situation unless you live on some planet that has toxic organic vapor levels in air or next to a petrochemical plant during some crisis! And they can be envisioned as entering the air by either of two models: 1) the stagnant air-water model or 2) the circulating packet model.Using either model, the flowback or produced water that returns to the surface and goes into a frac pond-pit or impoundment will offgas (become a vapor in air) its organic compounds into the air. This becomes an air pollution problem, and the organic compounds are now termed Hazardous Air Pollutants (HAP’s). Additionally, separators, condensers, cryo plants and compressors can leak causing these volatile organic compounds to enter air. Incomplete combustion in flaring also adds VOC’s to air.
Part II: How volatile organic compounds act as precursor chemicals for the formation of ozone when combined with nitrogen oxides and carbon monoxide
Exposure to ground level ozone has been linked in many scientific studies to:
- airway irritation, coughing, and pain when taking a deep breath,
- wheezing and breathing difficulties during exercise or outdoor activities,
- inflammation, aggravation of asthma and increased susceptibility to respiratory illnesses like pneumonia and bronchitis, and
- permanent lung damage with repeated high exposures.
Ground level ozone also interferes with the ability of sensitive plants to produce and store food, making them more susceptible to certain diseases, insects, other pollutants, competition and harsh weather. It damages the leaves of trees and other plants, and reduces forest growth and crop yields, potentially impacting species diversity in ecosystems (EPA, 2008).
The best explanation for formation of ozone that I know of is contained in the 2008 EPA Air Quality Criteria for Ozone and Related Photochemical Oxidants (The entire 3 part EPA document is attached after this article). Ozone is a secondary pollutant that is formed in polluted areas by atmospheric reactions involving two main types of precursor pollutants volatile organic compounds (VOC’s) and nitrogen oxides (NOx). Carbon monoxide (CO) from incomplete combustion of fuels is also an important precursor for ozone formation. The formation of ozone and other oxidation products (like peroxyacyl nitrates and hydrogen peroxide), including oxidation products of the precursor chemicals, is a an extremely complex reaction that depends on the intensity and wavelength of sunlight, atmospheric mixing and interactions with cloud and other aerosol particulates, the concentrations of the VOC’s and NOx in the air, and the rates of all the chemical reactions. The EPA figure below shows all the possible reaction pathways and products that might be formed in both the troposphere (the lowest major layer, extending from the earth’s surface to about 8 km above polar regions and about 16 km above tropical regions) and the stratosphere (that is from the top of the troposphere to about 50 km above the earth’s surface). What happens in the lowest sublayer of the troposphere known as the planetary boundary layer (PBL) is most important for formation of ground level ozone and other reactive species that can cause health effects and is most strongly affected by surface conditions.
 “VOC refers to all carbon-containing gas-phase compounds in the atmosphere, both biogenic and anthropogenic” (biological and manmade) “in origin, excluding CO and CO2. Classes of organic compounds important for the photochemical formation of O3 include alkanes, alkenes, aromatic hydrocarbons, carbonyl compounds (e.g., aldehydes and ketones), alcohols, organic peroxides, and halogenated organic compounds (e.g., alkyl halides) Remember these are given off into air from produced water and flowback water at shale gas sites. This array of compounds encompasses a wide range of chemical properties and lifetimes; isoprene has an atmospheric lifetime of approximately an hour, whereas methane has an atmospheric lifetime of about a decade” (EPA, 2008). So the majority of ground level ozone is formed when ozone precursors NOx, CO, and VOC’s react in the atmosphere in the presence of sunlight. We have established that these VOC’s can come from volatilization of organic compounds from frac ponds-condensers and other gas processing equipment and compressor-transmission operation. Motor vehicle exhaust, emissions from coal powered electrical generation stations, industrial emissions and release of chemical solvents all put these precursor ozone producing chemicals into the air.
These precursors chemicals most often originate in urban areas, but winds can carry NOx hundreds of kilometers, causing ozone formation to occur in less populated regions as well. Methane, a VOC whose atmospheric concentration has increased tremendously during the last century, contributes to ozone formation but on a global scale rather than in local or regional photochemical smog episodes. In situations where this exclusion of methane from the VOC group of substances is not obvious, the term Non-Methane VOC (NMVOC) is often used. (EPA, 2008)
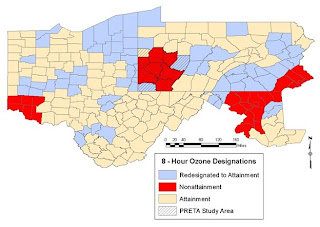
Now let’s examine the specific case of ozone and precursor chemicals for ozone as they exist over the Marcellus shale area without the addition of VOC’s from shale gas operations and the addition of diesel exhaust that also accompanies this process (from the thousands of truck trips to deliver water, chemicals, equipment, and sand and remove equipment and contaminated fluids – conservatively 1000 trips per well – thus over a year when 2000 wells are drilled there would be 2,000,000 truck trips). The maps that we are going to show were developed for the Pittsburgh Regional Environmental Threat Analysis (PRETA), in progress now (check back to fractracker.com in mid-September 2010 to visualize data on VOC’s, ozone, sulfur dioxide, nitrogen oxides, particulates [PM 10 and PM 2,5], carbon monoxide and other air contaminants across the four state region of Ohio, Pennsylvania, Maryland and West Virginia- these data and the maps presented below represent air contaminant means of the second highest 8-hour daily maximum values from 1998 -2008).
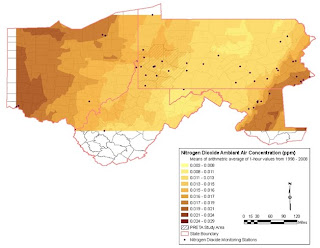
 Map 2, NO2 Levels 1998-2008 over 4 state region shows existing NO2 levels when monitoring station data are averaged and smoothed.
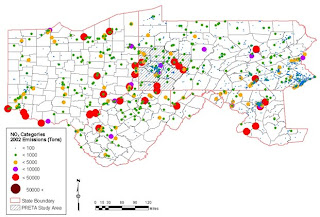
Map 3, NO2 Emissions in Tons for 2002 presents facilities releasing NO2 over the 4 state study area and an estimate of their NO2 emissions per tonnage category. Remember NO2 is a precursor gas for formation of ozone; areas downwind of these sites will thus have increased reactant for the formation of ozone. VOC’s from shale gas extraction activities may react with NO2 from these sources.

References
- Arthur JD, Bohm B, Layne M, 2008, Hydraulic Fracturing Considerations for Natural Gas Wells of the Marcellus Shale, 2008 Annual Forum, The Ground Water Protection Council, Cincinnati, Ohio.
- ASTM E1689 – 95, 2008, Standard Guide for Developing Conceptual Site Models for Contaminated Sites.
- Environmental Protection Agency, 2008, Ground Level Ozone – Health and the Environment. Accessed 8/16/10.
- Fang CS, 1990, Petroleum drilling and production operations in the Gulf of Mexico. Estuaries, Vol 13, No 1, pp. 89-97.
- MacIntosh DL, and Spengler JD, 2000, Environmental Health Criteria 214- Human Exposure Assessment, United Nations Environment Programme, International Labour Organisation, World Health Organization, International Programme on Chemical Safety, Geneva, Switzerland.
- Soeder DJ, and Kappel WM, 2009, Water Resources and Natural Gas Production from the Marcellus Shale, U.S. Department of the Interior, U.S. Geological Survey Fact Sheet 2009–3032.
- Veil JA, Puder MG, Elcock D, and Redweik RJ, 2004, A White Paper Describing Produced Water from Production of Crude Oil, Natural Gas, and Coal Bed Methane, Prepared for U.S. Department of Energy, National Energy Technology Laboratory, Under Contract W-31-109-Eng-38, Prepared by Argonne National Laboratory.