This page has been archived. It is provided for historical reference only.
Recent well site and pit north of Evans City, Butler County, PA. Click the image for a dynamic view.
[image removed]
Sometimes, you get a bit lucky. While helping a user find data about drilling operations in Butler County, I noticed that while there are relatively few Marcellus Shale gas wells in the county, activity has picked up dramatically there in 2010. Prompted by these factors, I decided to try to find visual evidence of drilling operations using our DataTool. I found this recent pair of wells and brine pit.
Closeup of wells. Both wells were issued permits on 12-16-09.
Using the information tool (the white “i” in the blue circle), we can find out some information about these wells. Their unique API numbers are 019-21657 and 019-21658, both were drilled by Rex Energy, and the permits for both were approved on December 16, 2009. Having the API number, we can look on our other datasets to find that one of them was drilled on February 8, 2010, and the other one was spudded twelve days later. Both of these wells are on the production dataset, although apparently, neither of them had produced anything as of the June 30th cutoff date for that report.
Closeup of brine pit. Note the trees for scale.
It is possible to zoom in even further. If you follow the link that says, “Click to see more details on this map”, it will take you to our DataTool. From there, you can zoom in with the zoom bar at the bottom left, and then even more with the wheel of your mouse.
https://fractracker.org/wp-content/uploads/2025/09/2025-Wordmark-Logo.png00Matt Kelso, BAhttps://fractracker.org/wp-content/uploads/2025/09/2025-Wordmark-Logo.pngMatt Kelso, BA2010-11-16 18:03:002020-07-21 10:36:02Satellite Image of Well Found with FracTracker’s DataTool
This page has been archived. It is provided for historical reference only.
Marcellus Shale Gas Production by County. Please click the map for more information and a dynamic view. [map removed]
Pennsylvania released preliminary production information for Marcellus Shale gas wells in September, but the updated data that the Department of Environmental Protection (DEP) posted earlier this month is superior in several ways. First of all, it is more complete than the preliminary list, as one quarter of the operators actually missed the reporting deadline. In addition, the columns of data are no longer jumbled together, and units of measure have been provided. With all of these improvements, it is time for another look at the numbers.
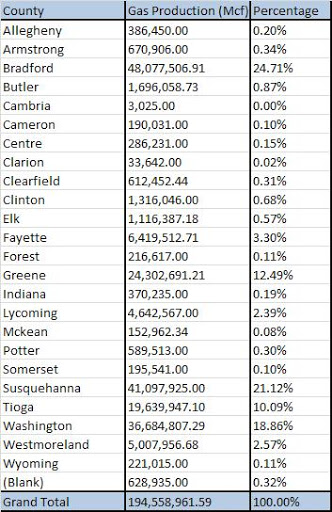
Between July 1, 2009 and June 30, 2010, Marcellus Shale wells in Pennsylvania produced almost 195 billion cubic feet (Bcf) of natural gas. That sounds like a huge number, but Pennsylvania consumed at least 756 Bcf in 2009 according to the US Energy Information Administration. That means that the Marcellus Shale gas boom in the state accounts for only about of 28% of our own usage.
Geographic Distribution
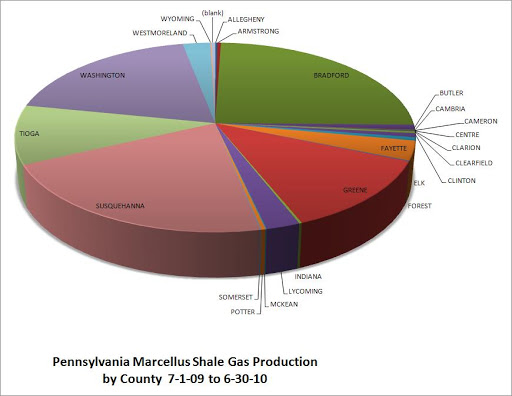
Marcellus Shale Gas Production in Pennsylvania by County, July 1, 2009 through June 30, 2010
Marcellus Shale Gas Production in Pennsylvania by County, July 1, 2009 through June 30, 2010
The two counties with the highest natural gas production levels are Bradford and Susquehanna, both in the northeastern quadrant of the state. The next highest producers are Washington and Greene Counties, located in the southwest. These four counties account for 77% of all Marcellus Shale production in the state.
Production by Drilling Operator
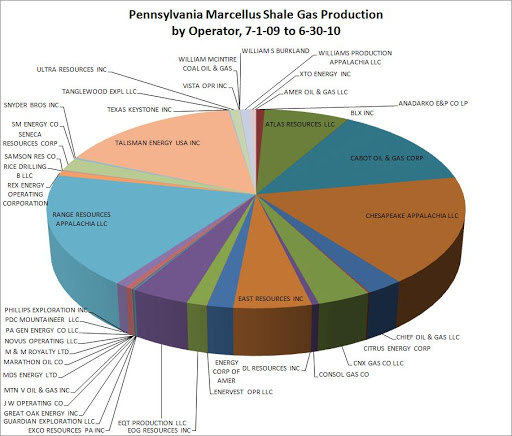
Marcellus Shale Gas Production in Pennsylvania by Drilling Operator, July 1, 2009 through June 30, 2010
Marcellus Shale Gas Production in Pennsylvania by Drilling Operator, July 1, 2009 through June 30, 2010
There are 44 drilling operators listed on the report. Four of these–Cabot,Chesapeake, Range Resources, and Talisman–account for over 65% of the production.
https://fractracker.org/wp-content/uploads/2025/09/2025-Wordmark-Logo.png00Matt Kelso, BAhttps://fractracker.org/wp-content/uploads/2025/09/2025-Wordmark-Logo.pngMatt Kelso, BA2010-11-15 13:37:002020-07-21 10:36:02Updated Pennsylvania Marcellus Shale Production Information
This page has been archived. It is provided for historical reference only.
Analysis by Offending Versus Drilled Wells
This map shows Marcellus Shale and other oil and gas violations issued between 1-1-2007 and 9-30-2010. [map removed]
In a recent post, I examined the relationship between different types of wells in Pennsylvania and the number of violations per offending well. This post expands on that theme by examining the number of violations per wells drilled, and addresses a number of complications that are associated with that analysis.
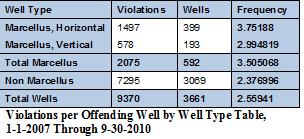
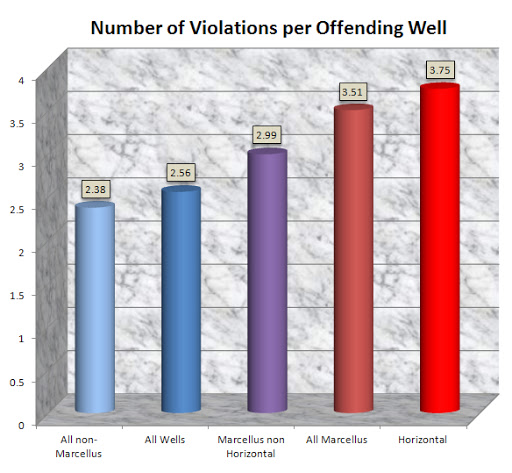
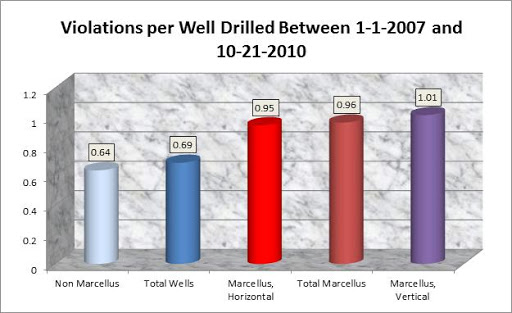
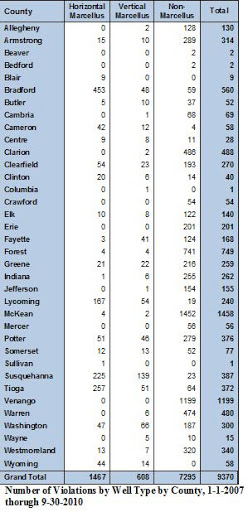
This graph shows the mean number of violations per well type in Pennsylvania. This is based on a list of 9,370 violations provided by the PA DEP from 1-1-2007 through 9-30-2010. Please note that this reflects only wells where violations occurred, not every well of this type within Pennsylvania.
This chart shows that of all the offending wells, Marcellus Shale wells clearly have more violations per well than their conventional counterparts, and that among the Marcellus wells, those that were drilled horizontally have more violations associated with them than vertical wells do.
I focused on offending wells rather than total wells for two reasons. First, all of the data that I needed to do this analysis was complete from one source except for which wells were flagged as horizontal, which I obtained from permit information on the Department of Environmental Protection (DEP) website. On the other hand, I do not have any sort of estimate for the total number of wells drilled in the state. PASDA maintains a list of DEP data which contains at least 123,000 oil and gas locations, but there is no indication which of these have been drilled. The DEP maintains a list of drilled wells since 1998 on their website, but that omits well over a century of hydrocarbon production.
My second reason for focusing on offending wells was that I thought the values for the “All non-Marcellus” and “All Wells” categories would be bloated by their antiquity. After all, commercial oil wells have been in the state since 1859, while DEP data shows that the earliest Marcellus Shale well was spudded on March 6, 2006, and drilling began on the earliest horizontal well on February 12, 2008.
Even though the violations that I was considering were all issued after January 1, 2007, I had some reason to suspect a data skew of this sort: abandoned wells. The DEP violation list indicated 1,111 violations where the drilling operator failed to plug a well, all but five of which were not Marcellus Shale wells. This category alone accounts for nearly 12% of the total violations, and is almost certainly dominated by wells that were drilled long before the start date of the violation dataset.
Drilled Well Analysis
Keeping these factors in mind, I still wanted to take a look at how many violations per drilled well there were in the various categories, so I compared the violations data to the list of wells since 1998 mentioned above.
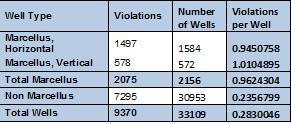
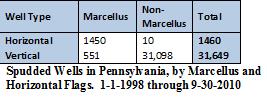
Number of Violations by Well Type for wells drilled between 1-1-1998 and 10-21-2010. All violations are from 1-1-2007 through 9-30-2010.
Number of Violations by Well Type for wells drilled between 1-1-1998 and 10-21-2010. All violations are from 1-1-2007 through 9-30-2010.
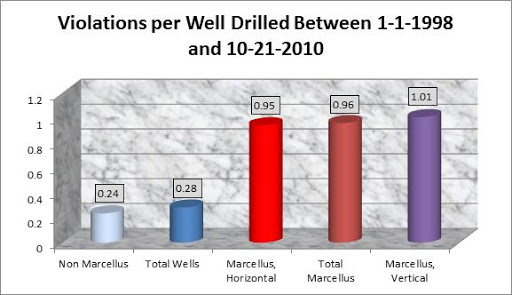
Obviously, my prediction of bloated values for non-Marcellus Shale wells is not supported by these numbers, with more than four times as many violations per drilled Marcellus Shale well than its conventional counterpart. Still, I am uncomfortable with this presentation of the data, due to the fact that it includes eight more years of traditional wells than Marcellus Shale wells. It does allow for the likelihood that older wells were included in the violation list, but perhaps overly so.
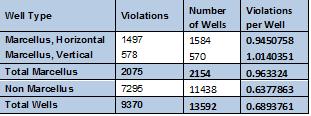
Number of Violations by Well Type for wells drilled between 1-1-2007 and 10-21-2010. All violations are from 1-1-2007 through 9-30-2010.
Number of Violations by Well Type for wells drilled between 1-1-2007 and 10-21-2010. All violations are from 1-1-2007 through 9-30-2010.
These are the numbers that are most affected by the large abandoned well data skew, and still Marcellus Shale wells are 1.5 times more likely to have a violation than their more conventional counterparts. All of the values for Marcellus Shale wells are nearly identical to the set from 1998 onward, because all but two of those wells are in both datasets. I consider the two datasets to be bookends for non-Marcellus Shale wells and total wells, since the data is skewed by time in different ways. Marcellus Shale wells are therefore somewhere between 1.5 and 4 times more likely to have violations than all other wells in the Commonwealth.
Horizontal Wells
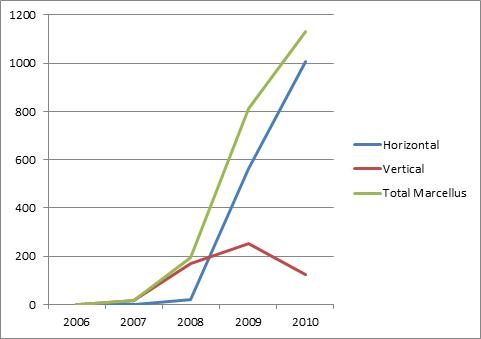
Marcellus Shale Wells by Type and Year, 2006 through 2010
But what about horizontal wells? When we considered violations per offending well, they had 0.76 more violations per well than vertical Marcellus Shale wells, but when compared to the total number of wells of those types, vertical wells actually had slightly more violations than horizontal wells. Why is this?
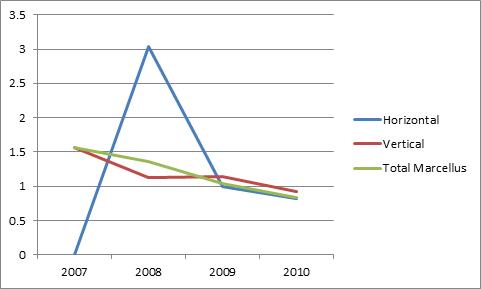
Marcellus Shale Violations per Drilled Well, 2007 through 2010
The 2008 spike in horizontal violations per drilled well is based on a very small sample size, and does not account for the difference that we are looking for. The opposing trends of the rapid expansion of horizontal wells and the steady erosion of the number of violations per well drilled certainly does, however. Most of the vertical wells were drilled when there were more violations per well, and most of the horizontal wells were drilled when there were fewer.
All of this begs the question: Why are there so many fewer violations per well than there were three years ago? Is it because the industry is more in compliance with the regulations, or that the DEP is not equipped to monitor the rapidly expanding industry? Are we getting the same level of environmental protection from the Commonwealth as we did in 2007? These questions should be a part of the policy discussion as Pennsylvania continues to understand the effects of Marcellus Shale drilling operations.
https://fractracker.org/wp-content/uploads/2025/09/2025-Wordmark-Logo.png00Matt Kelso, BAhttps://fractracker.org/wp-content/uploads/2025/09/2025-Wordmark-Logo.pngMatt Kelso, BA2010-11-10 17:46:002020-07-21 10:36:01PA Data Shows Marcellus Wells 1.5 to 4 Times More Likely to Have Violations
This page has been archived. It is provided for historical reference only.
Click on the map for a dynamic view and for more information.
[map removed]
I have posted updates of West Virginia’s Marcellus Shale permit and well data onto our FracTracker DataTool. The information was downloaded from the West Virginia Department of Environmental Protection (DEP) Office of Oil and Gas website.
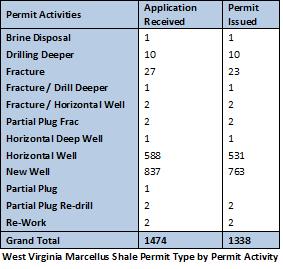
I searched the DEP website for Marcellus Shale wells and found 1,463 different locations. When I looked at the at permit data, I got almost 12,000 records for 1,464 Marcellus Shale distinct wells. It seems difficult to believe that all but one permitted well has already been drilled, and a closer look at the data shows that really can’t be the case.
[image removed] In this dataset, there are 1,338 Marcellus Shale permits issued (green), 21 permits canceled (red), and 39 permit applications returned (yellow).
Of those permit records, only 1,338 are listed as having the permit issued. Unlike the Pennsylvania well list which includes only spuded wells, it seems that the West Virginia DEP thinks of the well list as a summary of the permit list, rather than a list of sites that have actually been drilled. In addition, West Virginia does not include the spud date on their oil and gas well data. Instead, they use the date for the last permit that was received for the well, which in no way indicates whether drilling activity has commenced.
I have contacted the West Virginia DEP for clarification on this point, and will share their response as a comment on this space.
https://fractracker.org/wp-content/uploads/2025/09/2025-Wordmark-Logo.png00Matt Kelso, BAhttps://fractracker.org/wp-content/uploads/2025/09/2025-Wordmark-Logo.pngMatt Kelso, BA2010-11-09 11:11:002020-07-21 10:36:01Updated West Virginia Marcellus Shale datasets on our DataTool
This page has been archived. It is provided for historical reference only.
[image removed]
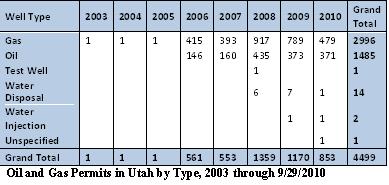
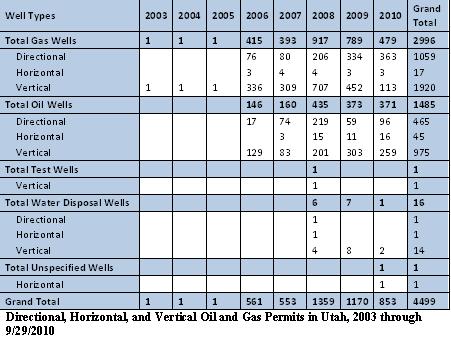
Utah Oil and Gas Wells.
Click on the map for more information.
I pursued oil and gas data from Utah due to the accessibility of the relevant information, and because a map of major shale gas plays indicate several formations of interest in the state, notably the Hermosa and Mancos Formations. However, I learned from Utah’sOil and Gas Permitting Manager and Petroleum Geologist Brad Hill that while there has been discussion of extracting gas from shale formations, currently none of the wells in the state are producing shale gas. On the other hand, he did indicate that most of the wells in the state had been stimulated to some degree with hydraulic fracturing.
The state is relatively new to the oil and gas industry. Although only one well from 2008 is listed as a test well, it seems fair to conclude that at the very least, the three total wells from 2003 through 2005 should fall in that category as well, even if they are classified as gas wells.
Horizontal Wells
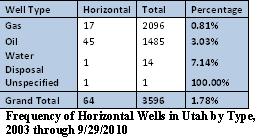
For a state where most of the wells are hydraulically fractured, there are very few horizontal wells. It is also noteworthy that most of the wells that are drilled horizontally are oil wells, not gas. While 3% of oil wells are permitted to drill horizontally, the same is true for only 0.8% of gas wells. The reason for this is not clear at this time.
Geographic Information
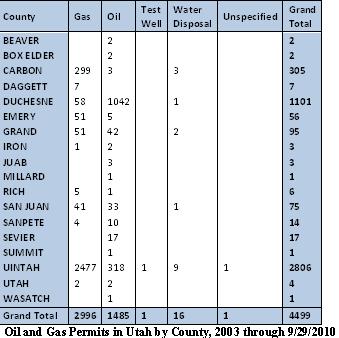
Geographically, Uintah County is by far the most active portion of the state for natural gas permits, while Duchesne County is similarly dominant for oil drilling activity. Together, Carbon County and Uintah County account for about 93% of the gas permits, while Duchesne County and Uintah County combine for 92% of the oil wells.
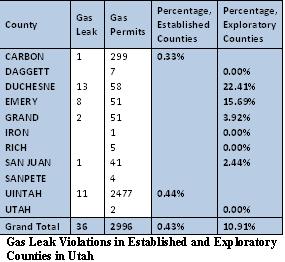
Violation Information
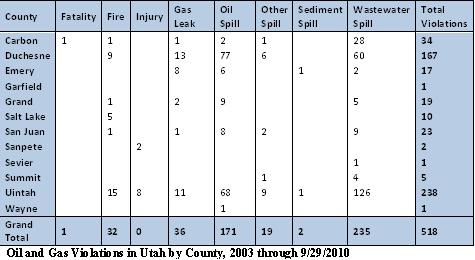
Violation data from the Utah Division of Oil, Gas, and Mining is not posted online, so I submitted a request, and received the data promptly. That dataset includes comments as to what happened to cause the violation, as well as mitigation efforts to date. For the moment, however, we are most interested in an overview of the data. I have therefore condensed the violations into eight categories for ease of use.
Statewide, there is a gas leak for just over 1% of the permits issued, and for Uintah County, where the vast majority of the gas operations are, that figure is just 0.4%. But in Emery County, there is a gas leak violation for 16% of the permits issued, and Duchesne County that figure is 22%.
The reason for this disparity is not provided, however the numbers do seem to suggest that violations of this type are more frequent where the gas drilling operations are relatively sparse. I mentioned that Carbon and Uintah Counties together account for 93% of the gas operations in Utah. If we consider those two counties to have an established gas industry with the rest of the state being exploratory in nature, we see a dramatic difference in the frequency of gas leak incidents.
This page has been archived. It is provided for historical reference only.
Oil and Gas Wells in Pennsylvania since 1998. Click on the image for more details. [image removed]
The extraction of oil in Pennsylvania has been ongoing since before the Civil War, and the natural gas industry is also well established. The boom in production due to the hydraulic fracturing of gas from the Marcellus Shale formation is, however, quite recent.
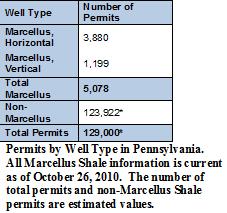
A proper analysis of the oil and gas industry starts with the question, “How many wells of each type are there?” Unfortunately, the figures for non-Marcellus Shale and total wells are approximate. On their website, the Pennsylvania Spatial Data Access (PASDA) maintains a list of over 123,000 oil and gas locations in the state, based on Department of Environmental Protection (DEP) data. Through our efforts, CHEC has found over 6,000 more locations from permit information available on the DEP website, bringing the total of oil and gas locations to over 129,000.
Some of these 129,000 locations were undoubtedly never spudded, but that level of information is not available at this time. There is data as to which Marcellus Shale wells have been spudded, as all of the Marcellus Shale wells are recent enough to have digital information about them on the DEP website.
I compiled this information about drilled wells from information that is on the DEP website, and it indicates that there are only ten wells that were drilled horizontally that were not extracting from the Marcellus Shale formation. I have seen comments in violation data indicating that wells not flagged as Marcellus had become Marcellus wells by drilling deeper. I do not have data to suggest that this situation accounts for all ten horizontal wells that are not flagged as Marcellus Shale, but I would not find that surprising.
Violation Information
[image removed]
Fire in Hopewell Township PA – Atlas Energy drilling site 3-31-10
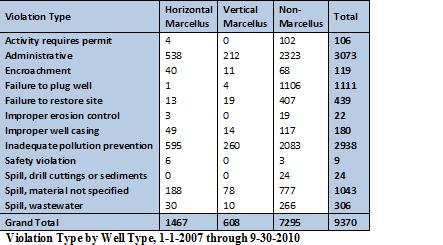
In the past few days, the DEP has posted oil and gas violation data on their website. Several weeks ago, the DEP provided CHEC with a comprehensive list of 9,370 violations in the period between January 1, 2007 and September 30, 2010. This is more than ten times the number of violations that has been obtained from both Utah and West Virginia, although the nature of this list is also far more complete than that of the other two states. Additionally, Pennsylvania has a more extensive oil and gas industry than either of the other two states.
For example, the table above shows over three thousand administrative violations, one thousand instances of failing to plug a well, and four hundred cases where the well operator failed to restore a site after the conclusion of drilling operations. The nature of the violation information from the other two states leads me to suspect that their violation lists were simply compiled differently, and that these problems that the Pennsylvania DEP regulators have seen so much of are not absent in the other states.
I have condensed the original list of 109 violations categories into 12 in order to facilitate analysis. Some of these distinctions were relatively simple to collapse. For example, wastewater spills and brine spills clearly belong together. Other examples were less clear. One of the original categories was “Improper storage of residual waste”, which does not explain whether or not a spill had occurred. For that reason, it was included with, “Inadequate pollution prevention”, although the violation might well have been issued after an impoundment overflow.
Where are the Violations?
In terms of geographical distribution, we see that three contiguous counties in the northeast quadrant of the Commonwealth—Bradford, Susquehanna, and Tioga—account for a majority of the Marcellus Shale violations, Two northwestern counties—McKean and Venango—have noticeably more violations than the rest of the counties in terms of oil and gas operations that are drilled into other formations.
Violation Analysis
For states where the oil and gas industry is relatively recent, it is straightforward task to compare violations to the number of permits or spudded wells. With the long history of mineral extraction in Pennsylvania, the results of that comparison here is somewhat problematic. For example, while the 1,111 instances of failing to plug a well issued during this 45 month timeframe is a frankly staggering total, only five of those were for Marcellus Shale wells. This makes sense, as the more recent Marcellus wells are more likely to still be productive, while a violation for an uncapped well could potentially be issued for a long abandoned well that was recently discovered.
The point of bringing up this example is to suggest that due to the long timeframe of oil and gas operations in Pennsylvania, a straightforward comparison of Marcellus Shale to non-Marcellus Shale violations by the number of wells of each type is probably misleading. And, as mentioned above, we are not altogether clear on how many conventional wells that there are in the state in the first place.
However, if we look at the number of violations per well against the more limited scope of wells which are in violation, some interesting trends come to light, and the issue of severely skewed results due to the antiquity of the conventional oil and gas industry in the state seems effectively mitigated in this analysis as well.
To be clear, this does not suggest that there are an average of 2.56 violations per well in Pennsylvania. It does indicate that when the DEP sees a situation in which violations must be filed, there are typically more than one problem at a time. As the data above shows, wells drilled into the Marcellus Shale have a higher number of violations per offending well than do those in other formations, and the horizontally drilled Marcellus wells have more still.
This page has been archived. It is provided for historical reference only.
According to their website, the West Virginia Department of Environmental Protection Office of Oil and Gas is responsible for over 55,000 active and 12,000 inactive oil and gas wells in the state. To obtain a scope of the Marcellus Shale activity, I queried that state’s online permit and well databases on November 1, 2010.
The search of permitting data yielded 11,836 records, however a closer look at the data shows that there have been only 1,474 permit applications received from 1,464 wells, with the rest of the dataset providing detailed information about the same locations. Of the total number of applications, a total of 590 are horizontal. There are a total of 1,338 permits that have been issued, of which 533 are horizontal.
From the well database, there are 1,463 Marcellus Shale wells, 1,334 of which are gas wells, one is a commercial brine disposal well, and the remaining 128 wells of an unspecified type. Since as of November 1, 2010 there are only 1,338 permits issued for the Marcellus Shale, those unspecified wells are a curious presence. Results of Permit Applications. Green dots are approved permits, yellow dots are permits that have been returned, and red dots are rejected permits. Click the map for more information.
Violation Data
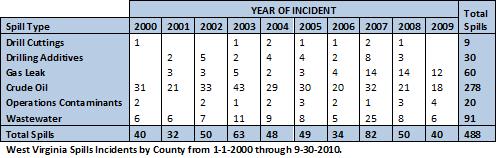
Unlike other states in which violation data has had to be requested, the West Virginia DEP has separate spills and violation databases available on their website. The spills database includes 463 records between the dates of January 1, 2000 and September 30, 2010, while the violation data includes an additional 245 records from the same time frame.
Even together, these totals are less than one tenth of the number of violations that have occurred in Pennsylvania since 2007, although these lists do no not seem to include much of the administrative and abandoned well violations that are so prominent in the Pennsylvania data. I should also note that the 67,000 current and abandoned wells that West Virginia oversees is roughly half of Pennsylvania’s 129,000 known oil and gas locations.
I condensed the original list of 134 different spill types into six categories to facilitate analysis. Most of the instances of merging categories were straightforward. For example, brine spills and wastewater spills clearly belong together. A few, such as “Substance from gas well” required some degree of guesswork.
The other violation database includes the relevant West Virginia legal code. Most of the categories seem logical, however a few, such as “Libraries” and “Religious, Educational, and Nonprofit” seem to be illogical oil and gas violation categories. Libraries may well be a mistake, having come up only once, but with 41 instances, it seems likely that the latter legal chapter has some relevant code for the oil and gas industry.
As with the spills data, this dataset includes numerous entries with multiple violations, resulting in a total number of violations that is higher than the number of records in the online database.
https://fractracker.org/wp-content/uploads/2025/09/2025-Wordmark-Logo.png00Matt Kelso, BAhttps://fractracker.org/wp-content/uploads/2025/09/2025-Wordmark-Logo.pngMatt Kelso, BA2010-11-03 14:05:002020-07-21 10:36:00West Virginia Wells and Violations Discussion
This page has been archived. It is provided for historical reference only.
Three new datasets have been added to our DataTool: Utah Oil and Gas Violations, West Virgina Spills, County by Year, and West Virginia Spills Data.
The Utah dataset contains information including violation type, and oil and gas related injury and fatality records. The West Virgina Spills, County by Year dataset is a set up to be easy to visualize, however, those interested in analyzing the West Virginia data itself will want to look at the West Virginia Spills Data dataset.
Earlier, we posted a separate WV Marcellus and O&G Violation by County dataset. I suspect that the West Virginia data is incomplete, due to the relatively small number of records. There are 463 records of spills and 259 other violations since January 1, 2000, for a total of 722 offenses. Compare that to the dataset from Pennsylvania, where there are over 9,300 violations recorded, and those are all since January 1, 2007.
This page has been archived. It is provided for historical reference only.
The Pennsylvania Department of Environmental Protection (DEP) responded to our request for oil and gas violation information with a list of 9,370 violations from January 1, 2007 through September 30, 2010. That works out to almost seven oil and gas violations statewide per day. Certainly, the DEP has been taking its job very seriously in trying to regulate the oil and gas industry within the Commonwealth.
At the same time, it makes one wonder what violations occur that the DEP is not aware of.
A Closer Look at the Numbers
The 9,370 violations came from a total of 3,661 wells. Of that total, 2,075 violations are flagged as Marcellus Shale, from 592 distinct wells. And of the Marcellus wells total, there were 1,497 violations from 399 wells that were flagged as horizontal wells. All horizontal wells in this dataset are also Marcellus Shale wells.
That means that for non-Marcellus Shale wells, there were 7,295 violations from 3,069 wells, for a frequency of just 2.38 violations per well. The highest frequency of violations per well was 37, for API# 131-20020, a horizontally drilled Marcellus Shale well in the town of Washington in Wyoming County, PA.
In terms of average violations per well, the reported data indicates 2.38 violations per non-Marcellus well, and 3.51 violations per Marcellus well, for an overall average of 2.56 violations per well.
This graph shows the mean number of violations per well type in
Pennsylvania. This is based on a list of 9,370 violations provided by the PA
DEP from 1-1-2007 through 9-30-2010. Please note that this reflects only wells
where violations occurred,not every well of this type within Pennsylvania.
Please keep in mind that all of these values only represent wells that have violations, and therefore it should not be construed that the average Marcellus well will have three and a half DEP violations. This certainly does, however, raise the question of why an offending horizontal Marcellus Shale well would have an average of 1.37 more violations per well than its non-Marcellus counterpart, but it does not provide the answer. Perhaps it reflects that more can go wrong on horizontal Marcellus Shale wells, or that they are more tightly regulated. Perhaps a handful of individual sites like the one in Washington have so many violations that they skew the data in some way. There could be numerous scenarios to explain the discrepancy.
Obtaining Geographic Location Information
To date, the primary means of linking oil and gas data to a geographic location has been using the dataset compiled by PASDA, which includes the information of over 123,000 oil and gas locations within the state. Unfortunately, the PASDA data was insufficient for the violation data, as there were thousands of records that did not match. I have reduced that number significantly to by adding the list of known permits since 2007 (which also includes geographic information) to the PASDA list. This process created duplicate entries, which was worked around by obtaining the average longitude and average latitude of each API number.
This process does not eliminate any errors inherent in the data. In one example that I looked at, there were three listings for one unique well number, one of which was off by 0.3 degrees of latitude, or about 20 miles. In this scenario, it would be tempting to correct the one to conform to the other two, but in reality, it isn’t clear which one is correct. And for that reason, auditing the dataset—which is now over 128,000—for errors is not especially productive. For the moment, it is sufficient to say that there are some errors present in the location data, which are hopefully minimal in scope.
https://fractracker.org/wp-content/uploads/2025/09/2025-Wordmark-Logo.png00Matt Kelso, BAhttps://fractracker.org/wp-content/uploads/2025/09/2025-Wordmark-Logo.pngMatt Kelso, BA2010-10-12 15:03:002020-07-21 10:35:42Pennsylvania Violation Data
By Matt Kelso – Data Manager, Center for Healthy Environments & Communities (CHEC), University of Pittsburgh Graduate School of Public Health
Archived
This page has been archived. It is provided for historical reference only.
A new dataset of drilled oil and gas locations in Utah has been added to FracTracker’s DataTool (click on the snapshot of that dataset to the left to see more detail). This dataset was pursued in order to obtain more data from other shale gas fields throughout the United States. However, despite the fact that there are shale gas fields in the state, a correspondence with Utah’s Oil and Gas Permitting Manager/Petroleum Geologist Brad Hill has led to the revelation that there are currently no shale gas wells in the state. On the other hand, he indicated that most vertical and horizontal wells in Utah undergo some amount of hydrofracturing process, making the data relevant to our pursuits here at FracTracker.
Dissemination of Information
From the perspective of trying to obtain meaningful data about oil and gas operations, the Utah Division of Oil, Gas and Mining is wonderful resource. Just to give an indication of the breadth of the scope of what they have to offer, go to the Oil and Gas Well Log Search, set the three boxes to “API Well Number”, “LIKE”, and “43” (which is Utah’s state code), and you get a list of wells in the state, complete with associated well logs that can be viewed and downloaded. In Pennsylvania, you would have to file a Right to Know claim to get access to some of these documents. The small sample of scanned source documents that I have looked at in Utah has included typewritten notices from the 1960’s. One of the files had over 30 pages of documents.
In addition to having an abundance of information on their site, the workers that I have dealt with at the Division of Oil, Mining, and Gas have been extremely useful in obtaining additional information. My initial query to Don Staley of that department was replied to within 20 minutes, and he contacted the Petroleum Geologist of his own volition to make sure that the information that was given to me was clear. They have set the standard for public service by a governmental regulatory agency, as far as I am concerned. Texas was also helpful, but only some of their information is available free of charge.
Geocoding Issues
Most people are familiar to some extent with the basic longitude and latitude system. The grid that the two values combine to make, known as a graticule, allows for the identification of unique locations on the planet. It is not, however, the only means of identifying unique locations.
A system used by Utah and by many of the other western states is known as the Public Land Survey System, or PLSS. This system was conceptualized by Thomas Jefferson and dates to the Land Ordinace Act of 1785. In essence, it creates a series of six-mile wide horizontal bands known as Townships, and six-mile vertical bands called Ranges. These intersect to create a six-by-six mile box (see image right), with a name of something like “Township 5 North”, “Range 8 West.” This is further divided into 36 sections, each one-mile square. This can be further subdivided into quarters, and then quarters of that, so that a location could be recorded as the northeast quarter of the southeast quarter of Township 5 North, Range 8 West, Section 5 (or NE1/4 of SE1/4 of T5N, R8W, Sec. 5 for short).
This discussion is relevant here because in parts of the Utah Oil and Gas website, location information comes up in this format. To obtain the locations for the drilled wells in the state, it required a convoluted process of finding a map of the 1-by-1 mile section boxes, then finding the midpoint of those boxes with GIS tools, and finally correlating those points to the original dataset. Since the midpoint of a 1-by-1 mile box is about 0.70 miles to each corner, that is the margin of error for the location of these datapoints. For most uses, that shouldn’t matter.
After completing these conversions, I have found elsewhere on the site latitude and longitude data, as well as Universal Transverse Mercator (UTM) values, which is yet another means of finding unique places on Earth. I have not yet determined whether that has all of the information from the dataset that has been posted, but if so, then more accurate location information will follow shortly.
https://fractracker.org/wp-content/uploads/2025/09/2025-Wordmark-Logo.png00Matt Kelso, BAhttps://fractracker.org/wp-content/uploads/2025/09/2025-Wordmark-Logo.pngMatt Kelso, BA2010-10-11 09:39:002020-07-21 10:35:42Drilled Oil and Gas Locations in Utah