Literally Millions of Failing, Abandoned Wells
By Kyle Ferrar, Western Program Coordinator, FracTracker Alliance
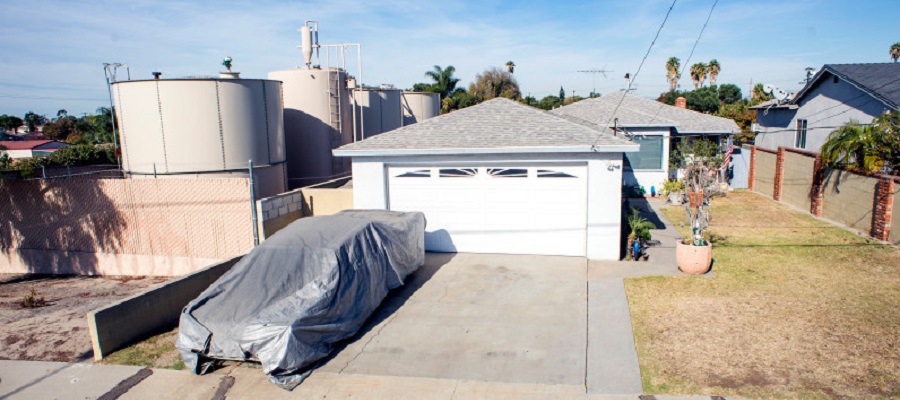
In California’s Central Valley and along the South Coast, there are many communities littered with abandoned oil and gas wells, buried underground.
Many have had homes, buildings, or public parks built over top of them. Some of them were never plugged, and many of those that were plugged have since failed and are leaking oil, natural gas, and toxic formation waters (water from the geologic layer being tapped for oil and gas). Yet this issue has been largely ignored. Oil and gas wells continue to be permitted without consideration for failing and failed plugged wells. When leaking wells are found, often nothing is done to fix the issue.
As a result, greenhouse gases escape into the atmosphere and present an explosion risk for homes built over top of them. Groundwater, including sources of drinking water, is known to be impacted by abandoned wells in California, yet resources are not being used to track groundwater contamination.
Abandoned wells: plugged and orphaned
The term “abandoned” typically refers to wells that have been taken out of production. At the end of their lifetime, wells may be properly abandoned by operators such as Chevron and Shell or they may be orphaned.
When operators properly abandon wells, they plug them with cement to prevent oil, natural gas, and salty, toxic formation brine from escaping the geological formation that was tapped for production. Properly plugging a well helps prevent groundwater contamination and further air quality degradation from the well. The well-site at the surface may also be regraded to an ecological environment similar to its original state.
Wells that are improperly abandoned are either plugged incorrectly or are “orphaned” by their operators. When wells are orphaned, the financial liability for plugging the well and the environmental cleanup falls on the state, and therefore, the taxpayers.
You don’t see them?
In California’s Central Valley and South Coast abandoned wells are everywhere. Below churches, schools, homes, they even under the sidewalks in downtown Los Angeles!
FracTracker Alliance and Earthworks recently spent time in Los Angeles with an infrared camera that shows methane and volatile organic compound (VOC) emissions. We visited several active neighborhood drilling sites and filmed plumes of toxic and carcinogenic VOCs floating over the walls of well-pads and into the surrounding neighborhoods. We also visited sites where abandoned, plugged wells had failed.
In the video below, we are standing on Wilshire Blvd in LA’s Miracle Mile District. An undocumented abandoned well under the sidewalk leaks toxic and carcinogenic VOCs through the cracks in the pavement as mothers push their children in walkers through the plume. This is just one case of many that the state is not able to address.
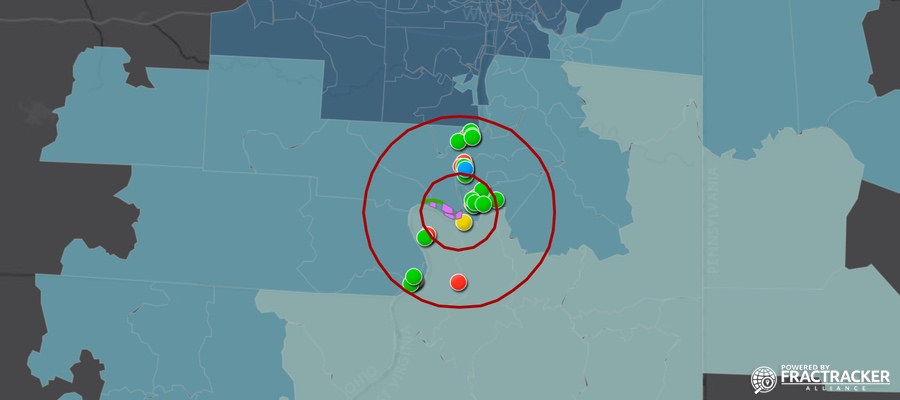
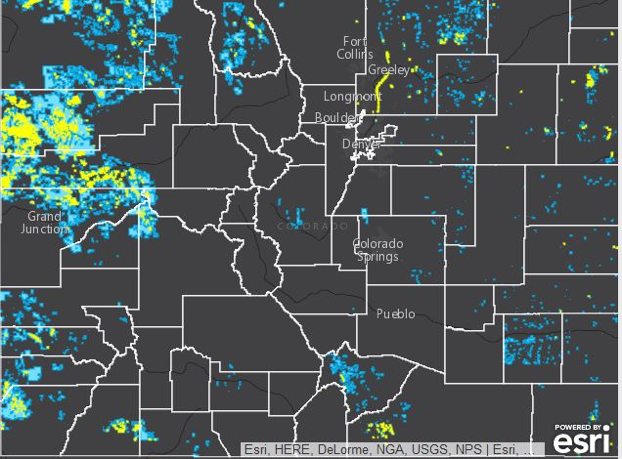
California regulatory data shows that there are 122,466 plugged wells in the state, as shown below in the map below. Determining how many of them are orphaned or improperly plugged is difficult, but we can come up with an estimate based on the wells’ ages.
While there are no available data on the dates that wells were plugged, there are data on “spud dates,” the date when operators begin drilling into the ground. Of the 18,000 wells listing spud dates, about 70% were drilled prior to 1980. Wells drilled before 1980 have a higher risk of well casing failures and are more likely to be sources of groundwater contamination.
Additionally, wells plugged prior to 1953 are not considered effective, even by industry standards. Prior to 1950, wells either were orphaned or plugged and abandoned with very little cement. Plugging was focused on protecting the oil reservoirs from rain infiltration rather than to “confine oil, gas and water in the strata in which they are found and prevent them from escaping into other strata.” Of the wells with drilling dates in the regulatory data, 30% are listed as having been drilled prior to the use of cement in well plugging.
With a total of over 245,000 wells in the state database, and considering the lack of monitoring prior to 1950, it’s reasonable to assume there are over 80,000 improperly plugged and unplugged wells in California.
Map of California’s Plugged Wells
View map fullscreen | How FracTracker maps work
The regions with the highest counts of plugged wells are the Central Valley and the South Coast. The top 10 county ranks are listed below in Table 1. Kern County has more than half of the total plugged wells in the entire state.
Table 1. Ranks of Counties by Plugged Well Counts
- Rank
- 1
- 2
- 3
- 4
- 5
- 6
- 7
- 8
- 9
- 10
- County
- Kern
- Los Angeles
- Orange
- Fresno
- Ventura
- Santa Barbara
- Monterey
- San Luis Obispo
- Solano
- Yolo
- Plugged Well Count
- 65,733
- 17,139
- 7,259
- 6,970
- 4,302
- 4,192
- 2,266
- 1,463
- 1,456
- 1,383
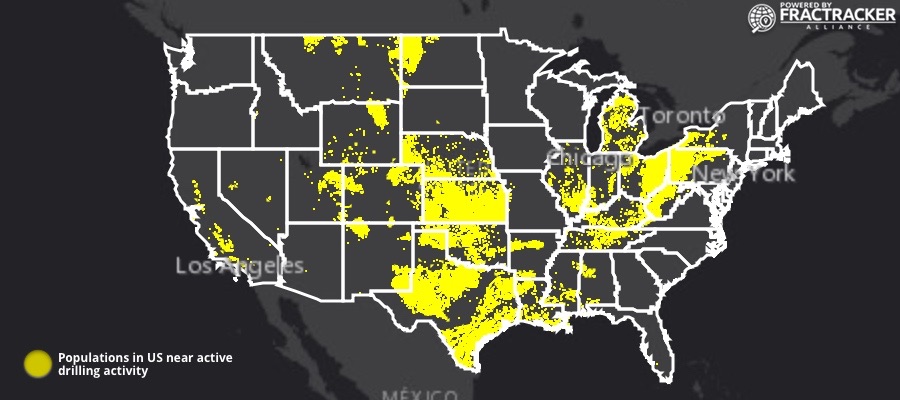
The issue is not unique to California. Nationally, an estimated 2.56 million oil and gas wells have been drilled and 1.93 million wells had been abandoned by 1975. Using interpolated data, the EPA estimates that as of 2016 there were 3.12 million abandoned wells in the U.S. and 69% of them were left unplugged.
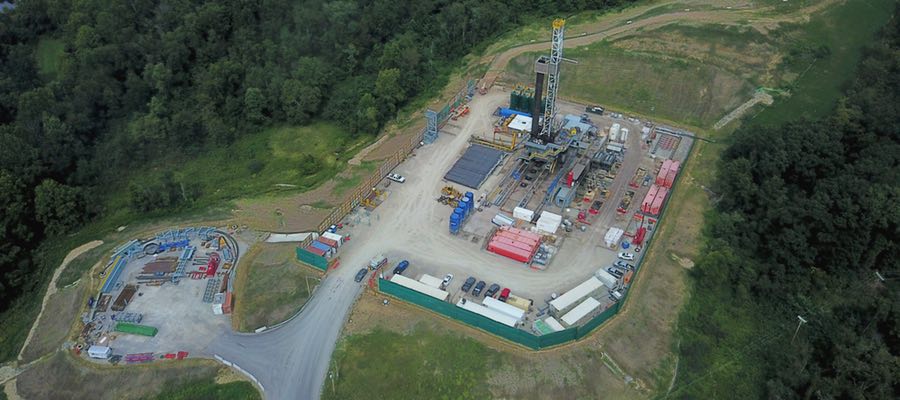
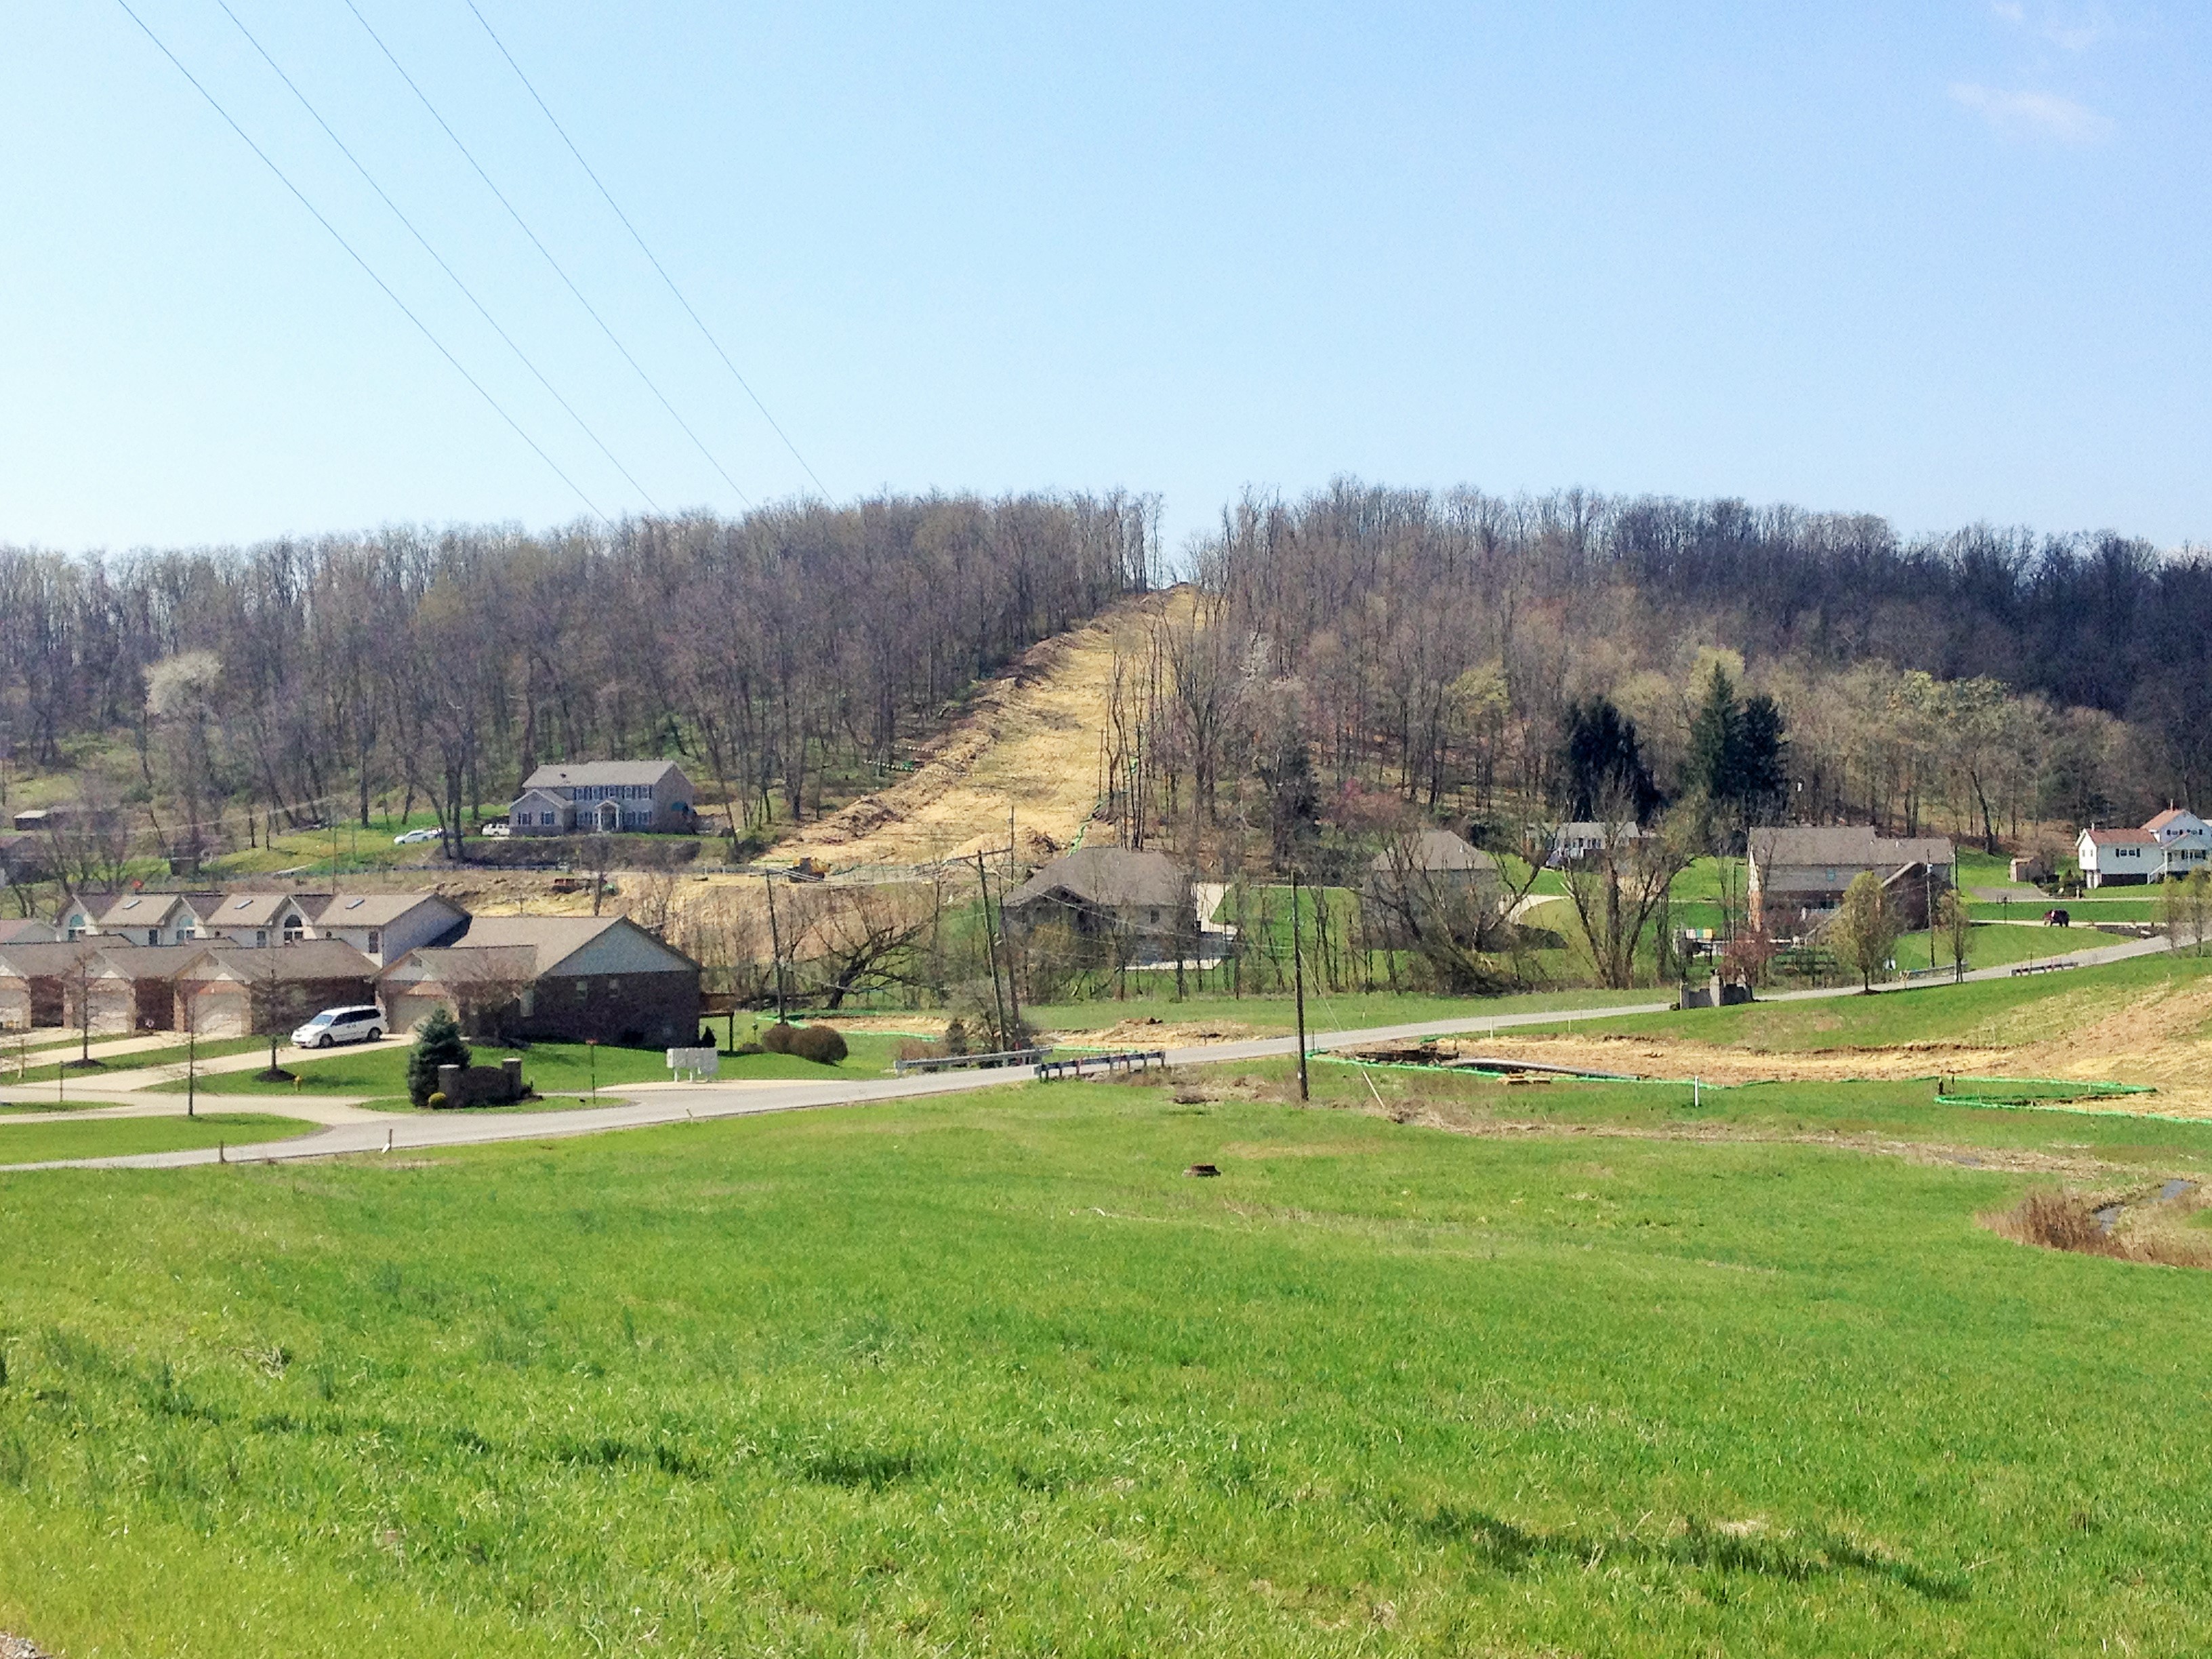
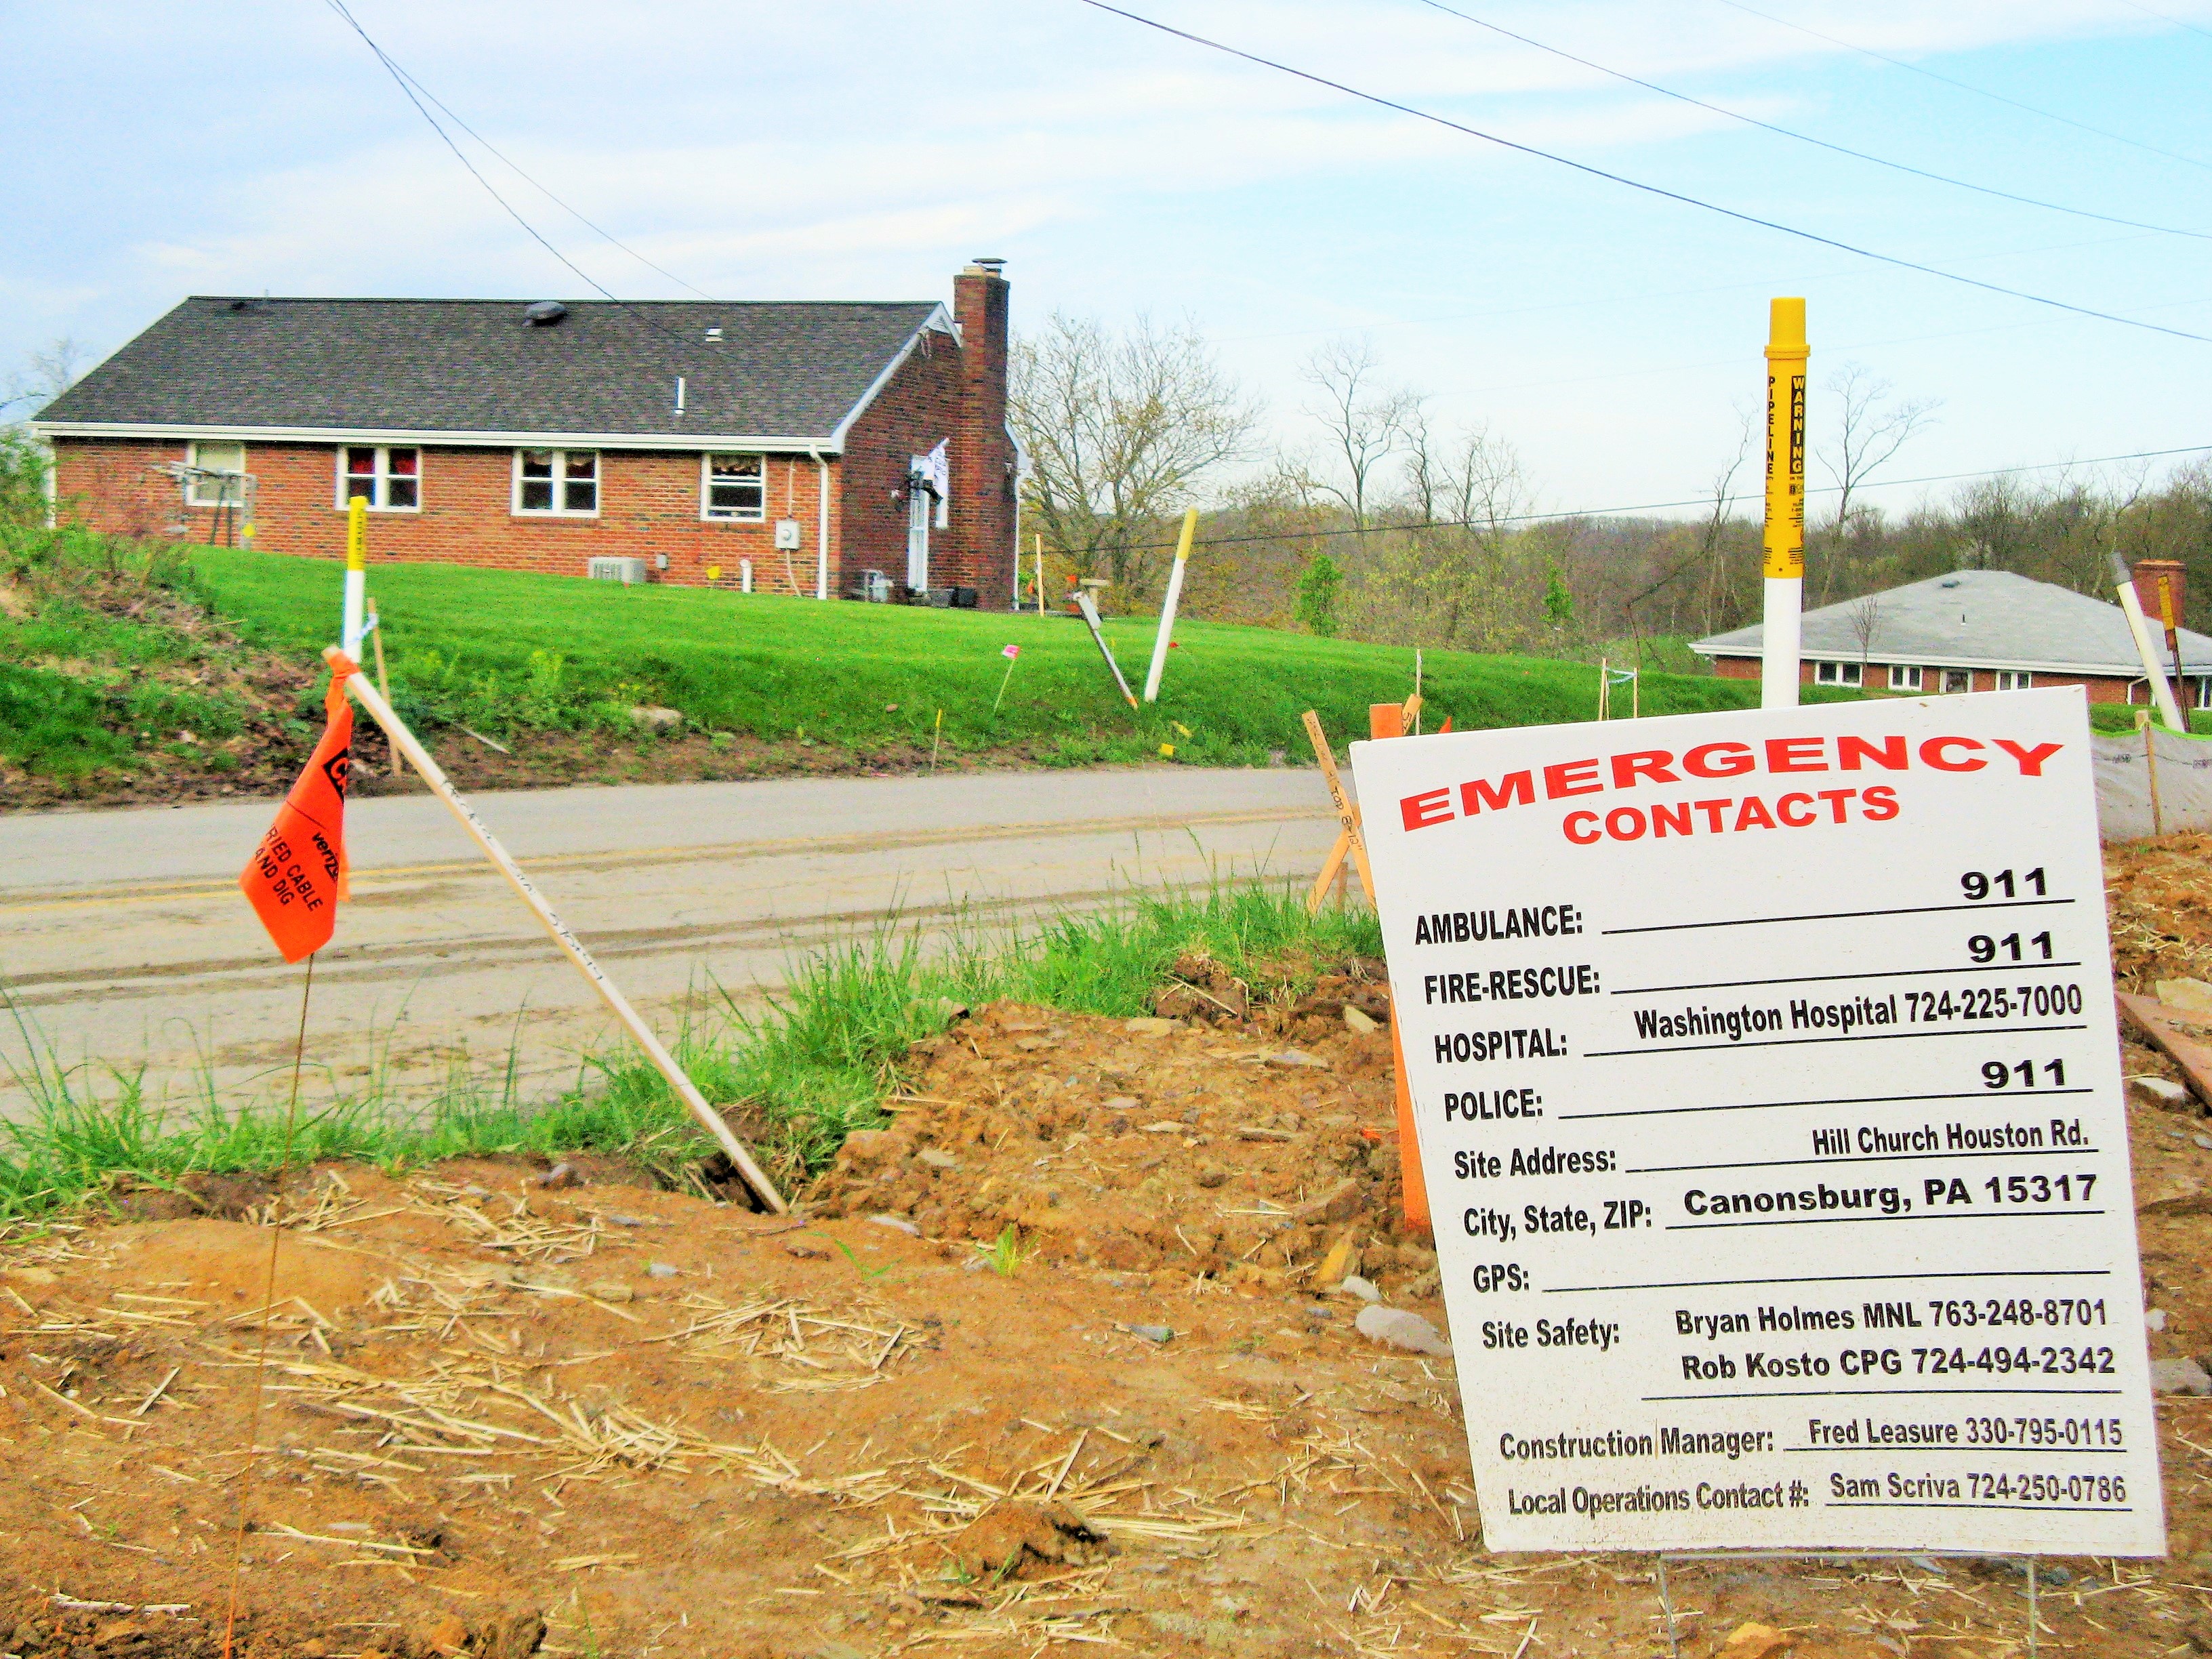
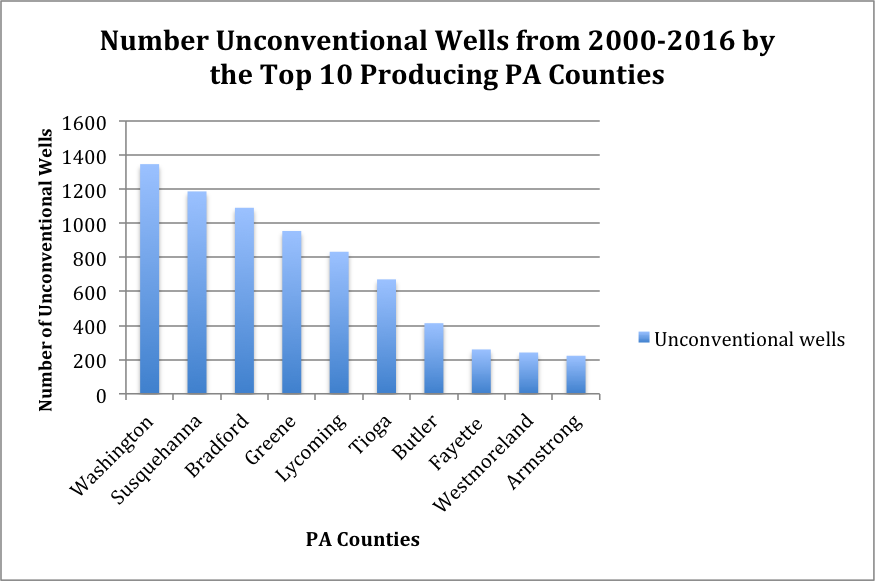
In 2017, FracTracker Alliance organized an exercise to track down the locations of Pennsylvania’s abandoned wells that are not included in the PA Department of Environmental Protection’s digital records. Using paper maps and the FracTracker Mobile App, volunteers explored Pennsylvania woodlands in search of these hidden greenhouse gas emitters.
What are the risks?
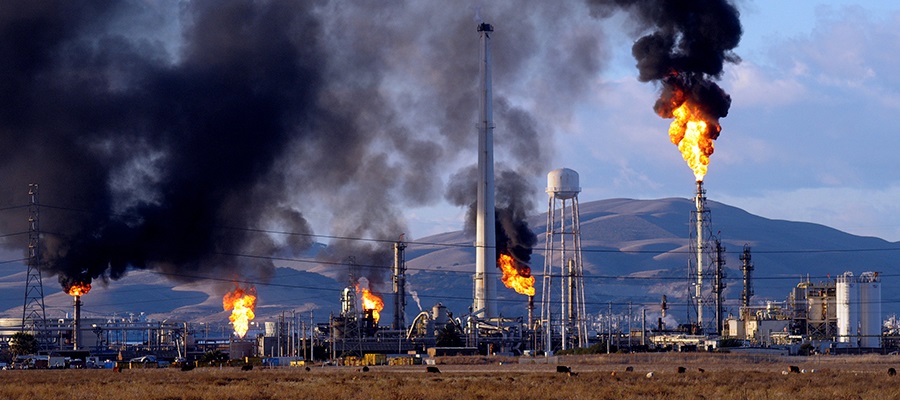
Emissions
Studies by Kang et al. 2014, Kang et al 2016, Boothroyd et al 2016, and Townsend-Small et al. 2016 have all measured methane emissions from abandoned wells. Both properly plugged and improperly abandoned wells have been shown to leak methane and other VOCs to the atmosphere as well as into the surrounding groundwater, soil, and surface waters. Leaks were shown to begin just 10 years after operators plugged the wells.
Well density
The high density of aging and improperly plugged wells is a major risk factor for the current and future development of California’s oil and gas fields. When fields with old wells are reworked using new technology, such as hydraulic fracturing, CO2 flooding, or solvent flooding (including acidizing, water flooding, or steam flooding), the injection of additional fluid and gas increases pressure in a reservoir. Poorly plugged or aging wells often lack the integrity to avoid a blowout (the uncontrolled release of oil and/or gas from a well). There is a consistent risk that formation fluids will be forced to migrate up the plugged wellbores and bypass the existing plugs.
Groundwater
In a 2014 report, the U.S. Geological Service warned the California State Water Resources Control Board that the integrity of abandoned wells is a serious threat to groundwater sources, stating, “Even a small percentage of compromised well bores could correspond to a large number of transport pathways.”
The California Council on Science and Technology (CCST) has also suggested the need for additional research on existing aquifer contamination. In 2014, they called for widespread testing of groundwater near oil and gas fields, which has still not occurred.
Leaks
In addition to the contamination of underground sources of drinking water, abandoned well failures can even create a pathway for methane and fluids to escape to Earth’s surface. In many cases, such as in Pennsylvania, Texas, and California, where drilling began prior to the turn of the 20th century, many wells have been left unplugged. Of the abandoned wells that were plugged, the plugging process was much less adequate than it is today.
If plugged wells are allowed to leak, surface expressions can form. These leaks can travel to the Earth’s crust where oil, gas, and formation waters saturate the topsoil. A construction supervisor for Chevron named David Taylor was killed by such an event in the Midway-Sunset oil field near Bakersfield, CA. According to the LA Times, Chevron had been trying to control the pressure at the well-site. The company had stopped injections near the well, but neighboring operators continued high-pressure injections into the pool. As a result, migration pathways along old wells allowed formation fluids to saturate the Earth just under the well-site. Tragically, Taylor fell into a 10-foot diameter crater of 190° fluid and hydrogen sulfide.
California regulations
Following David Taylor’s death in 2011, California regulators vowed to make urgent reforms to the management of underground injection, and new rules finally went into effect on April 1, 2018. These regulations require more consistent monitoring of pressure and set maximum pressure standards. While this will help with the management of enhanced oil recovery operations, such as steam and water flooding and wastewater disposal, the issue of abandoned wells is not being addressed.
New requirements incentivizing operators to plug and abandon idle wells will help to reduce the number of orphan wells left to the state, but nothing has been done or is proposed to manage the risk of existing orphaned wells.
Conclusion
Why would the state of California allow new oil and gas drilling when the industry refuses to address the existing messes? Why are these messes the responsibility of private landholders and the state when operators declare bankruptcy?
New bonding rules in some states have incentivized larger operators to plug their own wells, but old low-producing or idle wells are often sold off to smaller operators or shell (not Shell) companies prior to plugging. This practice has been the main source of orphaned wells. And regardless of whether wells are plugged or not, research shows that even plugged wells release fugitive emissions that increase with the age of the plug.
If the fossil fuel industry were to plug the existing 1.666 million currently active wells, there would be nearly 5 million plugged wells that require regular inspections, maintenance, and for the majority, re-plugging, to prevent the flow of greenhouse gases. This is already unattainable, and drilling more wells adds to this climate disaster.
By Kyle Ferrar, Western Program Coordinator, FracTracker Alliance