By Brook Lenker, Executive Director, FracTracker Alliance
Touring Doddrige County, West Virginia
On September 26th, FracTracker staff and board member, Brian Segee, traveled to Doddridge County, West Virginia for an eye-popping tour. This endeavor was led by Diane Pitcock of West Virginia Host Farms and local activists who are deeply concerned about the fate of their region – an area overwhelmed by shale gas development.
Approaching West Union on route 50, a giant flare roars above the roadway and about every fourth vehicle, mostly pickups, tankers, and dump trucks, suggest association with the shale gas industry. At the café in town, vehicles baring EQT logos fill the lot. Nearby, Middle Island Creek flows thick and brown despite an absence of rain for the past five days. Diane says it’s frequently muddy from the constant pipeline construction upstream.
Mark West site
The first stop is a Mark West complex with a cryogenic plant burning off excess hydrocarbons, a yard for loading CNG on tanker trucks, one well pad, and another in the works (see photo right). To build the latter, a hillside is being disemboweled. The heavy equipment and a train of idling trucks release diesel emissions. A stream once coursed through the field in the foreground, but the previous landowner had filled and relocated it without a permit. Watching and photographing from the adjoining rail trail, irony rules. The trail sign is topped by a company-placed “No Trespassing” sign. From the discussion and observations, it’s clear that the environment is being devalued and degraded in Doddridge County.
The tour continues on to a water withdrawal site. According to the permit numbers plastered beside the conduit, the site hosts approximately 50 unconventional gas wells – each requiring millions of gallons of water to crack the shale and hasten the flow of gas.
Right-of-Way?
Next, we traverse gravelly back roads widened by the industry. The roadway expansion often requires the purchase of right-of-way from landowners. Our guides tell us that if a landowner says no, sometimes they are told “if you don’t sell, we’ll take it by eminent domain.” The threat is hollow if not deceitful, since in such circumstances the industry has no right to exercise eminent domain. The industry does have the right to access mineral rights they may own, however, even if they don’t own the property on the surface. In West Virginia, these “split estate” situations are as common as country music, only they project a much more somber note to the landowner, especially when the gas company comes knocking.
A Neighbor’s Perspective
Well pad visit
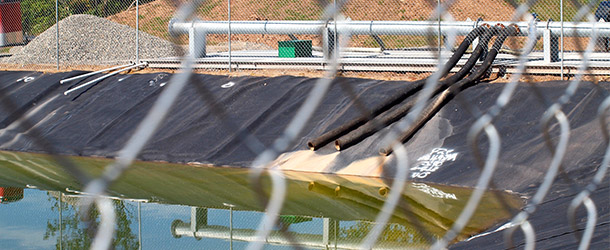
A freshly cut and clearcut road travels onward and upward across a half mile or more of former forest where a nice lady owns the land but not the natural gas being accessed more than a mile below. Piles of logs line the roadside, a reminder of what was. The road ends at a fenced impoundment holding thousands of gallons of impaired water. An odor, akin to antifreeze, hangs in the dry, dusty air. The lady tells the group about the wildlife she has seen, including the songbirds that rest on the high fence and likely drink from the poisonous reservoir.
Downhill lies an expansive well pad, big enough for a football game if there wasn’t the metallurgical din and sprawl of a towering drill rig and the pipes and machinery that accompany it. The landowner’s presence enables our group to enter the working well pad where workers, sleeping off a long shift, emerge from a trailer. While over 30 of her roughly 80 acres are affected by drilling-related activities, only a payment for timber is in negotiation. Meanwhile, she pays the taxes on the land – a parcel that will never quite be the same. Tom Bond, a local and well-informed activist, wistfully comments, “This is just the beginning. Eventually there will be well pads everywhere.” He may be right.
Pipeline Construction
A golden afternoon closes crossing steel plates over an open trench and green pipeline. The corridor is an undulating, exposed ribbon of ground spanning ridge to ridge in each direction. There are many more just like it snaking across the hills and hamlets of West Virginia from one compressor station to another.
From witnessing the industry’s heavy footprint to the stories we hear of problems emerging in home water wells, somehow a happy John Denver tune now seems melancholy.
By Samantha Malone, MPH, CPH – Manager of Science and Communications
In August I spent a little over two weeks in Europe, the first of which was for work in Berlin, Germany and Basel, Switzerland. Now that I have had some time to process my travels and am back on a proper sleep schedule, I thought I’d provide a little wrap up of my impressions of Europe and the issue of unconventional drilling.
Berlin, Germany
Berlin, Germany
In Berlin, I was hosted by two innovative organizations: JF&C and Agora Energiewende. JF&C is a consulting company that advises on international markets and sustainable growth. The roundtable held by JF&C was intended to bring together a diverse group of decision-makers in Germany to discuss potential challenges of heavy drilling in Europe — and they did not disappoint. Participants included representatives from the:
BMU Water Management, Waste Management, Soil Conservation department.
The diverse backgrounds of the group led to a heated yet balanced debate on the topic of whether unconventional gas extraction should occur in Germany, as well as the rest of Europe. I was quite impressed by the transparent and matter-of-fact perspectives held by attendees, which as you can see above included governmental, NGO, and industry reps.
My next presentation in Berlin was coordinated by Agora Energiewende. Energiewende refers to Germany’s dedication to transitioning from non-renewable to more sustainable fuels. You can read more about the movement here. This forum was set up in a more traditional format – a talk by me followed by a series of questions from the audience. Many of the attendees at this event were extremely well informed about the field of unconventional drilling, climate change, and economics, so the questions were challenging in many respects. Attendees ranged from renewable energy developers to US Embassy personnel. As a reflection of such diversity, we discussed a variety of topics at this session, including US production trends and ways to manage and prepare databases in the event that heavy drilling commences in Germany and other parts of Europe.
Interestingly, one of the major opponents of this form of gas extraction in Germany, I learned, has been the beer brewers. (They were not able to be at the table that day, sadly enough.) German breweries that adhere to a 4-ingredient purity law referred to as Reinheitsgebot are very concerned and also very politically active. You can read more about beer vs. fracking here, just scroll down that page a bit.
Over decadent cappuccinos the next morning, I met with Green Parliament representatives who wanted to hear firsthand about FracTracker’s experience of drilling in the U.S. Overall, my Berlin tour showed me that many individuals seemed skeptical that unconventional drilling could safely fulfill their energy needs, while also possessing a hearty intellectual craving to learn as much about it as they could.
Basel, Switzerland
Basel, Switzerland
The second part of the week was dedicated to attending and presenting at the International Society for Environmental Epidemiology conference in Basel, Switzerland. I participated in a panel that discussed the potential environmental and public health impacts of unconventional gas and oil drilling, as well as methods for prevention and remediation. The audience was concerned about a lack of regulatory and data transparency and the likelihood that such operations could contaminate ground/drinking water supplies. Based on the number of oil and gas wells impacted by the recent Colorado flooding tragedy, I cannot blame them. Most of these attendees were from academia or non-profits, although not entirely; check out coverage from this Polish radio station. (As mentioned in a previous post, Poland is one of the countries in Europe that has the potential for heavy drilling.)
The amount of knowledge I gained – and shared – from this one week alone is more than could have been possible in a year through phone calls and email exchanges. I am incredibly thankful for our funders’ and FracTracker’s support of this endeavor. Being able to discuss complex issues such as unconventional drilling with stakeholders in person is an invaluable key for dynamic knowledge sharing on an international level.
Links to My Presentations (PDFs): JF&C | Agora | ISEE
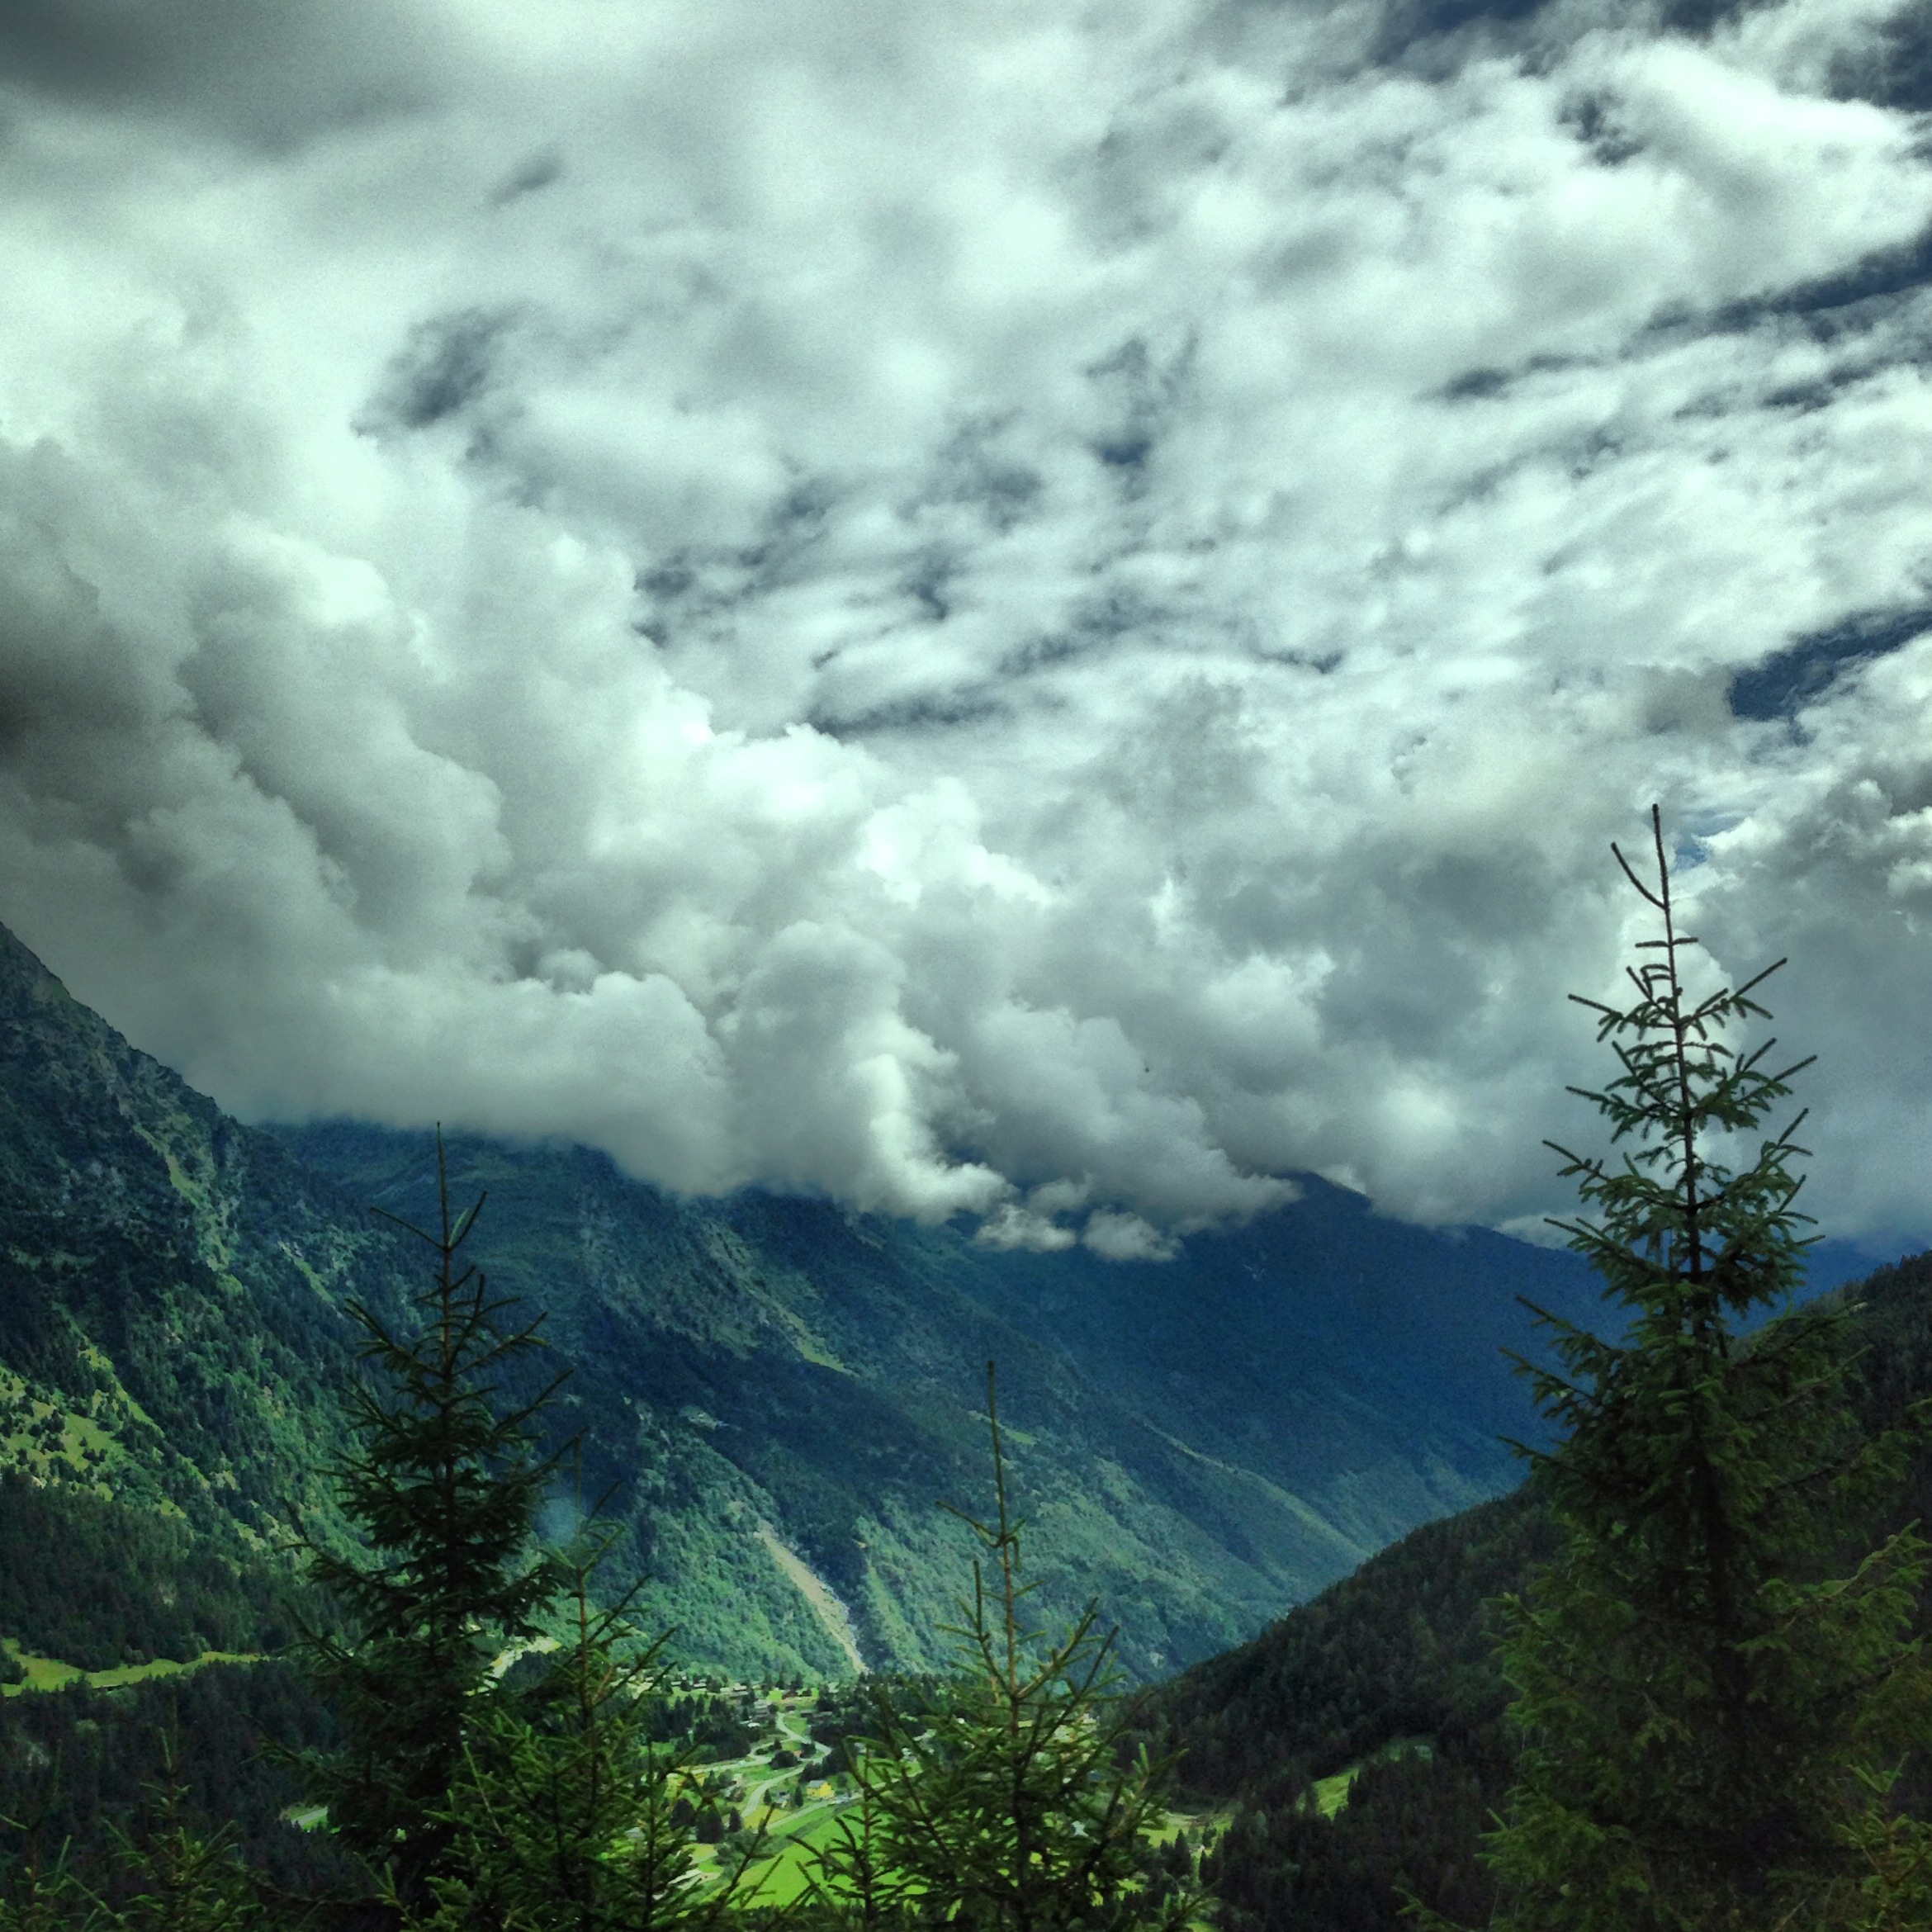
A few non-work pictures from the second week of my trip…
Pittsburgh Regional Environmental Threats Analysis (PRETA) Air: Hazardous Air Pollutants
Although now we are an independent non-profit, FracTracker.org actually started as a project of CHEC at the University of Pittsburgh Graduate School of Public Health. At that time, Matt, Kyle, and I worked with researchers such as Drew Michanowicz and Jim Fabisiak of Pitt, as well as Jill Kriesky now of the Southwest PA Environmental Health Project, on a data mapping and analysis project called PRETA. The Pittsburgh Regional Environmental Threats Analysis (PRETA) is intended to inform stakeholders about Southwest Pennsylvania’s major environmental health risks and provide ways to manage them. CHEC worked with key decision makers and other academics to identify, prioritize, and assess these risks. The top three risks identified were ozone, particulate matter (PM), and hazardous air pollutants (HAPs). Due to the extensive time that research like this takes, the final report about hazardous air pollutants was just recently released.
Relevant to our oil and gas readers, the HAPs report included a piece about the proposed ethane cracker slated to be built in Beaver County, PA. Below is an excerpt of PRETA HAPs that discusses how the air quality in our region may change as a result of the removal of the present zinc smelter on that site, in place of the new cracker facility.
Future Trends: New Sources of HAPs in Western Pennsylvania?
All of the previous risk analyses and data discussed [earlier in the report] were drawn using historical data collected in previous years. There is considerable delay around emissions inventory collection, air monitoring data collection, atmospheric modeling, and the calculated risk estimates’ being made public. Hence, these analyses speak best toward past and present trends. They often are less useful in predicting future risks, especially when sources and technologies are constantly changing. For example, better pollution mitigation and retrofitting processes should curtail future emissions from present levels. In addition, changing the profile of various industries within a region also will alter atmospheric chemistry and subsequent risks in future scenarios.
In recent years, there has been an unprecedented expansion of unconventional natural gas development (UNGD) in Western Pennsylvania, Ohio, and West Virginia driven in part by the recent feasibility of hydraulic fracturing, which is part of a drilling procedure that allows for the tapping of the vast methane deposits contained in the Marcellus and Utica shales beneath Pennsylvania and surrounding states. Primarily, drillers are seeking to extract methane (CH4), the primary component of natural gas. However, a portion of the natural gas present in our area is considered “wet gas,” which includes heavier hydrocarbons like ethane, propane, and butane that are typically dissolved in a liquid phase or condensate. These compounds are separated from the methane to be marketed as such products as liquid propane or used as feedstock in numerous other chemical processes. Therefore, a high demand remains for wet gas deposits regardless of fluctuating natural gas (methane) market prices. Thus, a large-scale expansion in other industries (e.g., chemical manufacturing) is anticipated to follow UNGD; new industrial facilities are needed to support the refining of wet gas condensates. For example, an ethane cracker converts or “cracks” ethane, a by-product of natural gas, into ethylene so that it can be used in the production of plastics.
Located in Monaca, Pa. (Beaver County), about 12 miles east of the West Virginia border, is an aging zinc smelter owned by the Horsehead Corporation. The present Horsehead facility is currently the largest zinc refining site in the United States, producing metallic zinc and zinc oxide from recycled material and steelmaking waste. The plant opened in the 1920s to take advantage of the by-products of steel manufacturing and has expanded and modernized over time. It employed about 600 workers until recently, when the company announced its relocation to a new state-of-the-art facility in North Carolina in the near future. The scope of this metal-refining operation was such that it was a significant source of metals and criteria air pollutants.
Recently, Shell Chemical, U.S. subsidiary of Royal Dutch Shell PLC, announced plans to build an ethane cracker in the northeast to take advantage of UNGD. Lured by substantial tax benefits and other economic incentives, Shell chose the former zinc smelting site in Monaca as its proposed new location for such a facility and, in March 2012, received the approval from Pennsylvania officials to build this petrochemical complex. The cracker, according to industry representatives, will be a multibillion-dollar structure and provide thousands of jobs for Pennsylvanians 43, 44. However, many of these jobs depend on the influx of concurrent industries and technologies, which are projected to follow in the wake of sufficient petrochemical refining facilities like the ethane cracker. Thus, it is not likely to be the sole source of pollutants in the area once constructed. Though plant construction remains years away, regional air pollutant composition and chemistry are poised to change as well. Adding to the issue is the fact that the zinc smelter, ranked as one of the worst air polluters in the country in 2002 45, will be decommissioned and have its operations moved to North Carolina.
Here, we will attempt to compare the pollutant profiles of the old and new air pollution sources in order to deduce potential air pollutant changes to existing air quality in the region. Previous emission inventories are available for the Horsehead zinc smelter (EPA Toxic Release Inventory for 2008) 46. Although the proposed cracker facility’s engineering specifics are not available yet, using the records of a similar existing wet gas processing plant, we can approximate the proposed cracker’s yearly emissions. In this case, we have chosen the similarly sized Williams Olefins Cracker Facility currently operating in Geismar, La., whose emissions profiles for 2008 also were available 46. This plant, owned by Williams Partners, L.P., processes approximately 37,000 barrels of ethane and 3,000 barrels of propane per day and annually produces 1.35 billion pounds of ethylene.
In assessing the emission inventories at the two sites, we first sought to compare those pollutants that were common to both facilities. Table 5 (above) compares the annual release of criteria pollutants for which National Ambient Air Quality Standards (NAAQS) exist. These include ozone, sulfur dioxide, nitrogen oxides, particulate matter (PM10, PM2.5), lead, and carbon monoxide, for which health-based regulatory standards exist for their concentration in ambient air1. Not surprisingly, the zinc smelter released large amounts of lead into the air (five tons per year). The proposed ethane cracker, on the other hand, would release only trace amounts of lead into the air and about 0.1 percent of the sulfur dioxide, 3 percent of the carbon monoxide, and 50 percent of the nitrogen oxides of the zinc smelter. Overall, release of PM would be of a similar order of magnitude at the two sites. Thus, the representative cracker facility by itself emits less NAAQS criteria pollutants than the smelter facility.
Similarly, Table 6 (above) examines similarly reported HAPs released from both of the facilities in question. A comparison of available emissions inventories of HAPs reveals a list of common pollutants, including acrolein, benzene, ethylbenzene, xylene, and volatile organic compounds (VOCs). Note the projected increase in release of acrolein and VOCs by the proposed ethane cracker. The latter are a rather broad class of organic chemicals that have high vapor pressure (low boiling point), allowing appreciable concentrations in the air as a gaseous phase 47, 48. Examples of VOCs include formaldehyde, d-limonene, toluene, acetone, ethanol (ethyl alcohol), 2-propanol (isopropyl alcohol), and hexanal, among others. They are common components of paints, paint strippers, and other solvents; wood preservatives; aerosol sprays; cleansers and disinfectants; moth repellents and air fresheners; stored fuels and automotive products; hobby supplies; and dry-cleaned clothing. They also possess a diverse range of health effects, including, but not limited to, eye and throat irritation, nausea, headaches, nosebleeds, and skin rashes at low doses, and kidney, liver, and central nervous system damage at high doses. Some are known or suspected carcinogens. These chemicals are more often known for their role in indoor air pollution and have been linked to allergies and asthma 49. Recall that acrolein is already the primary driver of noncancer respiratory risk in the PRETA area, and releases from the proposed cracker would theoretically add to that burden.
Table 7 shows a compiled list of HAPs that were released from the Geismar plant in 2008 but not from the zinc smelter, highlighting the potential change in the pollutant mixture. For comparison, the pollutants highlighted in yellow represent those that are several orders of magnitude greater than those emitted by the Clairton Coke Works in 2008. Note the rather large emissions of formaldehyde and acetaldehyde that were discussed above as the number one and number five existing cancer drivers in the area.
Other VOCs of note include ethylene glycol, ethylene oxide, methyl-tert-butyl ether and propionaldehyde. While all these pollutants may have toxic effects on their own, one of the primary concerns, especially in outdoor air, should be their ability to form secondary pollutants. For example, we have noted previously that both acetaldehyde and formaldehyde can be formed via photo-oxidation reactions of other hydrocarbons and VOCs. Thus, the direct emissions reported in the table are likely to be significant underestimations of the true burden of acetaldehyde and formaldehyde in the area near the cracker. It also should be mentioned that a complex nonlinear sensitivity exists among VOCs, NOX, and the production rate of ozone (O3). Most urban areas are considered NOX saturated or VOC sensitive and therefore have low VOC/NOX ratios. In these environments, ozone actually decreases with increasing NOX and increases with increasing VOCs—a potentially likely situation within the urban areas of Southwestern Pennsylvania.
In conclusion, it would appear that the replacement of the existing zinc smelter with the proposed ethane cracker has the potential to significantly transform the current pollutant mixture in the region. The elimination of lead and other heavy metal emissions would be replaced by increases in formaldehyde and acetaldehyde. In addition, it does not appear that the proposed ethane cracker alone would increase any of the NAAQS criteria air pollutants, with the possible exception of ozone. On the other hand, the rather large releases of several known cancer drivers, such as formaldehyde and acetaldehyde, from the proposed cracker could increase cancer risk in the immediate proximity. In addition, the large influx of VOCs and fugitive emissions from these operations warrants further predictive analysis, especially with regard to current pollution-mitigating strategies that may not be anticipating a transforming pollutant mix.
Authors and Credits
University of Pittsburgh Graduate School of Public Health Center for Healthy Environments and Communities
Pittsburgh, PA | August 2013
Authors
Drew Michanowicz, MPH, CPH
Kyle Ferrar, MPH
Samantha Malone, MPH, CPH
Matt Kelso, BA
Jill Kriesky, PhD
James P. Fabisiak, PhD
Technical Support
Department of Communications Services
Marygrace Reder, BA
Alison Butler, BA
43. Detrow , S. (2012). What’s an ethane cracker? StateImpact – Pennsylvania. Accessed 12-18-12: http://stateimpact.npr.org/pennsylvania/tag/ethane-cracker.
44. Kelso, M. (2012). Jobs impact of cracker facility likely exaggerated. FracTracker Alliance. Accessed 12-18-12: www.fractracker.org/2012/06/jobs-impact-of-cracker-facility-likely-exaggerated.
45. SCORECARD: The Pollution Information Site. (2002). Environmental Release Report: Zinc Corp. of America Monaca Smelter. Accessed 12-18-12: http://scorecard.goodguide.com/envreleases/facility.tcl?tri_id=15061ZNCCR300FR#major_chemical_releases.
46. U.S. EPA. (2008). Technology Transfer Network, Clearinghouse for Inventories and Emissions Factors The National Emissions Inventory. The National Emissions Inventory. Accessed 1-25-13: www.epa.gov/ttn/chief/net/2008inventory.html.
47. U.S. EPA. (2012). An Introduction to Indoor Air Quality (IAQ). Volatile Organic Compounds. Accessed 12-18-12: www.epa.gov/iaq/voc.html.
49. Nielsen, G.D., S.T. Larsen, O. Olsen, M. Lovik , L.K. Poulsen, C. Glue , and P. Wolkoff. (2007). Do indoor chemicals promote development of airway allergy? Indoor Air 17: pp. 236–255.
By Ted Auch, PhD – Ohio Program Coordinator, FracTracker Alliance
Thanks to the Freedom of Information Act (FOIA), we as US citizens have real-time access to “all oil, chemical, radiological, biological, and etiological discharges into the environment anywhere in the United States and its territories” data via the National Response Center (NRC). The NRC is an:
initial report taking agency…[that] does not participate in the investigation or incident response. The NRC receives initial reporting information only and notifies Federal and State On-Scene Coordinators for response…Verification of data and incident response is the sole responsibility of Federal/State On-Scene Coordinators.[1]
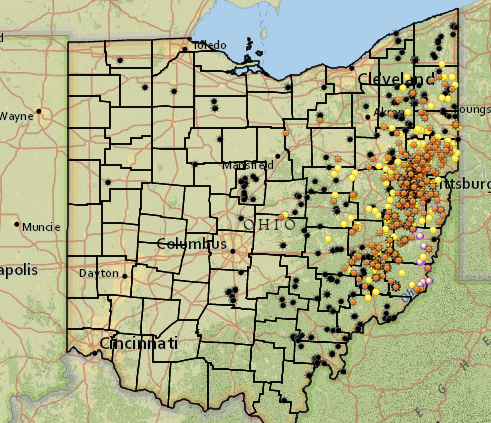
We decided that NRC incident data would make for a useful layer in our Ohio Shale Gas Viewer. As of September 1, 2013 it is included and will be updated bi-monthly. Thanks go out to SkyTruth’s generous researchers Paul Woods and Craig Winters. We have converted an inventory of Ohio reports provided by SkyTruth into a GIS layer on our map, consisting of 1,191 events, including date and type, back to January 2012.
The layer is not visible until you zoom in twice from the default view on the map above. It appears as the silhouette of a person lying on the ground with Skull and crossbones next to it. View fullscreen>
Currently, the layer includes 28 hydraulic fracturing-related events, 61 “Big [Oil and Chemical] Spills,” and 1,102 additional events – most of which are concentrated in the urban centers of Cleveland, Toledo, Columbus, and Toledo OH.
From a Utica Shale corporation perspective, 21 of the 28 reports are attributed to Chesapeake Operating, Inc. (aka, Chesapeake Energy Corporation (CHK)) or 75% of the hydraulic fracturing (HF) events, while CHK only accounts for 48% of all HF drilled, drilling, or producing wells in OH. Anadarko, Devon, Halcon, and Rex are responsible for the remaining 7 reports. They collectively account for 2.7% of the state’s current inventory of unconventional drilled, drilling, or producing wells.
[1] To contact the NRC for legal purposes, email efoia@uscg.mil. The NRC makes this data available back to 1982, but we decided to focus on the period beginning with the first year of Utica permits here in Ohio to the present (i.e., 2010-2013).
https://www.fractracker.org/a5ej20sjfwe/wp-content/uploads/2013/09/Screen-Shot-2013-09-12-at-2.49.41-PM.png465491Ted Auch, PhDhttps://www.fractracker.org/a5ej20sjfwe/wp-content/uploads/2025/09/2025-Wordmark-Logo.pngTed Auch, PhD2013-09-12 14:26:272020-07-21 10:41:20OH National Response Center Data on Shale Gas Viewer
By Kyle Ferrar, CA Program Coordinator, FracTracker Alliance
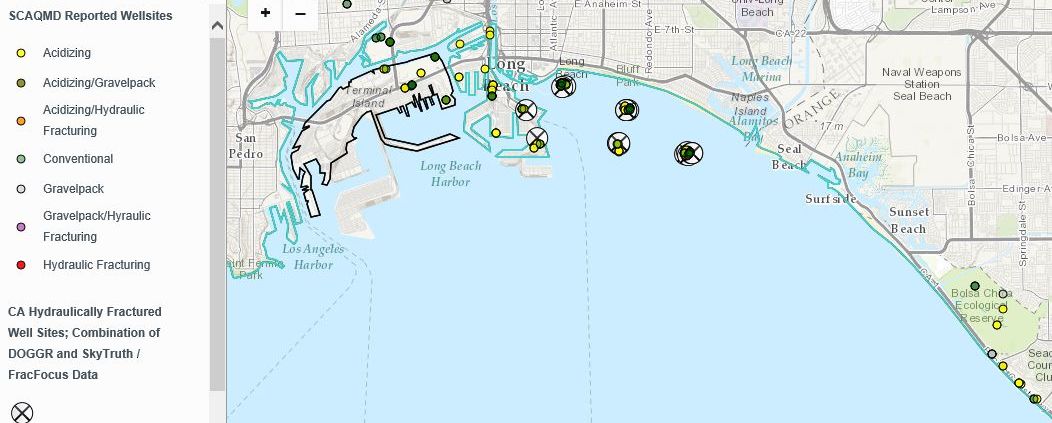
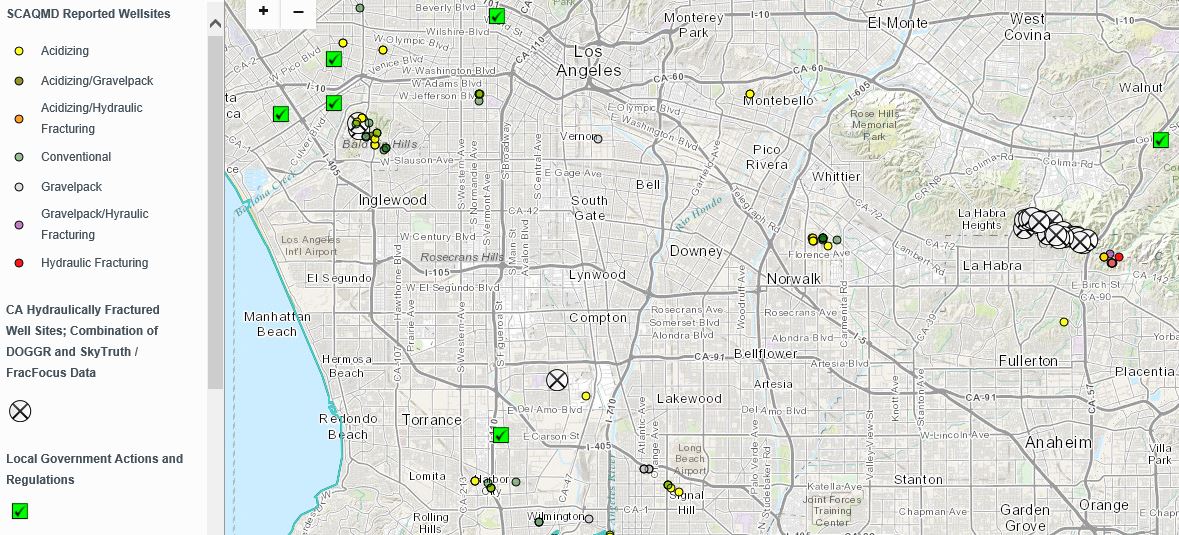
The potential for large scale oil development in the Monterey and other shale basins has raised concern in California communities over the use of hydraulic fracturing and other unconventional well stimulation techniques, such as acidizing. The fact that DOGGR was not tracking the use of these techniques, much less regulating them, has led to a variety of actions being taken by local governments. Several groups including county directors, city councils, and neighborhood and community councils have passed resolutions supporting state-wide bans on hydraulic fracturing and other controversial stimulation techniques. As can be seen in the following map, several of them are located within the greater LA metropolitan area, which is currently considering a local moratorium.
This map shows the local civic groups [green check marks] in the LA metropolitan area that have passed resolutions supporting statewide bans/moratoriums on hydraulic fracturing and other controversial stimulation activities. Click on the map to view larger image.
Two local jurisdictions, the South Coast Air Quality Management District and the County of Santa Barbara, have enacted their own measures to regulate oil and gas development. Both require notification of drilling techniques, and Santa Barbara County requires operators to file for a unique permit when using hydraulic fracturing. Data from the county of Santa Barbara’s permitting program was not readily accessible – although it may well be that they have not issued any permits. The South Coast Air Quality Management District is charged with managing the air quality for Orange County, the city of Los Angeles and the surrounding urban centers of Riverside and San Bernardino. In the spring of 2013, the SCAQMD passed Southern California rule 1148.2. The rule requires oil operators to submit specific reports of well activity documenting drilling, chemical use and the well stimulation techniques employed, directly to the SCAQMD. Reportable methods include acidification, gravel packing, and hydraulic fracturing. The rule was implemented June 2, 2013. The database of well-site data is readily accessible via the web. Web users can obtain individual well summaries of drilling activity and chemical-use reports, or download the full data sets. The site is user-friendly and the data is easily accessible. Unfortunately, the currently available data set is missing some of the most important information, specifically well API numbers – the unique identifier for all wells drilled in the United States. This data gap makes it impossible to compare or cross-reference this data set with others.
FracTracker has mapped the well-sites reported on the SCAQMD in the new map on the California page titled California Local Actions, Monitoring and Regulations. This map outlines the boundaries of SCAQMD and other sub-state regulatory agencies that have elected to manage the drilling activity. Details on the programs are provided in the map layers. The data published by the SCAQMD has been included in the map. In the map above, if you compare the SCAQMD data layer to the Hydraulically Fractured dataset derived by combining DOGGR and FracFocus data, you can see that the two data sets do not look to include the same well sites. Unfortunately, it cannot be known whether this is merely an issue of slightly dissimilar coordinates or legitimate data gaps; the SCAQMD data set lacks the API identifier for the majority of well sites reported. Because the regulatory landscape tends to follow the political leadership that reflects the interests of the constituency, legislative districts have also been included as a viewable map layer. Be active in your democracy.
https://www.fractracker.org/a5ej20sjfwe/wp-content/uploads/2013/09/AQMD-Wellsites.jpg4471052Kyle Ferrar, MPHhttps://www.fractracker.org/a5ej20sjfwe/wp-content/uploads/2025/09/2025-Wordmark-Logo.pngKyle Ferrar, MPH2013-09-07 14:20:492020-07-21 10:41:19Local Actions and Local Regulations in California
By Samir Lakhani, GIS Intern, FracTracker Alliance
In the hazy world of gas flaring and venting, finding worthwhile data often leads one to a dead end. Although the Energy Information Administration (EIA) holds the authority to require active oil/gas companies to disclose this data, they choose not to. EIA will not proceed with such actions because, “…assessing the volume of natural gas vented and flared would add significant reporting burdens to natural gas producers causing them substantial investments.” Additionally, the EIA is not confident that oil/gas producing companies have the capability to accurately estimate their own emissions from venting or flaring activities.
Piece-Meal
Some states do voluntarily submit their estimates, but only 8 of the nation’s 32 oil and gas producing states submit their data. This makes attempts for national estimates incomplete and inaccurate. State officials have repeatedly complained that the EIA has provided them with insufficient guidelines as to how the data should be submitted, and in what format. It appears the only way that concerned parties are able to monitor this practice is with satellite imagery from the sky, to literally watch flaring as it occurs.
Bird’s Eye View
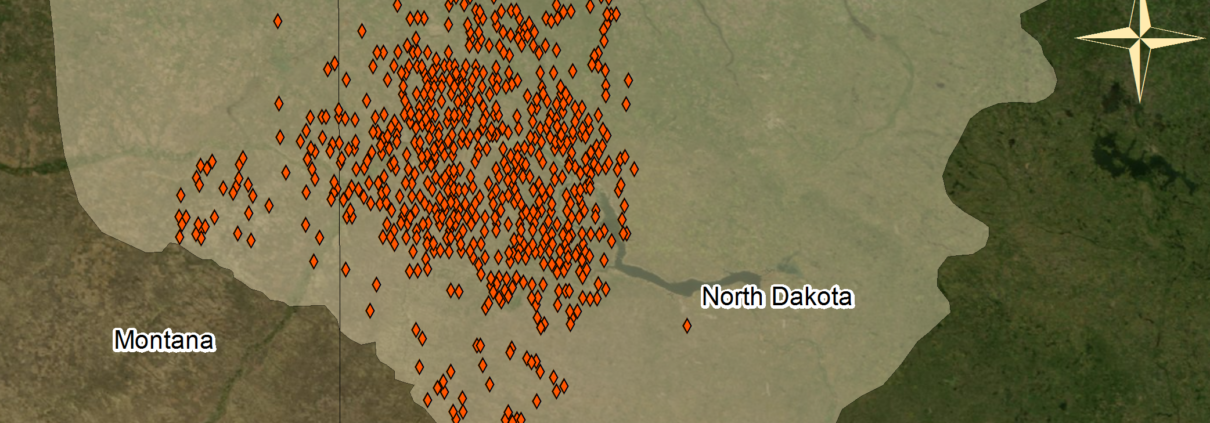
The Bakken Shale Formation has received a considerable amount of attention. We’ve all seen the nighttime satellite images of North Dakota, where a normally quiet portion of the state light up like a bustling city. It is to be understood that not all the lights in this region are gas flares. Much of it is emergency lighting and temporary housing associated with drilling companies.
There are a few obvious issues with satellite surveillance. Firstly, it is difficult to monitor venting emissions from a bird’s eye perspective. Venting is the process by which unsought gas is purposely wafted from drill sites into the atmosphere. Venting is a much more environmentally costly decision compared to the ignited alternative, as pure natural gas is twenty times more potent than CO2 as a greenhouse gas. To monitor venting behavior, from up high, Infrared sensors must be used. Unfortunately, these emissions do not transmit well through the atmosphere. Proper detection must be made much closer to earth’s surface, perhaps from an airplane or on the ground. Secondly, flaring is almost impossible to detect during the day using satellites. One could equate it to attempting to see a flashlight’s beam when the sun is out. Lastly, when the time comes to churn out an estimate on how much gas is really being wasted—the statistics vary wildly.
Using SkyTruth’s satellite image, and GIS data retrieved from North Dakota’s Department of Mineral Resources, it is now possible to pinpoint North Dakota’s most active gas flaring sites. Using this, more accurate estimates are now within reach. North Dakota gas drillers may flare their “associated” gas for up to one year. However, Officials at Mineral Management Service claim that it is not difficult to get an extension, due to economic hardship. There are always instances of gas/oil operators flaring or venting without authorization. In 2003, Shell paid a 49 million dollar settlement over an unnoticed gas flaring and venting operation that lasted several years. The beauty of satellite imagery and GIS detail is the observer’s ability to pinpoint flaring operations and by referencing the leases, evaluate whether or not such practices were authorized.
This map shows flaring activity in the Bakken Formation from January 1 through June 30, 2013. Please click the “Fullscreen” icon in the upper right hand corner to access the full set of map controls.
Regulation and Control
If flaring and venting are costly to the environment and result in a loss of company product (methane), you may ask why these practices are still conducted. Flaring and venting practices are cheaper than building the infrastructure necessary to harness this energy, unfortunately. To effectively collect this resource, a serious piping network is needed. It is as if a solar farm has been built in the desert, but there is no grid to take this power to homes. To lay down piping is an expensive endeavor, and it requires continuous repairs and on-site monitors. Even when North Dakota burns over 30% of their usable product, there is little initiative to invest in long term savings. A second method, called “green completions”, is becoming a more popular choice for oil and gas companies. A green completion is a portable refinery and condensate tank aimed to recover more than half of excess methane produced from drilling. Green completions are the best management practice of today, and the EPA wishes to implement green completion technology nationwide by 2015.
The best way to estimate gas flare and venting emissions is through submissions from gas/oil companies and to analyze the data using GIS applications. Concerned organizations and citizens should not have to rely on satellite services to watch over the towering infernos. There is new research coming out each day on adverse health effects from living in close proximity to a gas flare and vent. It releases a corrosive mixture of chemicals, and returns to the earth as acid rain. Please refer to this publication for a thorough assessment of possible health effects.
This issue is not limited to US borders only; flaring has wreaked havoc in South America, Russia, Africa, and the Middle-East. During the extraction of oil, gas may return to the surface. In many of these areas where oil drilling is prevalent, there are no well-developed gas markets and pipeline infrastructure, which makes venting and flaring a more attractive way to dispose of an unintentionally extracted resource. If the US were to make substantial changes to the way we monitor, regulate, and reduce gas flaring/venting, and accessibility to data, we would set the standard on an international level. Such policy changes include: carbon taxation, streamlining the leasing process (Many oil/gas officials despise the leasing applications for pipelines), installing flaring/venting meters and controls, and tax incentives (to flare and green complete, rather than vent).
All of these changes would tremendously reduce and regulate gas flaring in the US, but without accurate and comprehensive data these proposed policies are meaningless. Data is, and forever will be, the diving board on which policy and change is founded.
Special thanks to Paul Woods and Yolandita Franklin of Skytruth, for using VIIRS and IR technologies to compile the data for the above map.
https://www.fractracker.org/a5ej20sjfwe/wp-content/uploads/2013/07/BakkenShaleMap2-e1459778822164.png9352084Guest Authorhttps://www.fractracker.org/a5ej20sjfwe/wp-content/uploads/2025/09/2025-Wordmark-Logo.pngGuest Author2013-07-18 14:31:102020-07-21 10:41:16Gas Flaring and Venting: Data Availability and New Methods for Oversight
By Samir Lakhani, GIS Intern, FracTracker Alliance
The Floridian Aquifer: Connectivity, Permeability, and Vulnerability
There have been a significant number of enquiries regarding the status of hydraulic fracturing activity in Florida, enough of which garner a FracTracker post. The short answer is that there is minimal drilling activity occurring in Florida—but not for long. It was only a matter of time until gas companies set their gaze on Florida, and her abundance of energy resources. Preparations to drill are already underway. Permits have been filed, equipment is being shipped, and exploratory drilling will begin any minute now. What makes Florida drilling ominous is the real risk for chemical leakage and groundwater contamination.
Imagine this:
It is just another sunny day in sunny Florida, but on this quiet day, two men ring your doorbell. You answer, of course, and find out that these men are from Total Safety, Inc., a company contracted by the independent oil company Dan A. Hughes Company, from Beeville, Texas. They ask you to provide your contact information and any other emergency contact info, just in case disaster strikes at the drill site operating barely 1000 feet from your house. For most of the citizens of Naples, Florida, this is the first they have ever heard of drilling, in their neighborhood. The citizens of Naples, Florida received quite a scare that day. The outrage in the community was so abundant and uniform that these families decided to act out against this development to preserve their piece of paradise. Read More
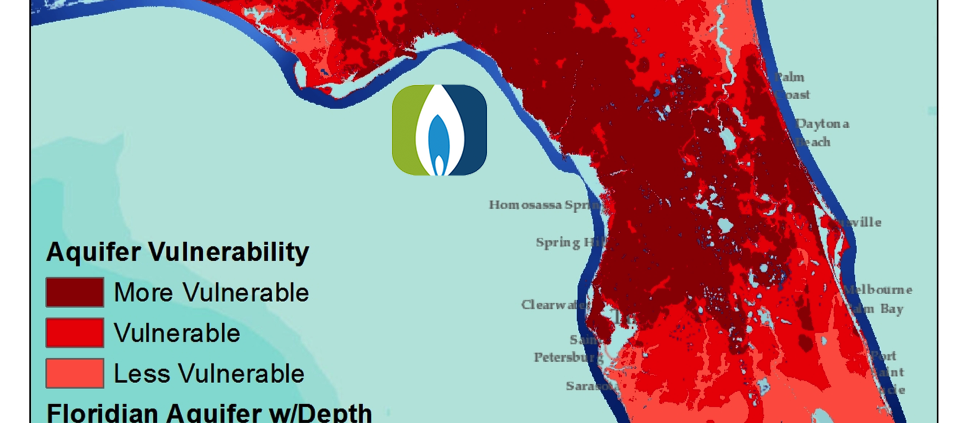
What makes drilling in Florida so precarious is that porous limestone shelves make up the majority of rock underlying permitted well sites. If any accident were to happen, the leakage of waste and chemicals would be virtually impossible to contain. It then would seep directly into the Florida aquifer which lies beneath the entirety of the state and large sections of Alabama, Georgia, and South Carolina. Maintaining water quality for the Floridan Aquifer is non-negotiable, since it is the primary water source for Savannah, Jacksonville, Tallahassee, Orlando, Gainesville, Tampa, and others. An attempt to clean the aquifer thoroughly would be impossible, and not to mention, prohibitively expensive. Another troubling thought is possible contamination and degradation of the beloved Florida Everglades.
Florida is an interesting case right now; the gas game is still very young. Florida lawmakers have an opportunity to draft real preventative measures, rather than legislation after the fact. Hydraulic fracturing is no new phenomenon, and Florida politicians have the prospect of learning from other states, incorporating relevant ideas and taking their own stance on this issue. Currently, a couple of bills are slowly trudging through the state legislature. The idea is to require a list of chemical disclosures from all active gas drilling companies. Environmentalists claim this bill is a sham, for the companies need to list the chemicals used in drilling, but not the quantities of each. It may be just another half-hearted attempt to show real political action, while retaining a good business relationship with drilling companies. It is unlikely more stringent policies will be successful, however, given that some powers currently in office believe climate change to be a fairy tale.
https://www.fractracker.org/a5ej20sjfwe/wp-content/uploads/2013/06/Florida-Acquifers1.png1264977Guest Authorhttps://www.fractracker.org/a5ej20sjfwe/wp-content/uploads/2025/09/2025-Wordmark-Logo.pngGuest Author2013-06-18 16:09:202020-07-21 10:41:15Florida Gas Drilling Developments and Legislation
As the forests beckon us to return to their paths now that winter has subsided (hopefully), let’s take a look at the reports we received over the winter for our Trail Logbook Project.
Impacts Summary
Reports came from several counties, but the majority of complaints focused on the impacts of drilling in Loyalsock State Forest.
Counties:
Clinton
Centre
Lycoming
Warren
Sullivan
Suspected Causes:
Existing gas line
Shallow gas wells
Truck traffic
Pipeline construction
Drilling/hydraulic fracturing
Impoundment
Seismic Testing
Main Trails Affected:
Loyalsock State Forest trails
Eddy Lick Trail Loop
Minister Creek Trail
Impacts Reported (in descending order according to frequency):
Unpleasant odors
Confrontation with gas company employees, contractors, security personnel
Noise impacts
Potential degradation/contamination of a stream, spring, lake, or pond, brine in the water at ANF pump
Visual impacts (degradation of scenery)
Logbook Quotes
Drilling has largely overtaken this tract of Loyalsock State Forest. I would say that drilling has completely eclipsed the recreational aspect of the tract. Indeed, the tract seems to have been transformed into an industrial forest. I came here for hiking and nature photography, but I felt as though I were a guest on Seneca-owned land, not a visitor to public land paid for by the citizens of Pennsylvania. I noticed no other visitors in the tract, too; everyone I saw was a Seneca employee. The scenic vista on Bodine Mountain Road (noted on the Loyalsock State Forest map) was less than scenic when I visited; many drilling pads (some near, some far) were seen. The noise from trucks and compressors also diminished the recreational aspect. I won’t return here until most of the drilling ends.
This stream, Minister Creek, is a “Safe” zone for Brook Trout. It now has areas of bubbles and a thin oil sheen on its surface in addition to the Brine taste at the pump.
While setting up campsite just off the Loyalsock Trail at the old CCC Camp on Sandstone Lane, I heard an approaching Crew Truck with a loudspeaker blasting radio conversation with supervisors. As the Lane had been damaged in recent storms, they tried to drive thru a meadow and right thru my Campsite. There was no opening in the trees wide enough to pass and I told them so. They went back to the lane and bored thru the rutted, flood-gouged lane past my camp…
Recommendations from Citizen Reports
Where roads are narrow, especially in forested areas, there are often checkpoints set up by the operators in order to control two-way traffic. Often signs are not sufficiently visible/present/clear, so motorists may not realize the new rules. In Loyalsock State Forest, this has been an issue. As such, below are recreationalists’ recommendations regarding ways to reduce or avoid the issues currently arising from gas operations in this and other public areas:
Seneca Resources Corp. and the DCNR should work together to better educate visitors on the need to stop at every checkpoint in this tract of Loyalsock State Forest (or in any forested area that is frequented by recreationalists).
At each of the two entrances (Hagerman Run Road and Grays Run Road) to the tract from Pennsylvania Route 14, post a large, prominent sign about the need to stop at every checkpoint for two-way traffic control;
Post clearly visible signs at every checkpoint; and
On the DCNR Web site in the Advisories section of the Loyalsock State Forest page, post information about roads affected by two-way traffic control and the need to stop at checkpoints. (Currently, information about such roads is posted on the Road Advisories page on the DCNR Web site, but accessing this page from the home page is challenging. Also, the Road Advisories page doesn’t mention that motorists need to stop at checkpoints.)
More Information
Visit the Trail Logbook Project landing page for more information about this initiative, our partners, and to submit your own report.
https://www.fractracker.org/a5ej20sjfwe/wp-content/uploads/2012/04/Logbook-FracTracker-Postcard-Front.jpg10001500FracTracker Alliancehttps://www.fractracker.org/a5ej20sjfwe/wp-content/uploads/2025/09/2025-Wordmark-Logo.pngFracTracker Alliance2013-05-14 10:17:422020-07-21 10:40:59Winter Summary of the Trail Logbook Project
FOR IMMEDIATE RELEASE US Map of Suspected Well Water Impacts
Contacts: Brook Lenker, Executive Director, FracTracker Alliance, (717) 303-0403; and
Samantha Malone, Manager of Science and Communications, FracTracker Alliance, (412) 802-0273
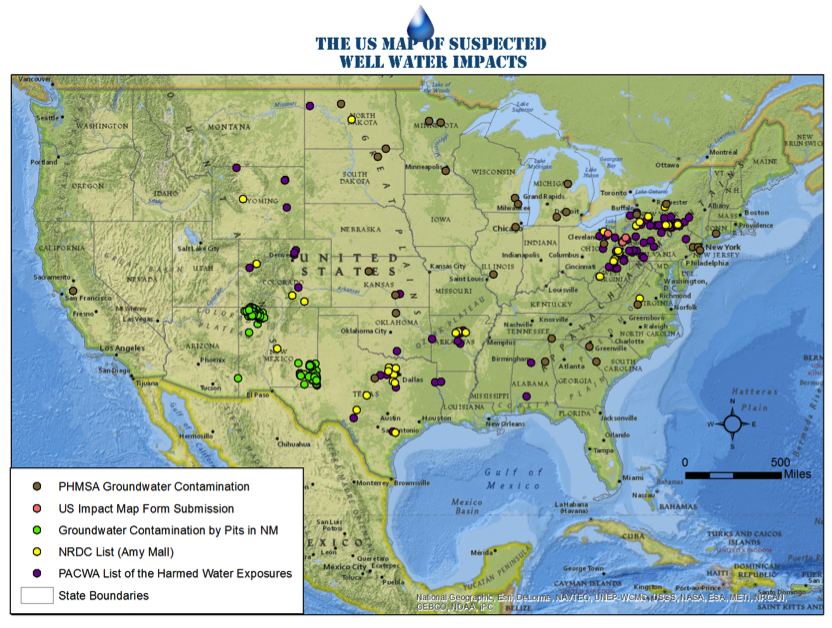
May 1, 2013 – The US Map of Suspected Well Water Impacts is a project that will attempt to piece together recent complaints of well water quality impacts that people believe are attributed to unconventional gas and oil operations. Research has demonstrated potential risks to ground and drinking water posed by faulty well casings, surface spills, and hydraulic fracturing. From across the country, in areas where gas and oil development is occurring, accounts of possible well water contamination have been reported but not been collected all in one place – yet. The FracTracker Alliance and cooperating organizations are providing that opportunity.
Inspired by other “crowd-sourced” data and mapping projects, this project aims to collect ongoing stories, narratives, and data from individual homeowners living on well water near drilling operations and map the general location of these reports online. The first version of the dynamic map (shown below) is available at www.fractracker.org/usmap.
Once received, submissions will be reviewed to the extent possible by cooperating researchers and organizations. Not all reported cases of water contamination, however, have been or will be able to be substantiated. According to Brook Lenker, Executive Director of FracTracker Alliance:
The reports we are collecting are not necessarily indisputable evidence that drilling has contaminated drinking water sources. Some accounts are irrefutable. Others remain unsubstantiated, but that doesn’t mean the well owner isn’t experiencing serious problems. Even where proof may be elusive, perception of risk can tell us much about an issue and the level of concern by the community. This information will likely help to identify pre-existing problems or conditions that were not previously well known. Such outreach is needed to permit citizens, local agencies, and others to work together to address pre-existing concerns, improve local regulations or standards, conduct proper baseline testing and monitoring, and make informed decisions.
As unconventional natural gas and oil extraction expands internationally, an Internet-based project like the US Map of Suspected Well Water Impacts can help to share on a global scale how people in the U.S. view – and may be impacted by – unconventional drilling. If everyone contributed their stories, the public’s understanding of gas and oil extraction’s impacts on well water could expand dramatically.
Anyone wishing to submit their story should visit www.fractracker.org/usmap or call (202) 639-6426. A complete list of current project partners is available on the website.
https://www.fractracker.org/a5ej20sjfwe/wp-content/uploads/2013/05/WellWaterProjFeature.png250610FracTracker Alliancehttps://www.fractracker.org/a5ej20sjfwe/wp-content/uploads/2025/09/2025-Wordmark-Logo.pngFracTracker Alliance2013-05-01 09:32:442020-07-21 10:40:58Launch of National Mapping Project Designed to Show Possible Impacts of Oil and Gas Drilling on Well Water
Identified by Researchers at the University of Pittsburgh Graduate School of Public Health
By Kyle Ferrar, MPH – DrPH Candidate, Environmental and Occupational Health Department, Graduate School of Public Health, University of Pittsburgh
The potential for negative health impacts to result from unconventional natural gas development activities, such as hydraulic fracturing (deemed “frac’ing”) occurring in the Marcellus Shale basin, is a highly debated and contentious issue. To resolve this issue public health and medical professionals will need to conduct a large-scale epidemiological study – one that monitors the lives and health of a large sample of people for an extended period of time. Such a study should test to see if proximity, or closeness to unconventional natural gas development, such as frac’ing, causes negative health impacts. Such a study has not yet been officially proposed in Pennsylvania, much less funded, but researchers at the University of Pittsburgh’s Center for Healthy Environments and Communities (CHEC) believe such a study will be conducted in the future.
New peer-reviewed research released by the CHEC provides background data for that kind of study. The research documented 59 unique health impacts, or “symptoms,” and 13 “stressors” perceived to result from Marcellus Shale development. Over time, symptoms and perceived health impacts increased for the sample population (p<0.05), while stressors resulting from Marcellus Shale activity remained consistent (p=0.60). The study group was a biased sample population, meaning the participants were not randomly selected. Rather, the participants were already concerned by or interested in issues associated with this industrial activity.
Using community based participatory research methods, researchers from CHEC, along with researchers from FracTracker while it was still a project at CHEC, engaged community members with in-depth interviews. Mail surveys have been conducted by other researchers in Colorado and Wyoming, but this is the first research to use an ethnographical, in-person approach. Furthermore, this is the first peer-reviewed and published research that describes symptoms in those who believe their health has been affected. The six most reported symptoms are reported in Table 1, with stress being the most commonly reported health effect.
The article contributes several new findings to this field of research, including evidence about what people report as stressors. Contributions of stress to negative health effects are well documented in the literature, known as allostatic loads. The six most commonly reported “stressors,” or sources of stress, are reported in Table 2. Particularly notable is the very high percentage of the group that report issues such as being lied to that presumably would be corrected if the industry became more transparent and responsive. The article also reports on the longitudinal nature of the perceived health impacts and stressors. Longitudinal refers to the fact that the data were collected over time, not just once. Follow-up interviews conducted 19-22 months after the initial interviews showed that the number of perceived health impacts reported by participants actually increased over time, while the number of stressors reported remained consistent. This contradicts industry’s argument that the problems are mainly caused by seeing and hearing drilling activity, and that as the intensity of activity diminishes over time so will the symptoms and stressors. While this research does not answer the larger question of whether negative health effects are associated with Marcellus Shale development, it demonstrates a need for future studies to be conducted within these particular communities and supports the more difficult task of embarking on a broader epidemiological study.
Table 1. Most reported symptoms with the percentage of participants reporting said symptom.
Symptoms
Session 1 (n=33)
Stress
76%
Rashes
27%
Loss of sleep
27%
General illness
24%
Headaches
24%
Diarrhea
24%
Shortness of breath
21%
Table 2. Most reported “stressors” participants associated with Marcellus Shale development, with the percentage of participants reporting said stressor.
https://www.fractracker.org/a5ej20sjfwe/wp-content/uploads/2012/02/Twitter-FracTracker-Logo.png291317Guest Authorhttps://www.fractracker.org/a5ej20sjfwe/wp-content/uploads/2025/09/2025-Wordmark-Logo.pngGuest Author2013-04-30 10:51:592020-07-21 10:40:58Negative Health Impacts & Stressors Perceived to Result from Marcellus Shale Activity