By Samir Lakhani, GIS Intern, FracTracker Alliance
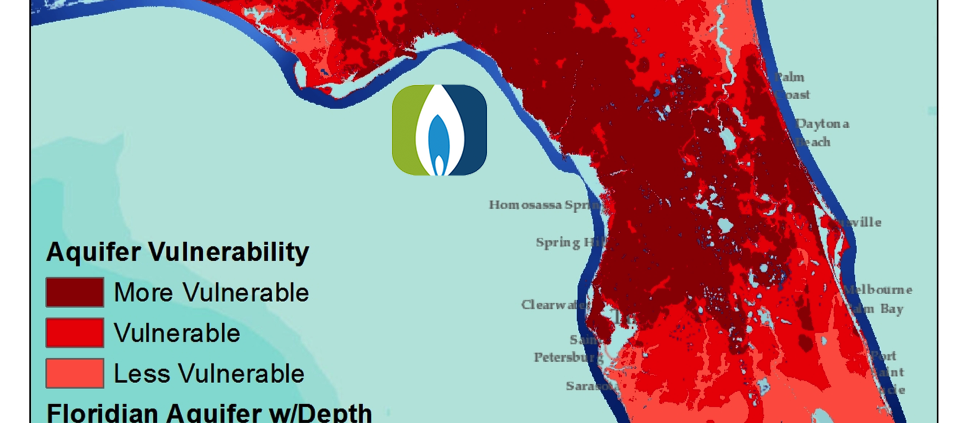
The Floridian Aquifer: Connectivity, Permeability, and Vulnerability
There have been a significant number of enquiries regarding the status of hydraulic fracturing activity in Florida, enough of which garner a FracTracker post. The short answer is that there is minimal drilling activity occurring in Florida—but not for long. It was only a matter of time until gas companies set their gaze on Florida, and her abundance of energy resources. Preparations to drill are already underway. Permits have been filed, equipment is being shipped, and exploratory drilling will begin any minute now. What makes Florida drilling ominous is the real risk for chemical leakage and groundwater contamination.
Imagine this:
It is just another sunny day in sunny Florida, but on this quiet day, two men ring your doorbell. You answer, of course, and find out that these men are from Total Safety, Inc., a company contracted by the independent oil company Dan A. Hughes Company, from Beeville, Texas. They ask you to provide your contact information and any other emergency contact info, just in case disaster strikes at the drill site operating barely 1000 feet from your house. For most of the citizens of Naples, Florida, this is the first they have ever heard of drilling, in their neighborhood. The citizens of Naples, Florida received quite a scare that day. The outrage in the community was so abundant and uniform that these families decided to act out against this development to preserve their piece of paradise. Read More
What makes drilling in Florida so precarious is that porous limestone shelves make up the majority of rock underlying permitted well sites. If any accident were to happen, the leakage of waste and chemicals would be virtually impossible to contain. It then would seep directly into the Florida aquifer which lies beneath the entirety of the state and large sections of Alabama, Georgia, and South Carolina. Maintaining water quality for the Floridan Aquifer is non-negotiable, since it is the primary water source for Savannah, Jacksonville, Tallahassee, Orlando, Gainesville, Tampa, and others. An attempt to clean the aquifer thoroughly would be impossible, and not to mention, prohibitively expensive. Another troubling thought is possible contamination and degradation of the beloved Florida Everglades.
Florida is an interesting case right now; the gas game is still very young. Florida lawmakers have an opportunity to draft real preventative measures, rather than legislation after the fact. Hydraulic fracturing is no new phenomenon, and Florida politicians have the prospect of learning from other states, incorporating relevant ideas and taking their own stance on this issue. Currently, a couple of bills are slowly trudging through the state legislature. The idea is to require a list of chemical disclosures from all active gas drilling companies. Environmentalists claim this bill is a sham, for the companies need to list the chemicals used in drilling, but not the quantities of each. It may be just another half-hearted attempt to show real political action, while retaining a good business relationship with drilling companies. It is unlikely more stringent policies will be successful, however, given that some powers currently in office believe climate change to be a fairy tale.
https://www.fractracker.org/a5ej20sjfwe/wp-content/uploads/2013/06/Florida-Acquifers1.png1264977Guest Authorhttps://www.fractracker.org/a5ej20sjfwe/wp-content/uploads/2025/09/2025-Wordmark-Logo.pngGuest Author2013-06-18 16:09:202020-07-21 10:41:15Florida Gas Drilling Developments and Legislation
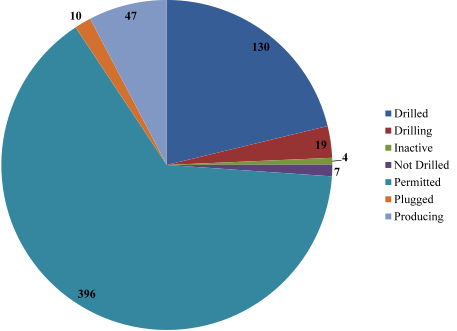
The Ohio Utica play has taken off in the last calendar year, jumping from 160 permitted wells as of March 2012 to 453 since then. This equates to 1.24 permitted wells per day. (Note: The state’s less exploited Marcellus shale had 13 permitted wells a year ago with an increase of 7 since then.) A year ago Ohio was home to 50 “drilled” wells and is now home to an additional 80 “drilled” wells (Figure 1). Meanwhile 0.65% and 1.14% of permitted wells are what Ohio Department of Natural Resources (ODNR) calls “Inactive” or “Not Drilled” with the latter being relatively similar a year ago vs. today with 3 and 4 “Not Drilled” wells, respectively. According to the latest ODNR data 54 Utica wells were permitted as of 4/1/2012 vs. 342 since then. Plugged wells constitute 1.63% of all Ohio Utica wells although the industry appears to be increasing efficiency with respect to plugging having experienced 7 “Plugged” wells as of 4/1/2012 and only 3 since. Conversely, wells that are “Producing” have declined from 25.63% (41 “Producing” wells) of all permitted wells to 1.32% (6 “Producing” wells) of all permitted wells since then with the latest reported producing well being a Mountaineer Keystone well in Windham Township, Portage County.
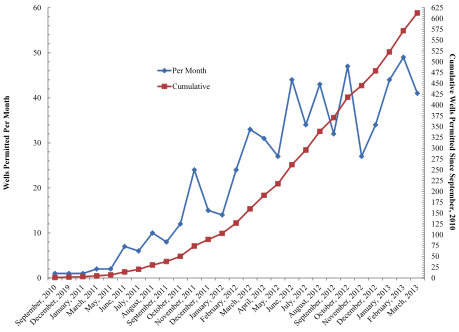
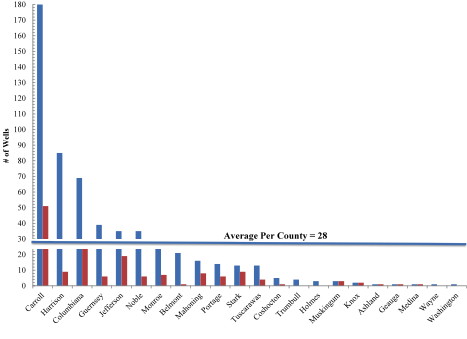
The permitting process has continued along its exponential path since permitting began September 28, 2010 (Figure 2). The gross average number of permitted Ohio Utica wells per month in the last five months is 39 with a total of 195 permitted since November 2012. The quarterly permit average has increased by an order of magnitude of 4.2 permits per month between September 2010 and 2011 to 39 per month since September 2012. In recent months Washington county was added to the list of Ohio counties home to Utica hydraulic fracturing permits, while Carroll remains the state with the most Utica permits followed by Harrison, Columbiana, Guernsey, and Jefferson/Noble with the average number of Utica well permits across the 22 counties home to at least one permit being 28 per county with six counties above and sixteen below this mean (Figure 3). In the last year the four counties that have entered the Utica conversation are Trumbull, neighboring Holmes and Wayne, and Washington, with 4, 3, 1, and 1 Utica permit as of April 1st, respectively. Meanwhile five other counties have seen no increase in Utica permits including Muskingum, Knox, Ashland, Geauga, and Medina. Conversely Belmont County has seen a 21-fold increase in Utica well permits followed distantly by Harrison, Guernsey, Noble, and Coshocton counties all of which have experienced ≥5-fold increases.
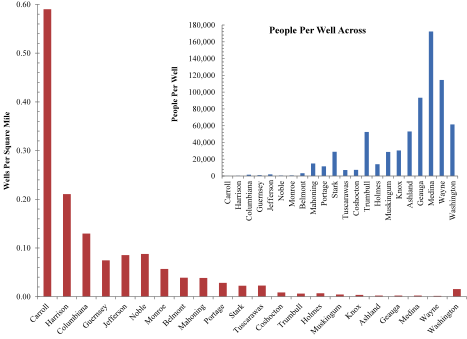
The average number of people per Utica well across the aforementioned 22 counties is 31,808, while the average number of wells per square mile is 0.066. The range is quite broad for both variables ranging from 0.0018 wells per square mile in Wayne – home to the Wayne National Forest – to 0.59 wells per square mile in Carroll County, with the one recent Washington County well placing it 13th out of 22 counties. The inverse is the case for people per well with Medina County, home to the highest number of people relative to Utica well permits with 172,332 people per well (vs. 124-563 people per well in Carroll, Harrison, Noble, and Monroe counties). Since last we conducted this type of analysis in late January the valuation of Ohio’s major Utica players has actually increased by 11.7%. This is a particularly complex situation considering that Atlas Noble the owner of 6 Utica wells has actually gone private for a variety of reasons and Chesapeake Energy has ousted its CEO Aubrey McClendon due to “philosophical differences and a pending SEC investigation. Meanwhile, Wall Street-types:
… expect well results to vary greatly, given 2012 drilling activity across many fringe areas of the play. We believe weak results from other operators are likely to validate that Gulfport remains the most exposed operator. Source
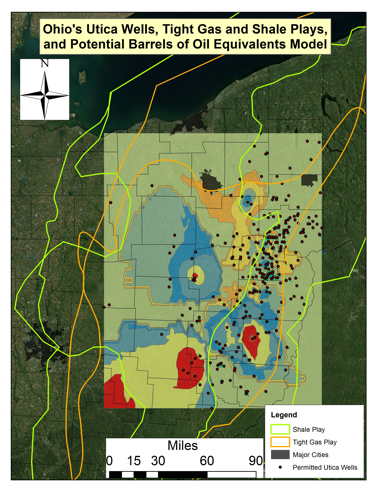
Additionally, the repeated delay in 2012 production numbers scheduled for the 1st of April is creating layer upon layer of uncertainty leaving everyone guessing and relying on 2011 production numbers. This leaves public sentiment worried about the unsustainability, uncoordinated, and unbalanced nature of both Ohio’s regulatory framework and highly Utica exposed and/or leveraged balance sheets. Meanwhile Wall Street analysts are contemplating whether market forces, expectations, reality, or collusion is to blame. Our current model of potential Utica production in the form of barrels of oil equivalent speaks to small and discrete highly productive zones in Belmont, Noble, Guernsey, Morgan, and Muskingum counties, rather than the originally estimated zones of highest production in Carroll and Columbiana. An additional hotspot appears to be located in Fairfield, Perry, and Hocking counties. However, due to insufficient data quantity, quality, and methodology, and transparency from ODNR and industry, the opportunities to conduct such exercises are still accompanied by substantial uncertainty in the form of high signal-to-noise resulting from scant and unreliable data. The hope, herein and on Wall Street, is that ODNR and industry will begin to make their production data available in real-time.
This is an especially important consideration given that the aforementioned regulatory environment here in Ohio – as well as the relatively generous severance taxing system[1] – has reached a point that even industry/supply-side think tanks like The Fraser Institute in Canada have determined “the extent of investment barriers (based on All-Inclusive Composite Index values)” are as good as they are ever going to get; Ohio trails only Mississippi in a global investment barrier ranking of 146 countries, US states, and Canadian provinces. Furthermore, in one year the conditions for doing largely hydrocarbon-related business in Ohio improved so much between 2010 and 2011 that Ohio jumped up the league tables from 12th to 2nd, according to the institute’s 2011 “Global Petroleum Survey.” This loosening of regulations, combined with decreasing data quality and availability, is the primary concern of The FracTracker Alliance in Ohio.
Figure 1: Utica Permit activity by status to April 1, 2013
Figure 2. Cumulative and Per Month Utica Permits to September 2010 through March 2013
Figure 3. Utica Permit Count by County from September 28, 2010 to April 1, 2013
Figure 4. Utica Permits Per Square Mile and People Per Well by County from September 28, 2010 to April 1, 2013
Figure 5. A map of the current Ohio Shale and Tight Gas Plays, hydraulic fracturing permits in Ohio as of 4/1/2013, and a generalized model of potential production from with light green representing 20 Barrels of Oil Equivalent (BOE) and red approximately 10,000 BOE
Table 1. Distribution of Ohio Utica Shale wells across companies (#, %), Date of First Permit (DFP), and the valuation of the publicly funded companies at their DFP at the close of business 4/9/2013.
Company Valuation
Company
#
%
DFP†
Share Price DFP
Share Price 4/9/2013
% Change
Anadarko•
12
0.019
09/07/2011
69.88
86.70
1.241
Antero
21
0.034
03/23/2012
Atlas Noble††
6
0.010
09/24/2012
31.14
Carrizo
2
0.003
07/26/2012
24.02
26.26
1.093
Chesapeake Energy•
389
0.626
12/23/2010
25.61
19.99
0.781
Chevron Appalachia
2
0.003
07/31/2012
109.58
118.71
1.083
Consol Energy•
25
0.040
06/17/2011
45.86
33.85
0.738
Devon Energy
13
0.021
11/02/2011
65.46
55.28
0.844
Eclipse Resources
1
0.002
12/21/2012
—
—
Enervest•
16
0.026
06/30/2011
9.37
8.79
0.938
EQT
3
0.005
09/13/2012
57.76
69.59
1.205
Gulfport Energy•
46
0.074
02/28/2012
35.49
48.09
1.355
Halcon
2
0.003
11/02/2012
5.003
7.69
1.537
Hall Drilling
1
0.002
09/17/2012
Hess Ohio
24
0.039
09/28/2010
53.63
73.50
1.371
HG Energy
16
0.026
09/14/2011
—
—
—
Hilcorp Energy
3
0.005
12/14/2012
—
—
—
Mountaineer Keystone
7
0.011
07/13/2012
—
—
—
PDC Energy•
9
0.014
05/25/2012
25.67
47.59
1.854
R E Gas Development•
13
0.021
03/19/2012
—
—
—
Sierra Resources
3
0.005
07/02/2012
—
—
—
SWEPI
1
0.002
06/20/2012
—
—
—
XTO Energy
5
0.008
04/09/2012
0.28
0.01
0.036
BP
1
0.002
03/20/2013
613
1.083
† DFP = Date of First Permit; “—“ not a publicly traded company
†† Atlas Noble has since gone private
• Corporations that have reported production numbers as of this post: 1) Anadarko – 3, 2) Chesapeake – 14, 3) Consol Energy – 1, 4) Enervest and PDC Energy – 2, 5) Gulfport – 10, R E Gas Development – 4.
[1] Ernst & Young in a 2011 report found that Ohio’s hydrocarbon taxing rates were the most favorable of the eight states they investigated with a total state and local tax of 1.8% vs. 10.9-11.0% in neighboring West Virginia and Oklahoma, respectively. The average across the seven other states was 9.2% or 5.12 times that of The Buckeye State.
https://www.fractracker.org/a5ej20sjfwe/wp-content/uploads/2025/09/2025-Wordmark-Logo.png00Ted Auch, PhDhttps://www.fractracker.org/a5ej20sjfwe/wp-content/uploads/2025/09/2025-Wordmark-Logo.pngTed Auch, PhD2013-04-23 16:19:202020-07-21 10:40:57A Year in the Life of Ohio’s Utica Play
Trout Unlimited (TU) is one of several organizations that are actively monitoring water quality in Pennsylvania’s rivers and streams. Currently, TU is collecting data in 99 different watersheds throughout the Commonwealth in an effort to help understand potential impacts of shale gas drilling and related industries on Pennsylvania’s waterways. Mitchell Blake, TU’s Pennsylvania Marcellus Shale Field Organizer explains:
Trout Unlimited’s Coldwater Conservation Corps (CCC) is a network of volunteer stream stewards who monitor water quality throughout the Commonwealth of Pennsylvania. With over 350 members trained, hailing from almost every Pennsylvania Trout Unlimited chapter, the CCC volunteers focus on achieving early detection of pollution events during oil and gas drilling and production activities and collecting a baseline inventory of data on important coldwater fisheries. Using a scientific tool that focuses on trout populations and forecasted Marcellus development, CCC volunteers strategically choose their monitoring locations within their chapter and report and map their data using Trout Unlimited’s water quality monitoring database. Protection of coldwater fisheries is an integral part of Trout Unlimited’s mission and more than any other segment of society, it is fisherman who spend considerable time on these streams, and thus are well positioned to watch over them.
While the data collection is ongoing, there are several logistical concerns involved with data digitization and distribution before the water quality data can be made available to the general public, but Mr. Blake is hopeful that these issues will be resolved in the coming months.
Watersheds where water quality testing is being conducted by TU volunteers are highlighted in green. For full access to map controls, please click the expanding arrows icon at the top right corner of the map.
At the FracTracker Alliance, we are excited to see TU’s desire to share this data with the public. It may seem like a thankless task to brave the elements to obtain baseline water quality data, but it is important work that everyone can benefit from. And while everyone hopes never to find the proverbial “smoking gun” in terms of streams being negatively impacted by industry, data collection efforts such as these are invaluable resources in identifying potential contamination events, should they occur.
https://www.fractracker.org/a5ej20sjfwe/wp-content/uploads/2025/09/2025-Wordmark-Logo.png00Matt Kelso, BAhttps://www.fractracker.org/a5ej20sjfwe/wp-content/uploads/2025/09/2025-Wordmark-Logo.pngMatt Kelso, BA2013-02-07 15:02:302020-07-21 10:40:41Trout Unlimited Testing for Water Quality in PA’s Marcellus Region
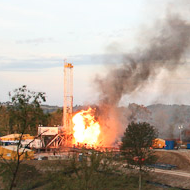
Fire on McDowell B well site near Wetzel County, WV. Burned for 9 days. (Sept. 2010) Wetzel County Action Group photo, copyright of Ed Wade, Jr.
By Samantha Malone, MPH, CPH – Manager of Science and Communications
While I am a full-time staff member of FracTracker Alliance, like many other people I wear several hats. One of these is as an academic researcher and doctorate student in environmental health at Pitt. My academic research focuses on unconventional natural gas extraction and its potential impacts on health. However, trying to conduct research in such a controversial arena can be frustrating – at best. Access to well pads, pipelines, or other industrial areas is limited for a variety of reasons in Pennsylvania. The opportunity to discuss concerns with workers and residents is stifled by fear, red tape, and/or the desire to protect precious assets. I don’t blame people for being cautious about with whom they speak, but I truly wish it were easier to get close to drilling activity in person, without putting anyone’s lives or jobs in danger. My lamenting on that very subject one day resulted in a colleague telling me about The West Virginia Host Farms Program, a grassroots project launched by volunteer home owners residing near drilling activity.
The purpose of the program is to provide environmental researchers and the media with the chance to conduct research or simply to photograph a well pad in person from the safety of an adjacent host farm. In short, the network of volunteers help to develop research partnerships to better understand the impacts of drilling. Diane Pitcock, the program’s administrator, recognized the need for this initiative a few years ago as a surface rights owner. In WV many people are in “split-estate” situations, meaning that most surface owners do not own the mineral rights beneath their land. This issue is compounded by the fact that most of the minerals in WV are owned by people that do not even live in state. As such, the people who own the surface rights feel that their homes and livelihoods in some cases are at risk – without the potential for financial reimbursement from the sale of the mineral rights below their land. The program aims to show people that unconventional drilling using hydraulic fracturing is not our grandfather’s gas extraction process, and it can’t be treated as such.
The project operates out of 14 West Virginia counties where drilling is most active. The network of volunteers has aided in academic research based out of several universities including Yale and Duke. The project has also hosted out of state reporters and even international photojournalists, people who possess platforms to advance the outreach and public education effort surrounding unconventional drilling. For example, Jolynn Minaar, who produced the documentary, Un*earthed, visited from South Africa in 2012 as part of her field work. Journalists from alternet.org and polidoc.com have been among the area’s many inquirers, as well. Even if you don’t plan on taking a tour of WV drilling sites, you can still benefit from the project’s extensive, online photo gallery (see image above).
Despite the controversial nature of shale gas drilling, the growing utilization of the program is surely a success story. Based on the WV Host Farms model, additional host farm networks are being coordinated in PA and OH as we speak. Engaging people who can volunteer 30-40 hours per week is no easy task, however. As more federal research like the US EPA’s hydraulic fracturing study begins to get off of the ground and into the well, perhaps even more people will support and recognize the value of such an integral, on-the-ground resource in the WV Host Farms Program. I know this researcher does!
For more information:
Diane L. Pitcock, Program Administrator
The WV Host Farms Program
P.O. Box 214, West Union, WV, 26456
304-873-3764
(e) wvhostfarms@yahoo.com
(w) www.wvhostfarms.org
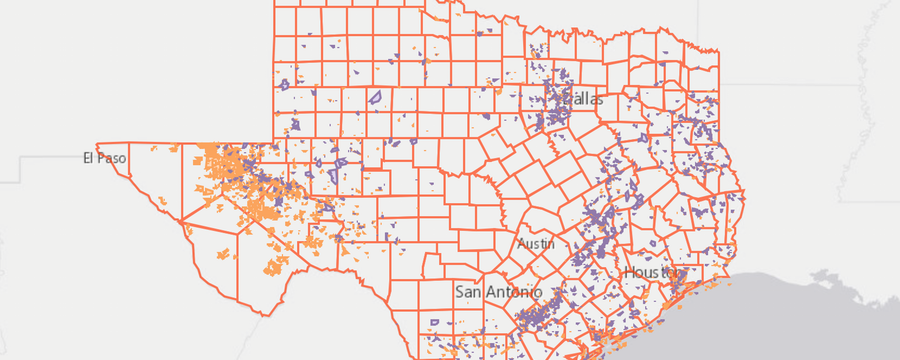
In the wacky world of oil and gas data, you never know what unexpected treasures there are to be found. For that matter, you never know what standard data will remain out of reach. Such is the story of the new Texas Lease and Pooling Agreements entry to FracMapper.
Texas Lease and Pooling Agreements. This map is zoomable and you can click on the map icons for more information. For full access to the FracMapper controls, click the expanding arrows icon in the top right corner.
In many states, even though lease data is technically publicly available, in practice, it is nearly impossible to obtain in a systematic fashion. Imagine searching through stacks of property files at county office buildings to see if there happens to be any mineral rights attached to a plot of land; this is the reason that lease data is so often not available in the way that oil and gas well data usually is. But in Texas, it’s easy: just go the the Texas General Land Office (GLO) website and download it. Not only that, but they have pooling agreement mapping data freely available as well.
On the other hand, the oil and gas well data is not up to the transparency and accessibility standards of other states. Although the agency that regulates that data, the Railroad Commission (RRC) of Texas, has a bevy of search tools available, notably missing from the results are the location data. As it turns out, the Lone Star State actually charges for that data, and a pretty penny too. Luckily, the RRC does provide a one county sample of the sort of data that one might get if they spent thousands of dollars on their data. This has allowed FracTracker to determine that the data purchase is decidedly not worthwhile. The oil and gas wells don’t even have complete well API numbers, let alone spud or permit issue dates.
Hopefully someday, the RRC will follow the data transparency model of the GLO, and not the other way around. A state funded by such a robust severance tax ought to be able to figure out a way to get this data out there for free.
https://www.fractracker.org/a5ej20sjfwe/wp-content/uploads/2012/12/TexasFeature.png400900Matt Kelso, BAhttps://www.fractracker.org/a5ej20sjfwe/wp-content/uploads/2025/09/2025-Wordmark-Logo.pngMatt Kelso, BA2012-12-26 17:26:562020-07-21 10:40:38Texas Lease and Pooling Data Available
Many people may have seen or are familiar with Gas Rush Stories, a series of short documentaries about natural gas drilling in Pennsylvania. According to the website, these stories are important to tell because “whether we live near a drilling site or downstream, whether we receive royalties or paychecks from a gas company, we are all impacted by this gas drilling in ways good and bad.” But how many of you know how Gas Rush Stories came to be? How many actually know the woman behind the curtain, Kirsi Jansa? If you have ever coordinated an event or been a speaker at one like I have, you have most certainly run into a wonderfully impassioned Finn standing behind her video equipment. Here is her Gas Rush Story…
A few weeks ago I sat down with Kirsi to get a better understanding of her work. Originally, I thought she was an extreme advocate against natural gas drilling, but like many other people with that perception, I was way off. Looking back, I don’t even know where I developed that idea about this energetic and passionate journalist. Kirsi has been covering environmental and public health issues for some time. A couple of years ago, she saw the need to develop a forum for people to share their experiences of this new industrial development in the northeastern United States. She sold the pilot idea as a project to the Finnish Broadcasting Company. The project eventually evolved into a series of documentaries on shale gas that presented various facets of the issue. She continues the project to this day and is looking for additional funding to develop an extension of the series called Rethinking Energy Stories.
It’s all who you know – and who you can access
Unfortunately, as those of us who work in this field know, the climate that surrounds unconventional natural gas drilling is tense at best. Kirsi has found it very difficult to access people with the true know-how. She says that the culture in the U.S. does not support bridging the gaps between industry, regulators, academia, and the public. (If you follow U.S. politics you will see this behavior mirrored in the inability or unwillingness of many politicians to work across party lines.) As a result of this barrier, many of her initial short videos showcase the negative aspects of drilling – partly because that is who agreed to speak publicly about it at the time and partly because that is where she saw the gaps in information being presented. Trouble accessing industry and regulatory experts only intensified when her stories were slammed as “advocacy-ridden.” Kirsi believes that her personal opinion on whether drilling should continue is irrelevant to the experiences being presented. “Even though I have concerns and critical questions, I want to you tell your story,” she relayed to me during our frank conversation. Through sheer persistence and fortitude, Kirsi later was able to cover other perspectives and issues such as frac fluid recycling with Reserved Environmental Services (RES), water management with engineering professor, Dr. Radisav Vidic, and even a short documentary in Germany.
In Need of a Transparent Dialogue
Kirsi feels that the lack of transparency inhibits true participation in the public dialogue regarding the nature of unconventional natural gas drilling. People need unbiased sources of information that allow them to develop their own opinions organically. The problem is that there seems to be no neutral party in this game, since all of us involved live and work in this economy. Unconventional natural gas extraction may offer many benefits (economic boosts, domestic energy production) but also many drawbacks (environmental spills and pollution, health risks). Through her stories, Kirsi hopes to highlight the need for us to listen to each other in order to develop a broader, more comprehensive picture of such a complicated issue.
https://www.fractracker.org/a5ej20sjfwe/wp-content/uploads/2012/12/interviewer.jpg195195FracTracker Alliancehttps://www.fractracker.org/a5ej20sjfwe/wp-content/uploads/2025/09/2025-Wordmark-Logo.pngFracTracker Alliance2012-12-04 17:24:542020-07-21 10:40:38A Tale of Two “Gas Rush Stories”
As summer transitioned into fall, and as winter knocks on our doorsteps in PA, I would like to take some time to summarize the preliminary feedback coming in through our pilot Trail Logbook Project. The project, for those of you who aren’t familiar, is a collaboration between Keystone Trails Association (KTA) and FracTracker Alliance. With the expansion of unconventional natural gas extraction into our state forests, we wanted to understand the experiences of people who are using those areas for recreation – and to document the change in those experiences as drilling continues. Most of the results of the project so far indicate that drilling is having a small, but notable effect on the traditionally tranquil experiences of hikers, bikers, and the like across the Commonwealth. The most common complaints are those of noise and degradation of scenery (see complete list ofLogbook reports below, or trail alerts on KTA’s website). Some people who entered information into the Logbook have noted that gas-drilling opponents have actually contributed to the degradation of the local scenery with graffiti and protest signs.
Given the number of hikers and other outdoor enthusiasts that frequent the Commonwealth every year, we need more people to report back to us in order to make a comprehensive and accurate statement about the overall impacts that drilling may be having on some of PA’s most beautiful natural resources. Perhaps there are no more issues to report, or perhaps people just don’t know who to tell. Regardless, we hope to expand our efforts to promote the project, which includes working with trail organizations in other states where shale gas activities may conflict with trail use.
On a side note, the lack of awareness about the Logbook and the state of drilling in popular recreation areas are key reasons why we are hosting a series of media tours this fall. The first was held on October 25th in Loyalsock State Forest due to the conerns of environmental concervation groups and residents about the communication barriers in existence between DCNR, the natural gas industry, and the public. If you are interested in participating in one of the next two tours, learn more here.
The full list of Logbook complaints to-date and the main areas impacted by unconventional natural gas extraction activity according to those reports are listed below:
Complaints from Logbook
Visual Degradation of Scenery
Anti-gas drilling graffiti
Flagging tape indicating seismic testing or road widening littered the area, called into question the “leave no trace” character of the trail
Intense construction activity and clearings for pipelines
Noise Pollution
Constant noise from compressor station
Helicopters
Construction and well pad noise
Safety
Seismic Testing: One hiker found 2 red wires with labels “Danger Explosives” portruding up from the ground
Seismic Testing: Equipment left right on the trail
Convenience
Trail relocation (4 miles)
Flagging tape caused confusion regarding the direction of trail
By Brook Lenker, Executive Director, and Samantha Malone, Manager of Science and Communications
It’s so quiet you can hear moss squish underfoot and the tapping of a woodpecker a quarter-mile distant. These are the sounds of a lesser-known Pennsylvania Wilds, the lush woodlands and rock-studded beauty of the Loyalsock State Forest. Picture a pristine landscape of ferny grottos, expansive bogs, and blueberries ripe for the picking. The squeaky-clean air seems hyper-enriched, a photosynthetic side-effect of stands thick with maple, birch, hemlock, and pine. Currents of endless streams race impatiently. Rattlesnakes shy but leery, lie and rest.
Across Lycoming and Sullivan counties, the shale gas industry is leaving its industrial footprint, from the iconic Pine Creek Valley through Tiagdaghton State Forest to the Loyalsock and environs. Yet while Williamsport booms from the infusion of gas, many of the hidden, ecologically-rich spaces of the Loyalsock – from Rock Run to Devil’s Elbow – still whisper.
According to the Pennsylvania Department of Conservation and Natural Resources (DCNR), of the 2.2 million acres in the state forest system, 675,000 acres are available for gas development. This includes 385,400 acres under Commonwealth-issued leases and 290,000 acres of where the agency doesn’t own the oil and gas rights. The latter scenario applies to 25,621 acres of the Loyalsock’s 114,494 acres where “severed” rights are owned by Anadarko Petroleum Corporation and International Development Corporation.
Circa July 2012, there is ample evidence of the changes on the horizon. The oranges and yellows of seismic testing equipment (photo left) adorn the sleepy forest roads and the electric pink of ribbon markers decorates the trees and ground. The few leased cabins look lost and lonely, but soon they could have the steady companionship of hundreds of trucks rumbling past their doors carrying water, sand, and some not-so-benign chemicals and waste fluids. The narrow, dirt roads – bound to require widening and repair – are probably inadequate for such intensive use and potentially treacherous for heavy rigs, occasionally known to roll down steep embankments and spill their secrets. Heavy traffic and structurally-degraded roads can cause significant sediment pollution as suggested by the studies of the Penn State Center for Dirt and Gravel Roads. Sediment is the enemy of native brook trout, our handsome state fish, who adamantly require cool, clear water to survive. Currently, there’s an abundance of such good water within Loyalsock.
But traffic and roadway impacts are but one piece of the shale gas puzzle. Could well casings fail and methane bubble into surface waters (recent accidents in Bradford County and Tioga County are suspected of causing just such problems)? How much will air quality be degraded by diesel emissions from trucks, pumps, generators, drill rigs, and other equipment? How will floodlights and flaring affect star-packed skies or the incessant drone of compressor stations antagonize solitude? While off the beaten path, the forest sees its share of visitors, and recreational trails are a signature of the region. The 27-mile Old Logger’s Path (photo below) is a backpacker’s dream crisscrossing a world of palpable wonders and subterranean severed rights.
Hiking, a popular recreation, and the forest’s quality scenery are big components of tourism, consistently one of Pennsylvania’s leading industries. According to the Pennsylvania Tourism Office, visitor spending across the Commonwealth totaled $34.2 billion in 2010. Comparatively, Penn State research (p.31) indicated that, “…the Marcellus gas industry increased Pennsylvania’s value added by $11.2 billon” for 2010. In the northeastern Pennsylvania, drilling is slowing due in part to the low price of natural gas. The ramifications for the Loyalsock are uncertain but the lasting attraction of idyllic open spaces is unequivocal.
Nevertheless, Anadarko and its partner seek the gas near the Old Loggers Path and vulnerable populations of forest interior birds. Such species require large unbroken tracts of contiguous forest. A recent study in Environmental Management authored by P.J. Drohan, Margaret Brittingham, and others reports that 26% of well pads in the Susquehanna basin are located in core forests (many on DCNR lands). The study quotes a DCNR paper: “further (shale gas) development on state forests is likely to alter the ecological integrity and wild character of state forests.” The authors believe other research supports that assertion.
The Loyalsock is a microcosm of the state forest-shale gas paradigm. As of a March 2012 DCNR presentation, 814 Marcellus well locations had been approved by the Bureau of Forestry on state forest land and 447 Marcellus wells had been drilled in the state forests including more than 80 well pads. The agency estimates a total of 3810 new Marcellus wells by 2018. With an average well pad size of about five acres, many miles of new and widened roads, even more miles of pipelines, plus intermittent water impoundments and compressor stations, it’s easy to wonder what our state forests will soon look like. And what about the legacy of silviculture cultivated by Pinchot, Rothrock, and other conservation pioneers? The Pennsylvania state forest system is certified by the Rainforest Alliance under Forest Stewardship Council standards ensuring that the products coming from these forests are managed in an environmentally-responsible manner. At what threshold of shale gas activity will this certification – which adds significant value to finished wood products – be jeopardized?
Since it is likely that Anadarko and its partner will pursue their claims, the fate of the severed parts of the Loyalsock may be shaped by the existence or lack-thereof of a surface use agreement between Anadarko and DCNR. Where DCNR has leased and controls oil and gas rights, a surface use agreement is entered into that steers the development activity in a more sustainable manner and away from especially sensitive forest features. In the case of severed rights, there is uncertainty about the applicability of surface use agreements. However, with little else to ameliorate the collateral damage of gas development in undeveloped surroundings, prudence would suggest it’s a tool worth using.
The stakes are high. DCNR’s own list of “challenges” posed by shale gas for state forest lands include: surface disturbance, forest fragmentation, habitat loss and species impacts, invasive plants, loss of wild character, recreation conflicts, water use and disposal. With the mission of the Bureau of Forestry to “ensure the long-term health, viability and productivity of the Commonwealth’s forests and to conserve native wild plants,” they have their work cut out for them, especially as more drilling tracts are developed.
In the months to come, the industry will be watched, technologies will change, activists will speak, parties will talk; meanwhile, the big, old rattlers, wise but weary, grow restless.
https://www.fractracker.org/a5ej20sjfwe/wp-content/uploads/2012/08/P1010321-scaled.jpg11251500FracTracker Alliancehttps://www.fractracker.org/a5ej20sjfwe/wp-content/uploads/2025/09/2025-Wordmark-Logo.pngFracTracker Alliance2012-08-31 17:49:462020-07-21 10:40:01Life and Times of Loyalsock
Following shale gas trends in the media can be a confusing task. One article, entitled Shale gas boom lifts W.Va. construction industry, discusses the positive impact that the gas industry has had on the construction industry in recent years. But it also includes the following quote:
“In 2011, there was so much demand and so much work and we participated in that. Now that demand has been somewhat faded and we need to move on,” said John Strickland, president of Maynard C. Smith Construction of Charleston. “Last year it just seemed like there was a lot of work to bid … the double edge sword was the work dried up.”
That makes it seem like the headline is more appropriate for 2011 than 2012.
And in a recent AP article titled Marcellus Shale becoming top US natural gas field, the authors discuss the explosion of the Marcellus Shale in recent years in comparison to declines in other prominent shale gas plays, such as the Haynesville. They note:
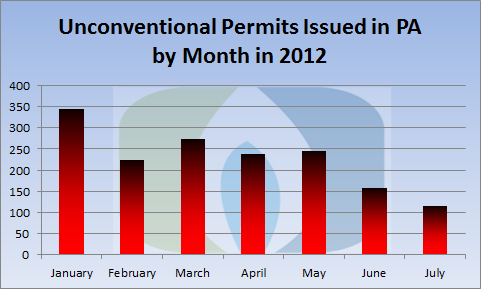
For now, it looks like the Marcellus region will be in the top production spot for several years, analysts say. While drilling has slowed, there were still 288 new well permits issued in May, and over 1,200 for the first five months of the year, according to data from LCI Energy Insight, an El Paso firm that tracks national energy trends.
I found this curious for two reasons. First of all, the PADEP only issues production reports twice a year, and the report for the first half of 2012 has not yet been released, making the timing of claim for the top spot in production somewhat dubious. On the other hand, permit data is issued nightly, and yet, the August 5 article chose to cite permit data from May. Knowing that unconventional activity has declined in recent months, that got me wanting to take a closer look. Here are the total number of permits issued for unconventional wells in Pennsylvania for the first seven months of 2012 (including permits for new wells as well as re-drills):
There were 229 fewer unconventional permits issued in Pennsylvania during July than there were in January, a difference of almost twice the number of July permits. In May, the month used in the quote above, there were 246 permits issued in Pennsylvania (the other 42 were presumably from West Virginia). Two months later, there were 130 fewer permits issued.
Here is what the data look like county by county. For any of the following maps, you can hide the overlaying menus by clicking on the gray compass rose and the double carat (^) tabs, and find out more information about each county by clicking on the blue “i” tool then the county of interest.
Unconventional permits issued in PA by county: January, 2012
Unconventional permits issued in PA by county: July, 2012
These first two maps are drawn with the same numeric scheme, even though no county reached either of the highest two categories in July.
Difference in unconventional permits issued in PA by county: July 2012 totals minus January 2012 totals
The color scheme here is designed to represent symmetry from zero, however the actual distribution is quite skewed. The biggest loss in permits from January to July was Bradford County with 62, while the biggest gain was 5 permits, seen in both Greene and Somerset Counties.
https://www.fractracker.org/a5ej20sjfwe/wp-content/uploads/2025/09/2025-Wordmark-Logo.png00Matt Kelso, BAhttps://www.fractracker.org/a5ej20sjfwe/wp-content/uploads/2025/09/2025-Wordmark-Logo.pngMatt Kelso, BA2012-08-07 11:50:282020-07-21 10:40:00Unconventional Permits Declining Sharply in PA
On Monday morning, a man was killed by an explosion at an oil well in Bolivar, Ohio. The man is believed to have been an employee working on the site, but his identity won’t be released until it is confirmed with dental records.
This wasn’t big news in Pittsburgh, even though Bolivar is just a two hour drive from here. But why not? Is it because the incident was across state lines, or because tragedies of this sort are actually fairly routine? The answer, I think, is “both”.
In yesterday’s Pipeline, the Post-Gazette reported on a story of President Obama talking energy policy in Cincinnati. This is hardly comparable, because the words of the President are routinely discussed in national and international media. The same is not true of accidents, even those leading to fatalities, unless the number of victims or the amount of property damage is exceptionally high.
I’m not suggesting that every incident that leads to a fatality is necessarily deserving of nationwide coverage, but in some cases, the model of regional coverage can keep people from realizing that dangerous patterns exist.
As I was trying to research the incident, I kept finding more and more of them, some of which I was already aware of, some of which I was not. Here are a few examples from the past two years:
A gas explosion occurred in Northeast Philly in Jan. 2011. A firefighter moves a hose line at the scene. (Steven M. Falk / Staff Photographer) (Joshua Mellman)
San Bruno, CA-September 9, 2010 A 30 inch pipeline exploded, killing eight, destroying 38 properties, and damaging many more. After checking several sources, I could not find a total number of injuries. The blast left a crater 167 feet long by 27 feet wide by 40 feet deep. PG&E blamed the 2010 blast on a strength test conducted on the pipe in 1956. Reporters covering the story initially thought the fireball might have been due to a plane crash.
Philadelphia, PA-January 18, 2011 A Philadelphia Gas Works employee was killed and five others were injured in this blast. The workers were trying to repair a broken gas main when a furnace glow plug ignited vapors inside a building. (Photo right)
Allentown, PA-February 10, 2011 Five were killed and about a dozen more were injured in a giant blast and fire that destroyed eight properties and damaged 47 others. As of this February, investigators were not close to explaining the cause of the explosion.
Hanoverton, OH-February 10, 2011 On the same night as the deadly Allentown blast, there was a pipeline explosion in this Ohio town. One building was damaged, but nobody was hurt in the explosion and subsequent fire that could be seen for miles.
Avella, PA-March 25, 2011 Three workers were hospitalized when storage tanks exploded and caught fire when a volatile vapor was somehow ignited at this natural gas well site.
Springville, PA No injuries were reported at this compressor station blast in northeastern Pennsylvania, but it blew a hole in the roof of the facility and was felt a half mile away.
Norphlet, AR-May 21, 2012Three workers were killed in this blast near El Dorado, Arkansas, which according to the US Chemical Safety Board (CSB), was set off while doing “hot” work such as welding or cutting in an area with hazardous vapors.
CSB Chairman Rafael Moure-Eraso said, “This unfortunate tragedy in Arkansas involving the deaths of three workers is the kind of hot work accident that occurs much too frequently. The CSB has investigated too many of these accidents which can be prevented by carefully monitoring for flammable vapor before and during hot work.”
This list is by no means comprehensive. In fact, after the incident in Allentown, Carl Weimer of the organization Pipeline Safety Trust was quoted in the USA Today:
Transporting natural gas by pipeline is the safest way to move that energy. Still, every nine or 10 days on average someone ends up dead or in the hospital from these pipelines. More needs to be done for safety.
And of course, pipelines are only one part of the problem.
https://www.fractracker.org/a5ej20sjfwe/wp-content/uploads/2013/07/Air.png190190Matt Kelso, BAhttps://www.fractracker.org/a5ej20sjfwe/wp-content/uploads/2025/09/2025-Wordmark-Logo.pngMatt Kelso, BA2012-07-18 22:57:572020-07-21 10:40:00Oil and Gas Explosions Are Fairly Common

 Wetzel County Action Group photo, copyright of Ed Wade, Jr.")