Our thoughts and opinions about gas extraction and related topics

The Devil’s Details about Radioisotopes and Other Toxic Contaminants in Marcellus Shale Flowback Fluids

and Their Appearance in Surface Water Sources and Threats to Recreationalists, Private Well Water Users, and Municipal Water Supplies

By Conrad Dan Volz, DrPH, MPH – Director, Center for Healthy Environments and Communities, University of Pittsburgh Graduate School of Public Health

In yesterday’s FracTracker post, CHEC’s data manager Matt Kelso told the tale of two stories regarding radionuclides in Marcellus Shale flowback water and in river water as sampled by the PA DEP. As he said “the devil is in the details” and here are the “devil’s details” that put both stories into their proper public health context.
There are without doubt higher levels of radioisotopes in Marcellus Shaleflowback fluids than in the fracking fluids, which are injected under highpressure to fracture the shale layer. And in general problems related tonaturally occurring radioisotope buildup in the oil and gas industry arewell documented. The following is a passage from my expert testimony in theMatter of Delaware River Basin Commission Consolidated AdministrativeAdjudicatory Hearing on Natural Gas Exploratory Wells; Filed November23, 2010:

Elevated concentrations of naturally occurring radioactive materials(NORM), including 238U, 232Th and their progeny, are found inunderground geologic deposits and are often encountered during drillingfor oil and gas deposits (Rajaretnam G, and Spitz HB., 2000). Drill cuttingsfrom the Marcellus may be enriched in radium radionuclides and off-gas the radioelement radon. Also, the activity levels and/or availability ofnaturally occurring radionuclides can be significantly altered by processesin the oil, gas and mineral mining industries (B. Heaton and J. Lambley,2000). Scales in drilling and process equipment may become enrichedin radionuclides producing technologically enhanced naturally occurringradioactive materials (TENORM). Exposure to TENORM in drillingequipment may exceed OSHA and other regulatory authority standardsfor the protection of both human and ecological health. The occurrenceof TENORM concentrated through anthropogenic processes in soils atoil and gas wells and facilities represents one of the most challengingissues facing the Canadian and US oil and gas industry today (Saint-Fortet al., 2007). The risk of contamination of surface water and ground waterby TENORM accompanies the risk of soil contamination, as TENORMgenerated may runoff of drilling equipment during rain events or if onthe soil surface into surface water sources and/or enter groundwater bytransport through the unsaturated zone.

In a review article in Environmental Science and Technology (ES&T),authors Karbo, Wilhelm and Campbell (EPA Region III leads and Office ofRadiation and Indoor Air) stated:

New York’s Department of Environmental Conservation (NYDEC) reportedthat thirteen samples of wastewater from Marcellus Shale gas extractioncontained levels of radium-226 (226Ra) as high as 267 times the safedisposal limit and thousands of times the limit safe for people to drink.The New York Department of Health (NYDOH) analyzed three MarcellusShale production brine samples and found elevated gross alpha, grossbeta, and 226Ra in the production brine. Devonian-age shales containnaturally occurring radioactive material (NORM), such as uranium (U)and thorium (Th) and their daughter products, 226Ra and 228Ra. TheMarcellus Shale is considered to have elevated levels of NORMs. NORMsthat have been concentrated or exposed to the accessible environmentas a result of human activities, such as mineral extraction, are defined bythe EPA as technologically enhanced NORM (TENORM). TENORM maybe concentrated because of (1) temperature and pressure changes duringoil and gas production, (2) 226Ra and 228Ra in produced waters reactingwith barium sulfate (BaSO4) to form a scale in well tubulars and surfaceequipment, (3) 226Ra and 228Ra occurring in sludge that accumulates inpits and tanks, and (4) NORM occurring as radon (Rn) gas in the naturalgas stream.

If this flowback-produced water with elevated TENORM is disposed ofin sewage treatment facilities or other ineffective wastewater disposalprocesses – then the TENORM level in surface water (the receiving streamor river) will be largely determined by dilution offered by fluid flows withinthe waste plant and dilution offered by the water flows themselves in theriver or stream.

So, it is entirely possible that Marcellus Shale flowback and produced fluids(yes I hesitate to call it water because it is contaminated fluid – with manyidentified toxic contaminants; if this were coming from other industries itwould be a hazardous liquid waste) will have elevated levels of TENORM and many other contaminants (see explanation in Appendix 1 below) butlevels of TENORM in the surface water it is going into will not exceedbackground levels, seen in the stream or river system, once it is completelymixed in the stream or river.

But here is the devil in the details as Matt said in his article.Recreationalists fish and boat around these outfalls (this is documentedby CHEC in the Allegheny River Stewardship Project and the PittsburghFish Consumption Project), and we have no idea of the levels of TENORM(or other contaminants) in receiving water near the outfalls before fullriver mixing occurs. Additionally we have no idea of the level of long term bioaccumulation of TENORM (and other contaminants) in fish and otheraquatic resources that may frequent or live in areas where this material isdisposed of in.

Concentrations of TENORM and the many other contaminants in the effluent from treatment of oil and gas flowback fluids will vary in receivingstreams and rivers according to the flow of water in the receiving streamor river and their concentrations in the flowback fluids. Therefore, levels ofTENORM in receiving streams and rivers will reach a peak (everything elsebeing equal) during times of low flow – such as a drought or long periodswithout rain or snowmelt – and peak levels will be higher in the surface waternear the outfall then downstream in the river after it is mixed completelywith water flow from the stream or river. The PA DEP river water samplesfor radium were not taken during periods of low flow but during the fallseason when rain was more plentiful. Furthermore, they were not taken near outfallsof plants accepting oil and gas waste fluids for treatment, before completemixing occurs—therefore, peak levels in these areas were not captured bytheir sampling plan.

Additionally, levels of TENORM (and other contaminants) from sewagetreatment plants and inefficient brine treatment plants will be higher inlow volume streams (such as 10 Mile Creek in Greene and WashingtonCounties and Blacklick Creek in Indiana County) than in large volume riversystems like the Monongahela River. We simply don’t know what levels ofTENORM are like at peak levels in low volume streams during periods oflow flow or in areas just downstream of effluent outfalls before completemixing takes place.

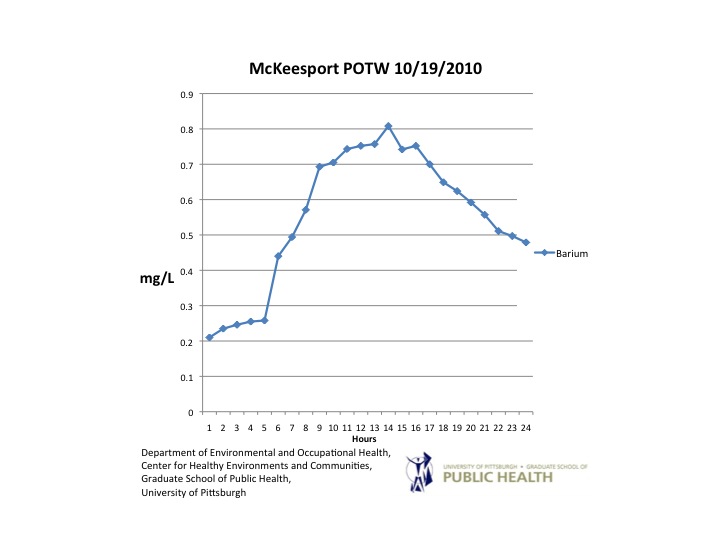
CHEC has data showing that levels of bromides, barium and strontiumexiting the McKeesport POTW (a sewage treatment plant) vary over a day’s sampling; they aredependent on when the slug of produced-flowback brine is introduced intothe system and the slug’s rate of entry into the treatment system. At theMcKeesport POTW, it is customary that the slug of oil and gas waste fluidis introduced into the treatment system at 7pm. One sees that the levels ofthese contaminants in outfall effluent raises sharply over a short period oftime and then falls back to baseline (See CHEC figures 1, 2 and 3), whenthe slug is through the system. Any TENORM, in the oil and gas waste fluidbeing treated, not taken out by the treatment system will reasonably followthe same pattern. That is it will come and go quickly and we have no ideaof peak levels of TENORM or any other contaminants in the stream or rivernear the treatment plant outfall.

What is the solution to all this? Are we to sample continuously – at alltreatment plant outfalls, in river and stream segments between treatmentplant outfalls and water intakes, at all water intakes and in all finisheddrinking water (and I might add in private well water systems that may pullin contaminants from nearby streams and rivers) across the entire areaMarcellus Shale waste fluids are being disposed of? (This would includePennsylvania, New York, Ohio, and West Virginia). This is exactly whatis necessary to be done to assure protection of drinking water supplies,recreationalists, and the health of aquatic resources if we continue to allowoil and gas flowback water to be disposed of in sewage treatment andinefficient brine treatment plants.

NO – this would be cost prohibitive and impractical to do on the scale thatis necessary to protect public health and aquatic resources. We must usethe precautionary principal here and insist that sewage treatment plants notaccept oil and gas wastewater, period. Batches of oil and gas wastewaterneed to be tested continuously for levels of TENORM and all other possiblecontaminants so that a determination can be made of where the fluids canbe adequately and safely disposed of. Fluids that are determined to behazardous and/or toxic should be transported only by certified haulers andloads need to be properly manifested so there is an accurate accounting ofthe volumes of waste and where it is being sent for ultimate treatment. Thetechnical capabilities and acceptance of brine fluids, of and by, oil and gaswaste fluid treatment facilities must be matched exactly to the realities oflevels of contaminants in the brine fluids.

The intent of the Resource Conservation and Recovery Act (RCRA) wasto ensure that there is a “cradle to grave” system to document, handleand dispose of all hazardous and toxic waste from all industries and evenmunicipal authorities in a safe and effective manner. RCRA is basically anextension of the environmental public health precautionary principal – andif implemented and enforced thoughtfully and comprehensively preventsthe formation of new Superfund sites and will assure that the publicand environmental receptors are protected from contaminants in oil andgas waste fluids- be they called flowback or produced water, or brine oranything else.

Figure 1, Time-plot of Barium concentration in effluent from the McKeesportPOTW, sampled beginning 10/19/2010. Hour 1 begins at 19:00 (7:00 PM).A sample was taken on the hour, every hour, for a period of 24 hours. (To zoom in, click on the image.)

Figure 2, Time-plot of Strontium concentration in effluent from the McKeesport POTW, sampled beginning 10/19/2010. Hour 1 begins at 19:00 (7:00 PM). A sample was taken on the hour, every hour, for a period of 24 hours. (To zoom in, click on the image.)


Figure 3
, Time-plot of bromides concentration in effluent from the McKeesport POTW, sampled beginning 10/19/2010. Hour 1 begins at 19:00 (7:00 PM). A sample was taken on the hour, every hour, for a period of 24 hours. (To zoom in, click on the image.)


Appendix 1, Background Information

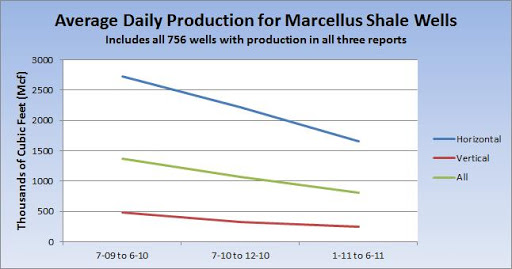
Hydraulic fracturing (HF) of shale gas deposits uses considerable masses of chemicals, for a variety of purposes to open and keep open pathways through which natural gas, oil and other production gases and liquids can flow to the well head. HF, also known as slick-water fracturing, introduces large volumes of amended water at high pressure into the gas bearing shale where it is in close contact with formation materials that are enriched in organic compounds, heavy metals and other elements, salts and radionuclides. Typically, about 1 million gallons and from 3-5 million gallons of amended water are needed to fracture a vertical well and horizontal well, respectively (Hayes, T; 2009, Vidic, R.; 2011). Fluids recovered from these wells can represent from 25% to 100% of the injected amended water solution (Vidic R., 2011) and are called “flowback” or “produced” water depending on the time period of their return.

Flowback and produced water contain high levels of total dissolved solids, chloride, heavy metals and elements as well as enriched levels of organic chemicals, bromide and radionuclides – in addition to the frac chemicals used to make the water slick-water. Levels of contaminants in flowback water generally increase with increasing time in contact with formation materials. There is abundant evidence that fluids recovered from this operation have high levels of total dissolved solids, barium and strontium, chlorides and bromides

While there is at present considerable scientific inquiry and even controversy regarding the potential of vertical or horizontal fracturing of shale gas reservoirs to contaminate shallow or confined groundwater aquifers (thus exposing municipal or private well water users to chemicals used in the hydrofracturing process and/or toxic elements, organic compounds, and radionuclides that exist in the formation materials); disposal of oil and gas wastewater/ Marcellus shale brine water in sewage treatment plants or inefficient brine wastewater treatment facilities is a direct exposure threat to public health through ingestion, inhalation and dermal absorption exposure pathways.

Two Tales of Radioactivity

There’s a disagreement brewing about whether or not there are radioactive materials in the Marcellus Shale wastewater. On February 26, 2011, Ian Urbina’s New York Times article reported:

Of more than 179 wells producing wastewater with high levels of radiation, at least 116 reported levels of radium or other radioactive materials 100 times as high as the levels set by federal drinking-water standards. At least 15 wells produced wastewater carrying more than 1,000 times the amount of radioactive elements considered acceptable.


Gross Alpha Particles. This map is based on the Pennsylvania wells which were reported to have high levels of radiation by the New York Times on February 26, 2011.  Please click the “i” icon and then one of the wells above for more information.  Please click the gray compass rose and double carat (^) to hide those menus.

On March 7, 2011, the Pennsylvania Department of Environmental Protection (DEP) issued a statement that would appear to contradict the New York Times data.  According to Acting DEP Secretary Michael Krancer, the situation is as follows:

We deal in facts based on sound science. Here are the facts: all samples were at or below background levels of radioactivity; and all samples showed levels below the federal drinking water standard for Radium 226 and 228.

Can Both Claims Be True?

Of the apparent discrepancy, the Marcellus Drilling News had this blunt proclamation:

It seems that The New York Times’ contention that Pennsylvania is poisoning waterways with radioactivity from Marcellus Shale wastewater was fiction and not science, as is now proven by test results from the Department of Environmental Protection (DEP).

But sound-byte media wars aside, there isn’t necessarily any discrepancy at all. As is usually the case, the devil is in the details.

First of all, it is important to understand that the two organizations are referencing entirely different datasets. More to the point, while the New York Times data is about the produced water itself, the DEP report tested river water. What’s more, in a follow-up article on March 7th, Mr. Urbina wrote:

The Times found that samples taken by the state in the Monongahela River — a source of drinking water for parts of Pittsburgh — came from a point upstream from the two sewage treatment plants on that river. The state has said those plants are still accepting significant quantities of drilling waste.

Because that sampling site is upstream, the discharges from those two plants are not captured by the state’s monitoring plans.

With this perspective, the Marcellus Drilling News’ harsh words come across as misguided. While the DEP statement seems to have been carefully worded to give the illusion of countering the claims raised by Mr. Urbina’s article, in fact, it does no such thing.

CHEC’s Perspective

In Mr. Urbina’s March 7th article, Center for Healthy Environments and Communities (CHEC)(1) Director Conrad Volz, DrPH, MPH said:

As long as we are going to allow oil and gas wastewater to enter these streams, there needs to be monitoring weekly at least for a whole host of contaminants, including radium, barium, strontium.

According to Mr. Urbina’s March 7th Times article, the United States Environmental Protection Agency (EPA) seems to agree with this cautionary approach, requiring tests for radioactivity at water intake plants, as well as a call to check for compliance at the facilities that are handling the wastewater.

This seems like a prudent approach. If the DEP has legitimate issues with the February 26th New York Times data, it was not effectively countered by their March 7th statement. The best way to settle this dispute is through targeted data collection, which in this case means setting up an effective water quality testing strategy.

And isn’t that the sort of work that the Department of Environmental Protection and the Environmental Protection Agency should be doing anyway?

  1. CHEC manages the content for FracTracker, including this site, https://www.fractracker.org, and http://data.fractracker.org/

Hitting Close to Home – Gas Pad Fire in Avella, PA

By Samantha Malone, MPH, CPH – Communications Specialist, Center for Healthy Environments and Communities (CHEC), University of Pittsburgh Graduate School of Public Health (GSPH); Doctoral Student, GSPH

Shale Gas Violations near Avella, PA (small)
Natural gas industry violations since 2007.
Avella, PA can be found by clicking on the image
and then zooming in on the patch of violations
in the center of the map.
Map created using FracTracker’s DataTool.

On February 23, 2011 a section of a natural gas drilling site in Avella, PA caught fire. Luckily only three workers were injured, but the issue still hits close to home – literally. Avella is my hometown. This quiet, farming area is located roughly 35 miles southwest of Pittsburgh in Washington County, PA. (See the map to the right.) It has a large school district geographically, with a tiny population. Known primarily for its rolling hills, farmland, and a historic landsite called Meadowcroft, Avella very rarely makes the headlines in Pittsburgh. That very fact is what peaked my concern when a TV news program mentioned that an incident had occurred on a Chesapeake Energy well site there.

The PA Department of Environmental Protection is currently investigating the fire. Initial reports indicate that volatile vapors that escaped while workers were flow-testing (part of which involves separating the flowback fluid from the natural gas), ignited and then caught nearby tanks on fire.  Volatile vapors can include a number of constituents, such as propane and benzene, which is a known human carcinogen. While there is little evidence to suggest that water contamination occurred as a result of the accident (like the 2009 spill near Cross Creek lake), air quality was most definitely affected. The smell of chemicals burning during the fire was even reported by some nearby residents. Thankfully, based on witness and on-site reports, the cooperation between the various emergency responders meant that the fire only burned for about three hours.

On a side note, I find it interesting that Chesapeake immediately refuted reports that hydraulic fracturing was the cause of the fire. Hydraulic fracturing, a process that breaks apart the shale layer under the ground to release the gas, had apparently been completed on the site. However, the volatile vapors originated from condensate, a result of hydraulic fracturing. Semantics.

Video Update: 3/1/11

Data Accessibility and Usability Index

While anyone with a registered user account can put data up on FractTracker’s DataTool, sometimes finding and collecting relevant data in a usable form is more difficult than it should be. I have examined datasets from a wide variety of places (1) and agencies, and after encountering numerous issues, I have devised a grading scheme to reflect the quality of the data being distributed, to be known as the Data Accessibility and Usability Index (DAUI).

System

The DAUI considers variables in the following seven categories:

  • Accessibility (20 points): How easy is the data to obtain?
  • Usability (20 points): How much preparation is required to be able to analyze the data?
  • Completeness (15 points): Is there anything missing from the data that would interfere with analysis or mapping?
  • Metadata (15 points): Are the data column descriptions and data source information readily available?
  • Responsiveness (10 points): Has the agency been helpful with information requests? (2)
  • Accuracy (10 points): Are there errors in the data? (3)
  • Cost (10 points): Is the data free? (4)


Data Accessibility and Usability Index grading scheme, 100 total points. Scroll to the right to see additional categories.

Grading Examples

It is important to note that each grade given represents only one specific dataset at one point in time. On occasion, certain aspects of any given dataset are updated by the agency controlling the data, hopefully for the better.

One recent example is the Pennsylvania drilled wells (spuds) database. Until recently, this was published on HTML tables on a monthly basis, but 2011 data is now available in a single Excel file. In addition, this year’s wells have location information, which was missing from previous years data. Although PASDA maintains a list of about 125,000 oil and gas locations in the Commonwealth directly from the DEP, there were still thousands of wells that didn’t match in the years between 1998 and 2010.

Since the new dataset in Pennsylvania only covers 2011 wells so far, it is appropriate to grade both datasets separately. This will also serve as a functional example on how the DAUI works.


Grades for PA DEP’s Drilled Wells Dataset. Scroll to the right for additional grades and total scores.

As you can see, the two changes that they have made have bumped the PA DEP’s grade up from a D- to a solid A. And in fact, the D- might have been generous. Several of our DataTool users have suggested that there might be significant omissions in the older report, but I have never been able to conclusively establish that as a fact. If it is true, the Accuracy rating would fall from 10 to 0, leaving a total score of 50 for that database.

Let’s look at another example, Wells in Quebec near the St. Lawrence, published by Quebec’s bureau d’audiences publiques sur l’environnement. To get the data up on FracTracker, the data had to translated to English (not a demerit, just a step in the process), copied from the PDF file to Excel and pasted so that each column of data fit on one cell. Then the data could be distributed using the space (“ “) as a delimiter, at which point the cells needed to be manually aligned to allow for proper concatenation. Once all of that was done, it was necessary to change the location information from Degree Minute Second format to Decimal Degree to be able to map the data. Finally, the units of measure for depth were mixed, including both meters and feet, which should be consistent. In short, not a very satisfactory experience with the data. Here’s how it grades, based on that experience:


Grade for Quebec’s bureau d’audiences publiques sur l’environnement Wells in Quebec near the St. Lawrence dataset. Scroll to the right for more grades and total score.

Despite my frustrations with this data, the information is published on the agency’s website, appears to be complete, and is well explained. The issue of publishing this dataset on a PDF (which cannot directly be analyzed) was the main result for the agency’s C grade.

Here’s the grade for a dataset that I can’t post: The Railroad Commission (RRC) of Texas’ Newark East (Barnett Shale) gas wells.

Clearly, the RRC is in possession of a tremendous amount of data. You can click on the “Well log” link and see dozens of pages of scanned original documents. However, there are a couple of problems with this data which makes in unusable for FracTracker. First of all, there are over 8,000 records, but it is impossible to view more than 100 at a time. Those would have to be copied and pasted manually from the HTML tables. While that is possible to do, it isn’t worth the effort, because there is no location information. Knowing that they must be able to produce an Excel sheet with some basic data about their drilled wells, I contacted the RRC, and was told that what I wanted could be obtained…for a cost. In my opinion, the RRC is being stubborn on this. They have terrific data, and yet they do everything they can to be (politely) difficult. As I did not elect to purchase data at this time, I will only grade what is available online.


Grade for the Railroad Commission of Texas’ Newark East (Barnett Shale) Drilled Wells dataset. Scroll to the right for more grades and the total score.

Because they elected not to release the data upon request, the RRC earned a failing grade. Had the RRC simply created and sent the proper Excel file from their database, they might have earned 90 points on the DAUI. If they had decided that well location information was a basic thing that citizens might want to know, and posted a downloadable link on their website, they could have full marks. If the for-cost version of the data has everything that is desired, it would have a maximum score of 80, because it was not free and had to be requested.

These three examples show how the DAUI system works. In the near future, I will grade all relevant oil and gas datasets against the same metric. Hopefully, a comprehensive picture of the various agencies that control oil and gas data will emerge.

Scoring 100 points on the DAUI should be attainable, almost 100 percent of the time. If governmental agencies really do not have data on wells, permits, violations, and production, then they are failing their respective citizens, whose lives are affeted by the oil and gas industry, often quite profoundly. If the agencies that control the data simply are in the habit of making it difficult to access, then I must remain hopeful that they will be pressured to realize that is an unacceptable strategy for the 21st century.

  1. This list includes Pennsylvania, West Virginia, Ohio, Arkansas, Texas, Utah, North Dakota, New Mexico, Colorado, and Quebec. Not all of the datasets have been complete enough to post on FracTracker, a frustration which contributed significantly to the creation of this grading scheme.
  2. If no requests have been made regarding a given dataset, or if the data simply does not exist in a desired format, full credit should be given in this category.
  3. Accuracy issues can be very difficult to verify. Also, if certain data doesn’t exist, that is accounted for elsewhere. As with Responsiveness, the agency is afforded the benefit of the doubt here.
  4. I have seen numerous datasets available from state agencies that cost money, with costs ranging from about $10 to well over $1,000. This is often explained as “recovering costs” of data distribution. In my opinion, this is unacceptable. While maintaining accurate data is undoubtedly expensive, it is an obligation of the overseeing agency to do so, and making the data available to the public is really a minimal component of that process. If it is a genuine budgetary constraint, then the agency should merely charge more for permit fees, etc., so that they are adequately able to perform their job.

Total Petroleum Systems in the Appalachian Basin; Definitions, Datasets and Snapshots


Stakeholder Awareness and Knowledge are Prerequisites for Informed Decision-Making Regarding Oil and Gas Extraction

By Conrad Dan Volz, DrPH, MPH

Our New York consultant, Karen Edelstein, has recently put onto FracTracker’s DataTool a number ofdatasets regarding other potential oil and gas source rocks and formations in the AppalachianBasin. Most of the formations on which she has posted data are not being actively drilled andexploited; they, therefore, only represent future areas of interest for oil and gas companies.However, the Utica-Lower Paleozoic Total Petroleum System, (FracTracker Snapshot 1below), which is more extensive and thicker than the Marcellus and underlies the extentof the Marcellus Shale by 1800 ft in western New York State and 5000 ft in south-centralPennsylvania, has already shown an ability to support commercial production.
Since capitaland human infrastructure are already in place for the Marcellus shale extraction, such as pipelines, arrangements for water withdrawals for fracturing, lease agreements, drilling and fracture capacity, and arrangements for wastewater disposal and trucking, the Utica has infrastructure advantages that may allow its exploitation sooner than other Appalachian petroleum basins.Even areas of the Utica beyond the Marcellus, particularly in eastern Ohio and Ontario, Canada,have been drilled and assessed and appear capable of producing natural gas in commerciallyviable quantities.

Utica Shale-Lower Paleozoic TPS, Applachian Basin (small)
Fractracker Snapshot 1. The Utica Shale
Click on the image for a better view.

The Appalachian Basin covers New York,Pennsylvania, eastern Ohio, West Virginia, western Maryland, eastern Kentucky, westernVirginia, eastern Tennessee, northwestern Georgia, and northeastern Alabama (USGS). Appalachian landowners, mineral rights owners, citizens, communities, environmental organizations, and state and local government units should becomefamiliar with the geographic boundaries of Assessment Units making up Total PetroleumSystems (TPS). Horizontal drilling and hydrofracturing advances may open more of these petroleumsystems to commercial exploitation. Stakeholder awareness and information is critical to assurethat knowledge and thus power is equally distributed between industry, government, andcitizens for balanced decision-making concerning questions related to: whether the resource shouldbe tapped, how the resource will be extracted, and what economic and environmental policiesshould guide resource use.

The Total Petroleum System is used by the United States Geological Survey (USGS) in itsNational Assessment Project; an Assessment unit is the fundamental geologic unit for theevaluation of undiscovered oil and gas resources. The TPS is defined as thegeographic boundary of a known or postulated oil and or gas accumulation, which includes thesource rocks or formations, as well as a geologic interpretation of the essential elements andprocesses within the system that account for its source, generation, migration, accumulation,and trapping. The province geologist was required to defend the geologic boundaries andgeologic history of each TPS in a formal petroleum system review meeting.

The TPS within province 067, the Appalachian Basin, are listed below by TPS number and name. Each snapshot contains a more thorough description of the TPS once you click on it. FracTracker contains datasets for more assessment units within each TPS. Check back for additional articles on separate assessment units and maps.

Click on the images below for a better view.

Conasauga-Rome/Conasauga TPS, Applachian Basin  (small)
506701 – Conasauga-
Rome/Conasauga
Sevier-Knox/Trenton Total Petroleum System  (small)
506702 – Sevier-Knox/
Trenton
Carboniferous Coal Bed Gas Deposits (small)
506705 – Carboniferous Coal Bed
Gas Deposits
Pottsville Coal-Bed gas deposits, Appalachian Basin  (small)
506706 – Pottsville Coal-Bed
Gas – More Info
Utica Shale-Lower Paleozoic TPS, Applachian Basin (small)
506703 – Utica Shale-Lower
Paleozoic
Devonian Shale, Middle/Upper Paleozoic, Total Petroleum System, Appalachian Basin (small)
506704 – Devonian Shale,
Middle/Upper Paleozoic

The Devonian Shale-Middle and Upper Paleozoic TPS (shown above) includes the Marcellus Shale as well as other assessment units:

  • Northwestern Ohio Shale (NWOS) AU
  • Greater Big Sandy (GBS) AU
  • Siltstone And Shale (DSS) AU
  • Marcellus Shale AU
  • Catskill Sandstones and Siltstones AU
  • Berea Sandstone AU

This TPS is well described here.

The snapshot below shows the geographical extent of all Total Petroleum Basins in the Appalachian Basin and more in-depth information on the Devonian Shales. Click on the various buttons in the gray toolbar below the image to zoom and inspect this snapshot in closer detail:

Oil, Natural Gas, and Natural Gas Fluids Drilling and Production in the Inland United States Waters of the Great Lakes?


By: C. D. Volz, DrPH, MPH
Director and Principal Investigator of the Center for Healthy Environments and Communities

Is it possible that there will, in the future, be offshore oil and gas platforms in the Great Lakes regions of the United States? The answer is that it has already occurred in Lake Michigan and certainly could be radically expanded with new advances in directional drilling and hydrofracturing of unconventional oil and gas reserves. Oil and gas drilling in the Great Lakes was allowed by the State of Michigan but new drilling was subsequently banned by the state legislature. The issuance of new permits for new drilling in the Great Lakes was banned by the Energy Policy Act of 2005 (P.L. 109- 58, §386). Canadian law though permits onshore oil and gas drilling under the Great Lakes and offshore gas drilling in the Great Lakes (see Congressional Research Service Document, Drilling in the Great Lakes: Background and Issues, 2006.

The U.S. Geological Survey (USGS) completed an assessment of the undiscovered oil and gas potential of the U.S. portions of the Appalachian Basin and the Michigan Basin in 2002 and 2004, respectively The USGS has done an assessment of oil and gas reserves under US portions of the Great Lakes and reports mean levels of recoverable oil, natural gas, and natural gas liquids at 311.71 million barrels of oil (MMBO), 5,228.71 billion cubic feet of gas (BCFG) (equal to 5.228 trillion cubic feet of gas), and 121.68 million barrels of natural gas liquids (M MBNGL), respectively. There have been 8-eight petroleum systems identified underlying United States portions of the Great Lakes. These are the;

  1. Precambrian Nonesuch TPS
  2. Ordovi¬cian Foster TPS
  3. [Ordovician] Utica-Lower Paleozoic TPS
  4. Ordovician to Devonian Composite TPS
  5. Silurian Niagara/Salina TPS
  6. Devonian Antrim TPS
  7. Devonian Shale-Middle and Upper Paleozoic TPS
  8. Pennsylvanian Saginaw TPS.

Each of the above systems is named for the source rock(s) of that system and there is only one source rock for each of the listed systems except the Ordovician to Devonian Composite TPS, which is a composite petroleum system. The Ordovician to Devonian Composite TPS is made up of one or a combination of the following source rocks; the Ordovician Collingwood Shale, Devonian Detroit River Group, and the Devonian Antrim Shale. For more information, see the complete USGS fact sheet, Undiscovered Oil and Gas Resources Underlying the U.S. Portions of the Great Lakes, 2005, Fact Sheet 2006–3049, April 2006.


Extent of the Utica Shale Formation. Click on the gray compass rose to hide the legend.

This FracTracker snapshot of the extent of the Utica Shale shows that it underlays the major extent of Lake Erie and Lake Ontario in both United States and Canada territorial waters.

When Messages are in Opposition, Risk Communication Difficult

By Samantha Malone, MPH, CPH – Communications Specialist, Center for Healthy Environments and Communities of the University of Pittsburgh Graduate School of Public Health (GSPH); Doctoral Student, GSPH

Two reports were issued yesterday by credible sources regarding the safety of natural gas drilling in shale formations. The one was issued by the Pennsylvania Department of Environmental Protection (PA DEP) on the air emissions from natural gas operations. The other by the House Energy Commerce Committee focused on the use of diesel fuel in hydraulic fracturing fluid. While these reports do not contradict one another, they certainly do not contribute to an overall consensus on the public safety of shale gas extraction.

Report 1 – PA Department of Environmental Protection

The PA DEP’s report was based on a four-week air quality study that they conducted in northeastern PA near Marcellus Shale natural gas operations. This report states that the emission levels they surveyed would not constitute a health concern for nearby residents, acknowledging that the study’s purpose was not to address the cumulative impacts that could result from long term exposure.

Report 2 – House Energy and Commerce Committee

The Energy and Commerce Committee within the House of Representatives sent a letter to the Environmental Protection Agency’s Administrator, Lisa Jackson, stating that between ’05 and ’09 oil and gas companies injected over 32 million gallons of diesel fuel or hydraulic fracturing fluids containing diesel fuel in wells in 19 states. This letter noted that at no point in time were these companies officially permitted to use diesel fuel in the hydraulic fracturing process – citing the behavior as a violation of the Safe Drinking Water Act.

The Message

The intention for this post is not to debate whether air contamination is worse than ground or water pollution, whether one report is right/wrong, or to discuss how difficult it is to accurately measure air emissions when companies know when and where you are testing. The true intention of writing this is to stress that the opposing reports only stand to ‘muddy the water’ on America’s viewpoint of the issue. Risk communication is hard enough to do properly without such inconsistency. The fact that these – and many other credible sources – cannot agree on whether natural gas drilling poses an environmental or public health threat further demonstrates that additional, unbiased research should be conducted.

Tracking the Effects on Farms

By Samantha Malone, MPH, CPH – Communications Specialist, Center for Healthy Environments and Communities (CHEC), University of Pittsburgh Graduate School of Public Health (GSPH); and Doctorate of Public Health (DrPH) Student, GSPH

If done improperly (or in excess), shale gas drilling has the potential to contaminate ambient air, surface water, drinking water, and/or ground water. A healthy agricultural system relies upon all of those media in varying degrees.On any given day, I receive roughly 50 emails from people concerned about the effects of natural gas drilling. Check out this document as an example. The topics of conversation are incredibly diverse, and yet the discussion surrounding the effects that drilling may have on our local farms is occurring more and more frequently. One of the reasons for this ‘boom’ in concern about our farms, in my opinion, is that the scientific evidence that connects drilling and hydraulic fracturing to the potential contamination of the food supply is lacking – while the anecdotal evidence is not.

As a result, people have even begun to compile ‘evidence’ suggesting that drilling has affected local agriculture, or will. I believe this is a research issue of great importance, and would welcome suggestions of additional resources (either pro or con) from readers. What are the concerns or questions that people have, you might ask? In a very simplified nutshell:

  • How is the health of farm animals affected by industrial processes occurring nearby? (e.g. by accidentally drinking frac pond fluids or by the stress caused by noise pollution)
  • How will shale gas drilling and forced pooling affect farmers who are applying for or trying to keep their organic farm certifications?
  • Do the communities burdened with gas drilling truly ‘reap’ the rewards?
  • Will the royalties some farmers receive cause them to produce more or less food on their property? And as a result, will access to local and fresh foods improve or decline? (Of the many benefits, access to local, fresh foods improves health by minimizing truck traffic used to ship the products, reducing farming’s carbon footprint – which affects climate change, and providing access to seasonal foods so that consumers do not rely upon packaged, nutritionally deficient food.)
We are just beginning to understand the breadth and depth of this issue. Unfortunately, some effects caused by events today may not surface for years to come. That is a major challenge to epidemiology. We at CHEC, including many other organizations across the Marcellus Shale region, are working to conduct baseline and field research, identify areas of key concern, and prevent negative health and environmental consequences to the highest degree possible. If you are interested in learning more, please email us at chec@pitt.edu.Below is one snapshot created using FracTracker’s DataTool that highlights some of the issues raised by this new industry – and how it may affect our agricultural system:

Working with this map:

  • Minimize the legend by clicking on the button that looks like a compass.
  • Use the magnifying glasses on the left side of the gray toolbar to zoom in and out of the map.
  • You can pan the map to different regions by clicking on the image and dragging your cursor.
  • The “i” on the toolbar allows you to inspect a record (dot or colored area).
  • You can change the background of the map to show roads or a Google Earth view using the three boxes on the right side of the toolbar.
  • Clicking on the button with the arrows on the right-most edge of the toolbar will take you into FracTracker’s DataTool so that you can do more with the map, including share it!

Additional Resources

Vulnerable Populations and the Shale Gas Boom

What is a vulnerable population? For a term used so often, a clear definition from an authoritative source is surprisingly hard to come by. For example, the term has over 2.5 million Google hits, but no Wikipedia page. The National Institute of Health has almost 5,000 references, but the handful of pages that I looked at assumed the reader already knew the definition. In a sense, of course, it is fairly self-explanatory. The UCSF Center for Vulnerable Populations(CVP) tells us that they serve:

…populations for whom social conditions often conspire to both promote various chronic diseases and make their management more challenging.


OK, that makes sense, but from the perspective of someone trying to map the effects of the natural gas industry on vulnerable populations, the term is still hopelessly vague. Who exactly are we talking about, and where do we find them?

There are probably many groups that would qualify as a vulnerable population, but for this analysis, I have included hospitals and schools as a place to start, because those are the places where those who are already sick and children congregate, respectively (1). These groups unquestionably apply to the CVP definition, above.


Vulnerable populations and the Marcellus Shale gas industry. Click on the tabs with the gray compass rose and double carat (^) to hide those menus. Click on the “i” button and then one of the map icons for more information.

There’s a lot of information on that map, and, frankly, it is difficult to determine the proximity of problematic wells to these centers of vulnerable populations at this scale. For this reason, CHEC Director Dr. Volz made a series of regional snapshots, which can be found here.


  1. A fuller list might include parks, daycare facilities, nursing care facilities, etc.

How is PA handling shale gas wastewater?


Jim Riggio, plant manager for the Beaver Falls Municipal
Authority, shows a sample of solid materials removed from
the Beaver River during treatment Dec. 15 at his plant.

On January 3rd, Associated Press writer, David Caruso, criticized the efforts underway in Pennsylvania to protect surface waters from shale gas drilling wastewater – especially because in most other states the primary means of disposal is deep well injection.

On January 4th, both the Marcellus Shale Coalition (the industry’s PR group) and DEP Secretary John Hanger defended the Commonwealth’s actions and current regulations.

What do you think?

Do you want to know where shale gas wastewater is permitted to be disposed of into surface waters near you? Below is a snapshot that I made in August 2010 using FracTracker’s DataTool of the facilities within PA that are permitted to receive shale gas drilling wastewater:


To learn more about a particular site, click on the inspect button in the gray toolbar – the “i” – and then click on a red diamond. A white box will pop up. Within that box, click on “view” to see who operates these facilities and how much wastewater per day they are permitted to receive. (“MGD” stands for Million Gallons Per Day. “GPD” means Gallons Per Day.)

And finally, here are two blog posts written by CHEC staff about the challenges facing our surface waters – and potentially our health – as a result of both fresh water withdrawals and wasterwater disposal: