Whether you are coming to our website for the first time or are a regular consumer of our work, we hope our maps, data, stories, and photos are informative, insightful, and, occasionally, inspiring.
As 2015 closes, extraction impacts continue. While drilling has slowed in many areas, pipeline construction has accelerated and oil trains roll through our cities posing excruciating risk. Our activities – and those of the many brave groups fighting to protect their communities – remain critical. The urgency is amplified by the dire state of our climate and oceans, symptoms of fossil fuel dependency. FracTracker’s crucial role is to examine the exhaustive footprint and effects of extraction while illuminating better paths forward.
Our last name is Alliance – a word that can be defined as ‘pact.’ Our pact is with the people whose lives have been turned upside down and the advocates working nonstop for a sustainable future. It’s an Alliance for everyone who cherishes the common home we call Earth.
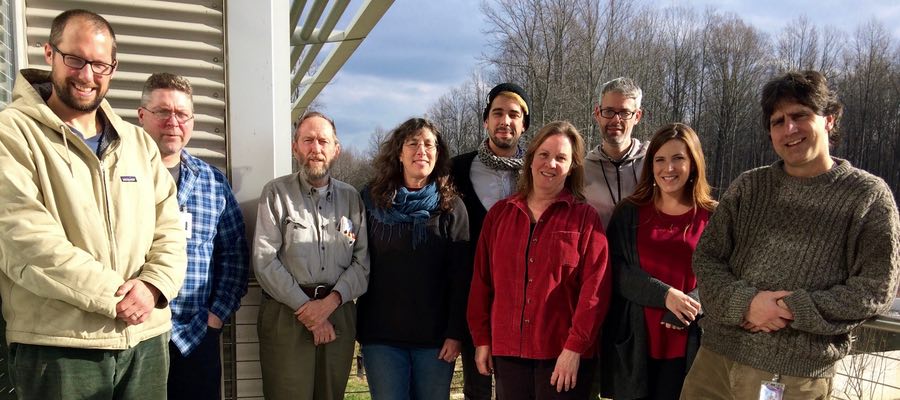
At this reflective time of year, we are thankful for all who take the time to learn about these heavy issues and exercise their concern. We’re grateful for cooperation and collegiality that strengthen our collective impact. We deeply appreciate the foundations and individuals who support us and enable our work, including the many patrons who attended our first-ever film night and fundraiser in September. At that event, we celebrated environmental heroes receiving community sentinel awards for their stewardship. What a difference committed people can make!
At this giving time of year, we ask you to consider a year-end contribution to the FracTracker Alliance. We ask this humbly, as we know there are many causes worthy of your support, including our sister organizations also addressing the energy and climate challenge. Every dollar helps so please give what you can, but do so knowing that your gift will be used smartly in service of our noble mission.
Kirk Jalbert, FracTracker’s Manager of Community Based Research & Engagement, interviews Craig Stevens, one of FracTracker’s 2015 Community Sentinels Award Winners.
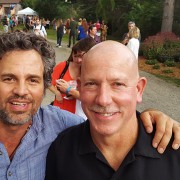
Craig Stevens (on right) with actor Mark Ruffalo
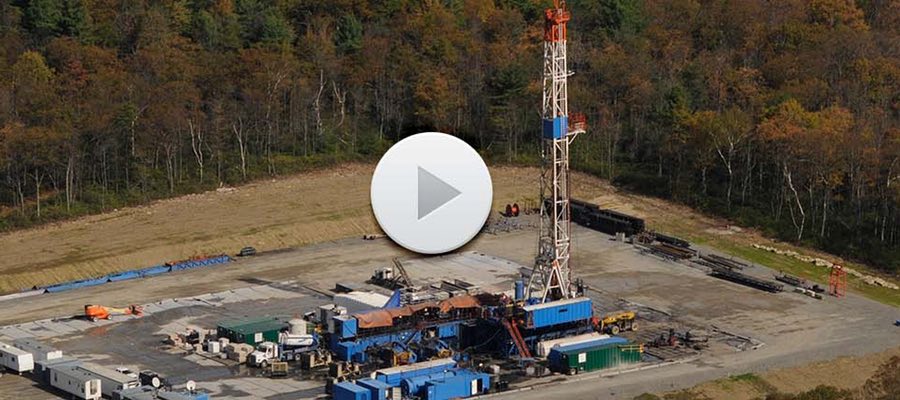
Craig Stevens is a 6th generation landowner from Silver Lake Township in Susquehanna County, Pennsylvania. Craig and his neighbors have experienced first-hand the truck traffic, noise, air pollution, and water contamination issues that often accompany shale gas extraction. Beginning in 2011 Craig began arranging tours of Susquehanna Co. to share affected residents’ stories with the press. This work has attracted citizens, journalists, elected officials, and celebrities from all over the world who now see Susquehanna Co. as an example of what could happen in their own backyards. We spoke with Craig about his work.
Q: Perhaps we can start by telling the readers your story, how you come back to Pennsylvania and how this led to your advocacy work related to oil and gas development?
Craig: Well, I was born in California in 1960, lived there for 46 years. Then my dad got sick in 2006; he was diagnosed with terminal esophageal cancer. My brother and sister and I ended up inheriting the ancestral 115-acre property. I had visited there my whole life, every couple of years, but I knew nothing about oil and gas or coal or any extraction methods and pretty much grew up at the beach in Southern California. Nobody in the family wanted to keep the family property, so I moved up here in January of 2010. The first thing I did was to check the deed to make sure that it had been transferred to our names. That’s when I found a gas lease for the property. On my father’s deathbed, he told us not to have anything to do with the industry, that he had refused to sign a lease. But then I did my research and found out Chesapeake Energy had signed my 95 year old grandmother, who was living in a nursing home, to a ten year oil and gas lease. My grandmother was a tenant but did not own the property. In Pennsylvania, and many other states, you can’t transfer mineral rights to anybody that’s a life tenant because that is part of a real estate deal. But they did it, they recorded it on our deed, tying up all of our mineral rights and giving it to Chesapeake Energy.
The second thing that got me fired up was when I was riding my three-wheeler and found a company had staked out a half-mile area right down the middle of our property. They were looking to put in a 16-inch pipeline without our permission or knowledge. So I pulled all the stakes out, went into town, and found the company. They right there offered me money. They said, well, we are going to put this in and we appreciate it if your family signed up, because we need to get this gas to market. After I refused their offer they told me all my neighbors had signed along the route already and I was going to be holding things up. Then they said, the state wants us here and they are going to give us Certificate of Public Convenience, so we are going to take your property either way. So that was my introduction to the gas industry.
Q: You have said in the past that we need to think about how we deal with shale gas extraction’s impacts as a matter of helping each other deal with civil and human rights abuses. Can you explain what you mean by that?
A: I was raised always to think globally, but act locally. Because everything that happens in our lives happens in our backyard and that is where things go. I was very politically active from a young age. My father got us all politically active. My older brother and my younger sister, at 10 years old, 8 years old, we were going to city council meetings and town council and county commission meetings, just because my dad was interested in what was going on in his community. Back then my neighbors in Dimock, PA, were having a problem. So I thought, I better find out what’s happening. Not only help them, because they are having a problem that doesn’t look like it’s resolved, but also to help prevent it from coming to Silver Lake Township. I always try to help people that are having a problem, especially with big people and bullies. So it was natural for me to stand with them and I started to tell my own story at the same time.
The Citizens’ Perspective
Q: Tell me about some of the projects you have been involved in that bring the public into shale gas debates. For instance, I know you organize regular tours of gas fields. Who attends these tours? What do you think they learn from visiting gas communities?
A: We’ve had 40 sitting assembly members and 8 state senators from New York State visit Susquehanna Co. We have had hundreds of mayors and town supervisors and country commissioners come and see first hand from a citizens’ perspective. We have had 60 countries come and send their public television stations. One of our tours was with Sean Lennon, Yoko Ono, Susan Sarandan, Arun Gandhi (Gandhi’s grandson) and Josh Fox. They had 35 journalists with them, including Rolling Stone. When they come we tell these people, also go take an industry tour, so they can see the other side. We encourage it because we don’t want them to think we are just bashing them and that they don’t get to defend themselves. Our thing was, if we highlight what is happening in our little neck of the woods then we could educate by showing the truth and affect the debate. Of course we were attacked viciously by the oil and gas industry, and by Energy in Depth, but also by the local elected officials that were pro-gas.
Q: This obviously requires a community effort. How have people and organizations in the area come together through these actions, and have they been able to develop more power by not just working as individuals?
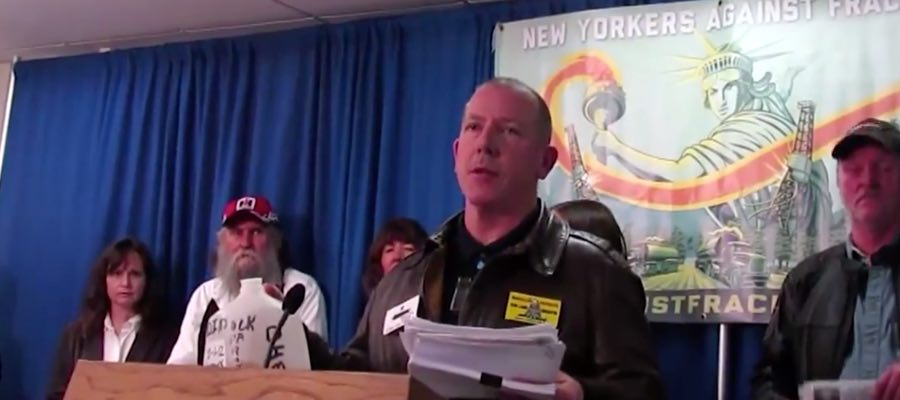
A: Well here is the interesting thing. When I moved here, there were about 50 people that would show up at public meetings to discuss their first-hand experiences. These were people from Dimock, PA, and other surrounding areas. Besides that, there really was no collective organizing in Northeastern Pennsylvania. But we found that, by telling our stories, we brought the interest of organizations like New Yorkers Against Fracking and Mark Ruffalo’s group, Water Defense. They started to adopt us. I and other families started to travel all over, not only in New York but also in New Jersey and Ohio, to educate people. I realized that I was meant to take these stories further out. I took them to all these State Houses — North Carolina, Florida, Maryland, New York, New Jersey, Ohio. In California I was allowed to go and sit with the Governor’s entire Cabinet in his executive office. I was very proud to go there since I grew up in California.
Q: In the bigger picture of protecting our environment, why do you think it’s important for concerned citizens to get involved in these kinds of activities?
A: I have four children who will not live on the same clean planet that I did; as dirty as we thought it was in the ‘60s and ‘70s when I grew up, this is going to make that look like the heyday of environmental cleanliness. I’m doing this because I really believe this is a generational suicide we’re experiencing. By not telling this story, I would be complicit. When people see the gas company’s commercials and hear the radio ads, it sounds like the truth because it’s coming from credible people. By facing up to these giants, and showing people that you can do it and win like in New York, that can start a grassroots fire all around the world. And that has happened if you look at what is happening in England and Poland and Spain and France and Germany. We are proud to be part of that movement.
Q: What would you say is the most valuable insight you have learned from working with people fighting the gas industry?
A: The most valuable lesson for me is that people power trumps corporate power. People sometimes just don’t realize that they have an inner strength – that an average person who knew nothing about this five and a half or six years ago can get involved and become leaders. I’m more excited today than ever. I went to Florida. They have some very bad chemical non-disclosure bills. Right now we have 15 counties and 35 cities in Florida that have passed resolutions for bans of fracking for oil or gas in Florida. Maryland is safe until October of 2017 because of their moratorium. So what we are doing is working. I try to remind people, and everyone out there should know this, that you are a federal citizen, the same you are a citizen of the state or Commonwealth or republic that you live in. You are protected constitutionally and legally as a federal taxpayer. So the federal government can’t just throw us to the wolves of these individual states. They have to act. If they don’t, then they need to step down and let somebody get in there that has the health and safety of their citizens at the top of their list of what they are supposed to be doing every day in their position of power.
https://www.fractracker.org/a5ej20sjfwe/wp-content/uploads/2015/12/Stevens-Sentinel.jpg400900FracTracker Alliancehttps://www.fractracker.org/a5ej20sjfwe/wp-content/uploads/2025/09/2025-Wordmark-Logo.pngFracTracker Alliance2015-12-11 12:35:542020-03-12 13:40:01Interview with Craig Stevens – Sentinel Award Winner
Kirk Jalbert, FracTracker’s Manager of Community Based Research & Engagement, interviews Dorina Hippauf, one of FracTracker’s 2015 Community Sentinels Award Winners.
Dorina Hippauf is the Chair of the Research Committee for the Gas Drilling Awareness Coalition (GDAC) of Luzerne County, Pennsylvania, and a contributing member of the Shale Justice Coalition. When a landman came knocking on her door in 2010, offering riches in exchange for a gas lease, Dory took the old saying of “if it sounds too good to be true, it probably isn’t” to heart. This was the starting point that led to her dedicated exploration of the industry’s practices and the creation of the Shale Players project, which now contains over 10,000 entries of who is connected to who in the industry. Dorina is one of three recipients of the 2015 FracTracker Community Sentinels Award. Here we talk with Dory about her work to connect the dots between board rooms, lobbyists, PR firms, astroturf organizations, and government agencies that promote the agendas of the gas industry.
Q: Dorina, perhaps we can begin by your telling me a bit about what brought you to advocacy work related to oil and gas development?
Dorina: What got me into the whole issue of gas drilling was, one, when I was driving to work, I would see flares on hillsides and I didn’t really understand what was going on. You know, there were big, large flames and my first thought was, something is on fire. Then I realized that from the way it was flaming, it was contained. But I still didn’t know what was going on. And then we had a land man come knock on our door and start offering us a lease. And we only have three quarters of an acre. Originally he was offering $1,000 an acre and when we said we only have three quarters of an acre, he dropped the price to $750. Everything just didn’t sound right. So I started doing some online investigating. I came across the GDAC, which is a local grassroots group in our area. I started attending meetings and I got involved from there.
The big driller here that was signing everybody up was Encana, which is of course based out of Canada. They did three test wells in our area. All three came up dry. Basically we are right at the edge of the productive end of the Marcellus Shale. Encana, shortly after they finished up the last test well, released everybody from their leases and left town in 2011. But I remained active with GDAC because I realized they have to get the gas to market. We’re located along the Transcontinental Pipeline, an ideal place for them to connect to gas hubs for gathering lines. So I knew the whole issue of gas drilling wasn’t going to be over with just Encana leaving our area.
Q: I know that one of the projects that you were instrumental in founding was the Shale Players project. Tell me more about that project, how it began, and what its status is presently?
A: I was at a GDAC meeting and somebody was talking about Encana and the question was asked, who is Encana? So I started Googling them and getting some information and this lead to other connections and I realized that just jotting things down on a piece of paper wasn’t going to give the whole picture. A lot of these companies are all interconnected one way or the other. I created this spreadsheet that grew into the Shale Players project. I have lists of the executives that work at these companies, the Board of Directors, politicians that are connected to them, other front groups, trade agencies, Astroturf, PR firms, and lobbying groups. It has grown to over 10,000 entries now.
Dorina explains Shale Players in her video “Connecting the Dots”
Q: How have you disseminated your findings and what are some of the results that you have seen come from this research?
A: Anyone who wants it, I give it to them. It’s also online on Google Docs. What I hope to do eventually is find someone that is able to put this into a format so it’s searchable online. So that when you type in somebody’s name or a company, it shows all of those connections. I update the online version every three or four months. As for what we’ve done with the results, the Public Accountability Initiative used it when they did their expose on Pennsylvania and gas drilling. Walter Brasch also cited a lot of my work in his book Fracking Pennsylvania. Other groups are using it because they go looking for information on a company that they may be dealing with.
Q: You also do a fair amount of blogging too, correct?
A: Yes, my blog is Frackorporation. When I blog, I usually try to show the connections to the genealogy of some of these organizations to give people a better idea of who they are really dealing with. So many people are looking for a single villain to blame. But it’s all interconnected. And that’s what I’m trying to show people, that this is more than just drilling and fracking and dealing with one company, it also extends to the whole issue of lobbying, the citizen united decision, and with unlimited donations to candidates. A lot of money gets passed around. Alec is involved, the Koch brothers are involved. A lot of big names.
Q: How do you think your work has made a difference in the public’s understanding of the political and economic landscape of the gas industry?
A: Well, to some extent, it discourages people because they see how large and involved it is. But on the other hand, it also makes them angry and they realize that you have to deal with this issue on a lot of different levels, both in terms of environmental impact, getting the community involved, and that its important to get involved politically. Also, it helps them to determine who to contact if they want to write a letter to a company. Too often we will just send it to the spokesperson who is just reading a script, but that is not whose attention you want to get. Also, the shareholders, they often don’t realize what the company is really doing. If you own one share of a company, you can go to their meetings and make a lot of noise.
Q: So this really is about building community and not just about collecting data. This relates to another project you are involved in called the Shale Justice Coalition. Can you tell me more about the Coalition?
A: The Shale Justice Coalition is a coalition of grassroots groups. Our overall objective is to stop the practice of fracking and to promote alternative energy as a better option. We have members in four or five in the states now as well as some from England and Ireland. Lots of information gets passed around as a result of the coalition — things that are going on in Ohio that we may not know about, things that are going on in New York — we try to share the information, get people interested and make them more aware of the bigger picture of the industry. Many of these groups will get a hold of me personally and ask me to write up a blog post about what is going on in their area. The media is not paying attention. With the Seneca Lake gas storage project there was some emails that were uncovered where Crestwood was telling its employees to boycott all businesses in the towns surrounding the lake that opposed the storage facility. Local groups had tried to get it to reporters who put it on the back burner and didn’t follow-up. I blogged about it, then it got picked up on social media, then the papers finally picked it up. Yeah, I mean, sometimes you have to rattle the cages.
Q: How has this work changed your perspective on the role of making information and data available to the public, in terms of making for better environmental protection?
A: It’s important to get this information out there, to make it readily accessible, easy for people to find and to use. I always thought when I first started this, that I could find one website where I could do a search on companies specifically for fracking and gas and oil drilling. But there wasn’t any. So in a way, with the Shale Players project, I’ve had to fill that niche. Also, a lot of the information I tend to find online I don’t know where they got their information. I take great pains to make sure whatever I put out there has the source link to it, so people can go and look for it themselves.
Q: So what is next for you Dory? What kind of new projects are you planning?
A: At the moment we are fighting the pipelines. I’ve been going around doing presentations at the request of organizations. Talking about what is going on with FERC and how the FERC process works. Letting people know what they need to be aware of the easement agreements and that they do have to negotiate. Just saying “no” to the easement and taking it to the point of imminent domain, if that is the course the company takes, isn’t enough. You have to show good faith and some attempt at negotiating an easement. Otherwise, when you go before the judge, he’s going to side with the company. Unfortunately, I think with these pipelines, unless we get more action from people, these pipelines are going to go through.
Truth-Out.org article by Dorina Hippauf and Ellen Cantarow
Q: Is there anything that you would communicate to other people and groups that are trying to get off the ground to deal with issues related to oil and gas?
A: Yes. One of the biggest things I keep hearing from people is that, when we have meetings or presentations or newspaper articles or whatever, we are only preaching to the choir. But what these groups have to realize is that the choir is growing. Every pipeline and every gas well sparks a new group of concerned people. So, the choir is growing and people are listening. It does get discouraging. It feels like you are losing at Whack-a-Mole. You are not going to get your cookies right now. And there is no one magic bullet that is going to fix everything. You have to deal with FERC, you have to deal with DEP, you have to deal with the government agencies that are involved. You have to consider who your legislators are. And you just can’t get discouraged. Take a break, stay off the computer for a week, recharge your batteries, and get back into it. You are in it for the long haul and you have to be able to make that commitment.
Q: Do you have any concluding thoughts for our readers?
A: People need to get local and be vocal. Tip O’Neil said, all politics are local and that is where it’s going to start. It’s like that movie, Groundswell. That’s grassroots. It starts from the bottom up to make real change. You can’t look at the federal government to fix it for you and the state government isn’t going to fix it either. You have to start locally and building the momentum there. And don’t give up.
https://www.fractracker.org/a5ej20sjfwe/wp-content/uploads/2015/04/Fracking-Most-Wanted-Feature1.jpg400900FracTracker Alliancehttps://www.fractracker.org/a5ej20sjfwe/wp-content/uploads/2025/09/2025-Wordmark-Logo.pngFracTracker Alliance2015-10-19 15:47:092020-03-12 13:45:26Interview with Dorina Hippauf – Sentinel Award Winner
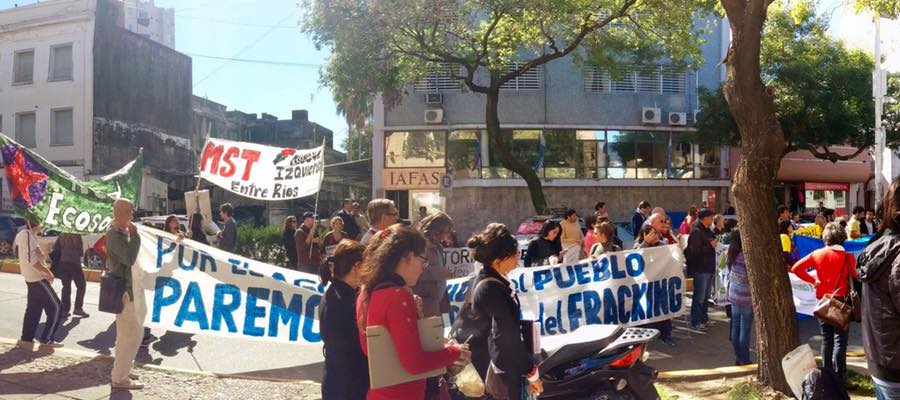
Few words fully capture the evocative resilience of Argentina where history is as turbulent as the winds of Patagonia. Fracking for oil and natural gas is a growing storm on the national horizon, and the effects will be fueled or mitigated by the ceaseless power of the Argentine people.
In the plains of Vaca Muerta, the forces collide. Democracy and calls for transparency meet big energy and nonresponsive government. Chevron has seduced YPF, the state-supported oil company, for a heavily-subsidized stake in the hydrocarbon riches. The shale play represents some of the largest oil and gas reserves in the world, proportional to the scale of concern about excessive use of water and its possible contamination; ranching and agriculture are the lifeblood of this drought-prone land. So much is at stake.
Our Energy Solutions in South America
FracTracker, Earthworks, and Ecologic Institute sent a delegation to Argentina and Uruguay from May 5 through the 12th as part of an outreach program called Our Energy Solutions made possible by our hosts’ generosity, foundation support, and last year’s Indiegogo campaign.
Eager audiences greeted our presentations about the American experience with unconventional oil and gas development and the promise of renewable energy. It was standing room only at a Senate forum in Buenos Aires and the offices of El Telegrafo in Paysandu. In Parana, we kicked-off a national conference about fracking and concluded our tour in San Rafael – a city on the northern fringe of the drilling boom. In total, we addressed more than 650 people, answering their concerns, cultivating their understanding of the perils of extraction, and sharing the opportunities for cleaner energy. Our ultimate reach was even greater, magnified by television and newspaper coverage and connections fostered with other organizations and institutions. The new relationships in South America may achieve unfathomable good.
With his Argentine roots, Pope Francis is a ubiquitous and revered figure across the country. He’s also a gentle global force calling on humanity to confront climate change and care for the earth. One of our unforgettable hosts, Juan Pablo Olsson, had been in Rome the week prior to meet with the pontiff and participate in an environmental conference at the Vatican. Inspired, Juan Pablo and other speakers cited the moral imperative of the issues we were communicating and shared this papal plea: “a humble and simple request to work together to defend the future of the planet.”
The call still resonates. Every day we are confronted by the acute harms of unrestrained extraction – from contamination of air and water to the violation of fundamental human and constitutional rights. The glaciers of Patagonia aren’t melting, they are crying – for a global demonstration of compassion.
Stay tuned for news in the fall from the next leg of this journey – Europe.
https://www.fractracker.org/a5ej20sjfwe/wp-content/uploads/2015/05/Argentina-Feature.jpg400900Guest Authorhttps://www.fractracker.org/a5ej20sjfwe/wp-content/uploads/2025/09/2025-Wordmark-Logo.pngGuest Author2015-05-29 10:00:362019-07-19 06:45:07A South American Crossroads
By Brook Lenker, Executive Director, FracTracker Alliance
While the year slows to a close, the FracTracker Alliance never stops. We churn out maps and analyses to enlighten America and the world about the impacts of unconventional energy extraction. Our work pays dividends: a website visitor discovers drilling nearby; a legislator learns about the industry’s rate of water consumption; data are synthesized for an organization making policy recommendations; students discover the true footprint of fracking. Day by day, we are nurturing a more positive energy future.
And our reputation as a trusted resource grows. Al Jazeera America recently featured our examination of the proximity of drilling near schools in California. Days earlier, Commissioner Martens of the NY DEC mentioned (at 57:00) FracTracker by name in a press conference announcing a ban on fracking in New York. These citations are affirming, but until the planet gets a respite from warming, communities liberated from threats to air and water, and nature conserved more than marred, we – and our many partners – have endless work to do.
These activities require time and money. We tip our hats to the funders who have made our efforts possible and welcome donations from those who believe in our mission. If you’re feeling inspired to make a year-end contribution, you can do it online. Thank you for your support!
A Bold 2015
FracTracker is thinking boldly for 2015 – exploring new topics, investigating local concerns, building more partnerships, encouraging citizen science (in part, through our mobile app), invigorating social media and communication tools, and reaching out to audiences near and far. In fact, we’ll be taking our findings on the road in 2015 – with workshops planned in Florida, North Carolina, Argentina, United Kingdom, Belgium, Poland, and Hungary – in addition to conducting outreach in the U.S. regions where we already operate. That’s just the beginning.
In anticipation of the challenges to come, and with gratitude for staff and board members, donors, researchers, brave organizations, nonstop advocates, and caring people coast to coast, a toast to you! May you all have a healthy, happy new year!
https://www.fractracker.org/a5ej20sjfwe/wp-content/uploads/2014/12/FracTracker2015.png400900Guest Authorhttps://www.fractracker.org/a5ej20sjfwe/wp-content/uploads/2025/09/2025-Wordmark-Logo.pngGuest Author2014-12-30 17:57:002020-07-21 10:34:10A Toast to the Tireless
By Brook Lenker, Executive Director, FracTracker Alliance
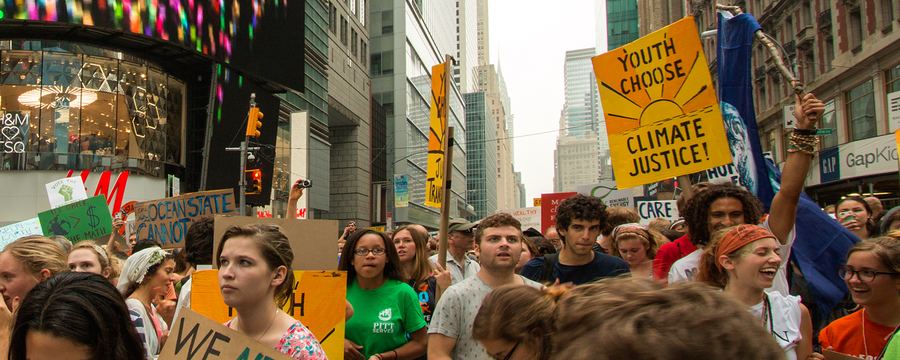
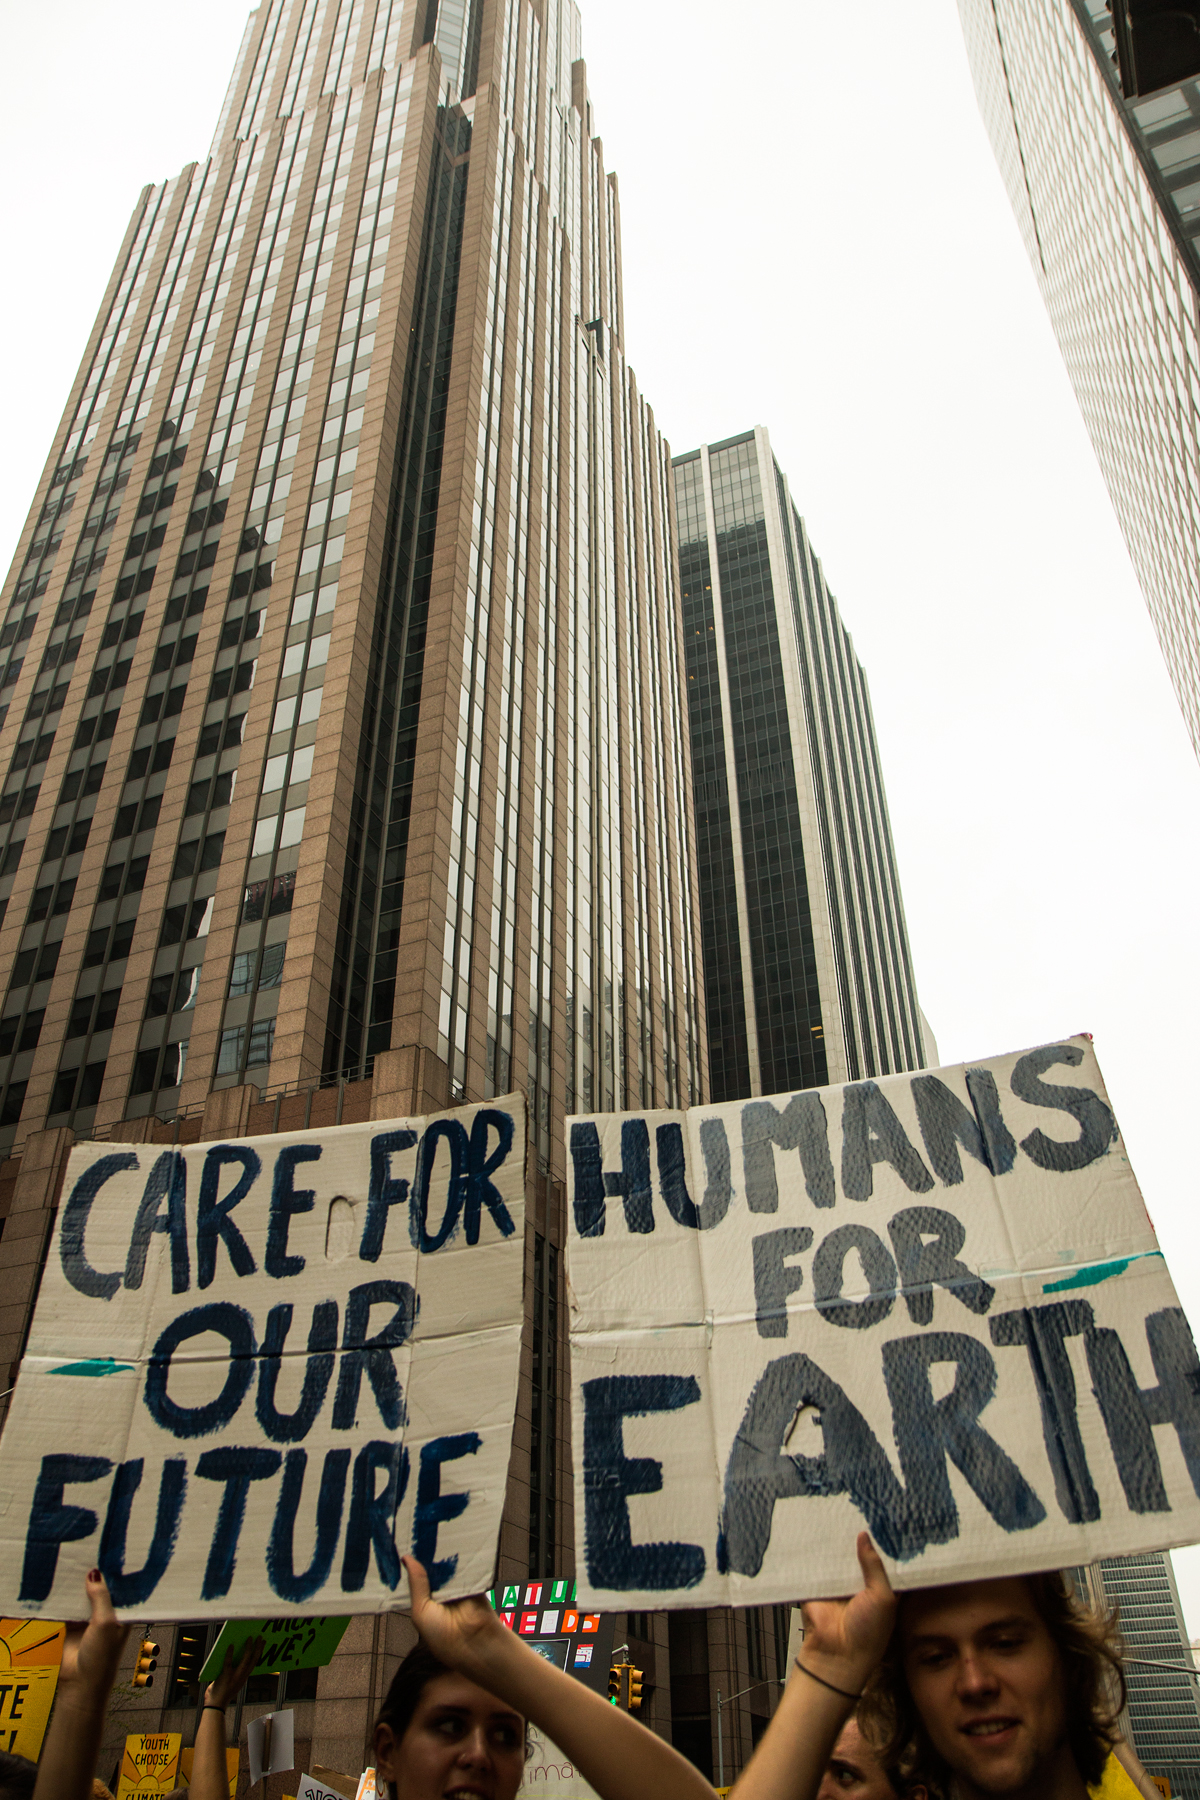
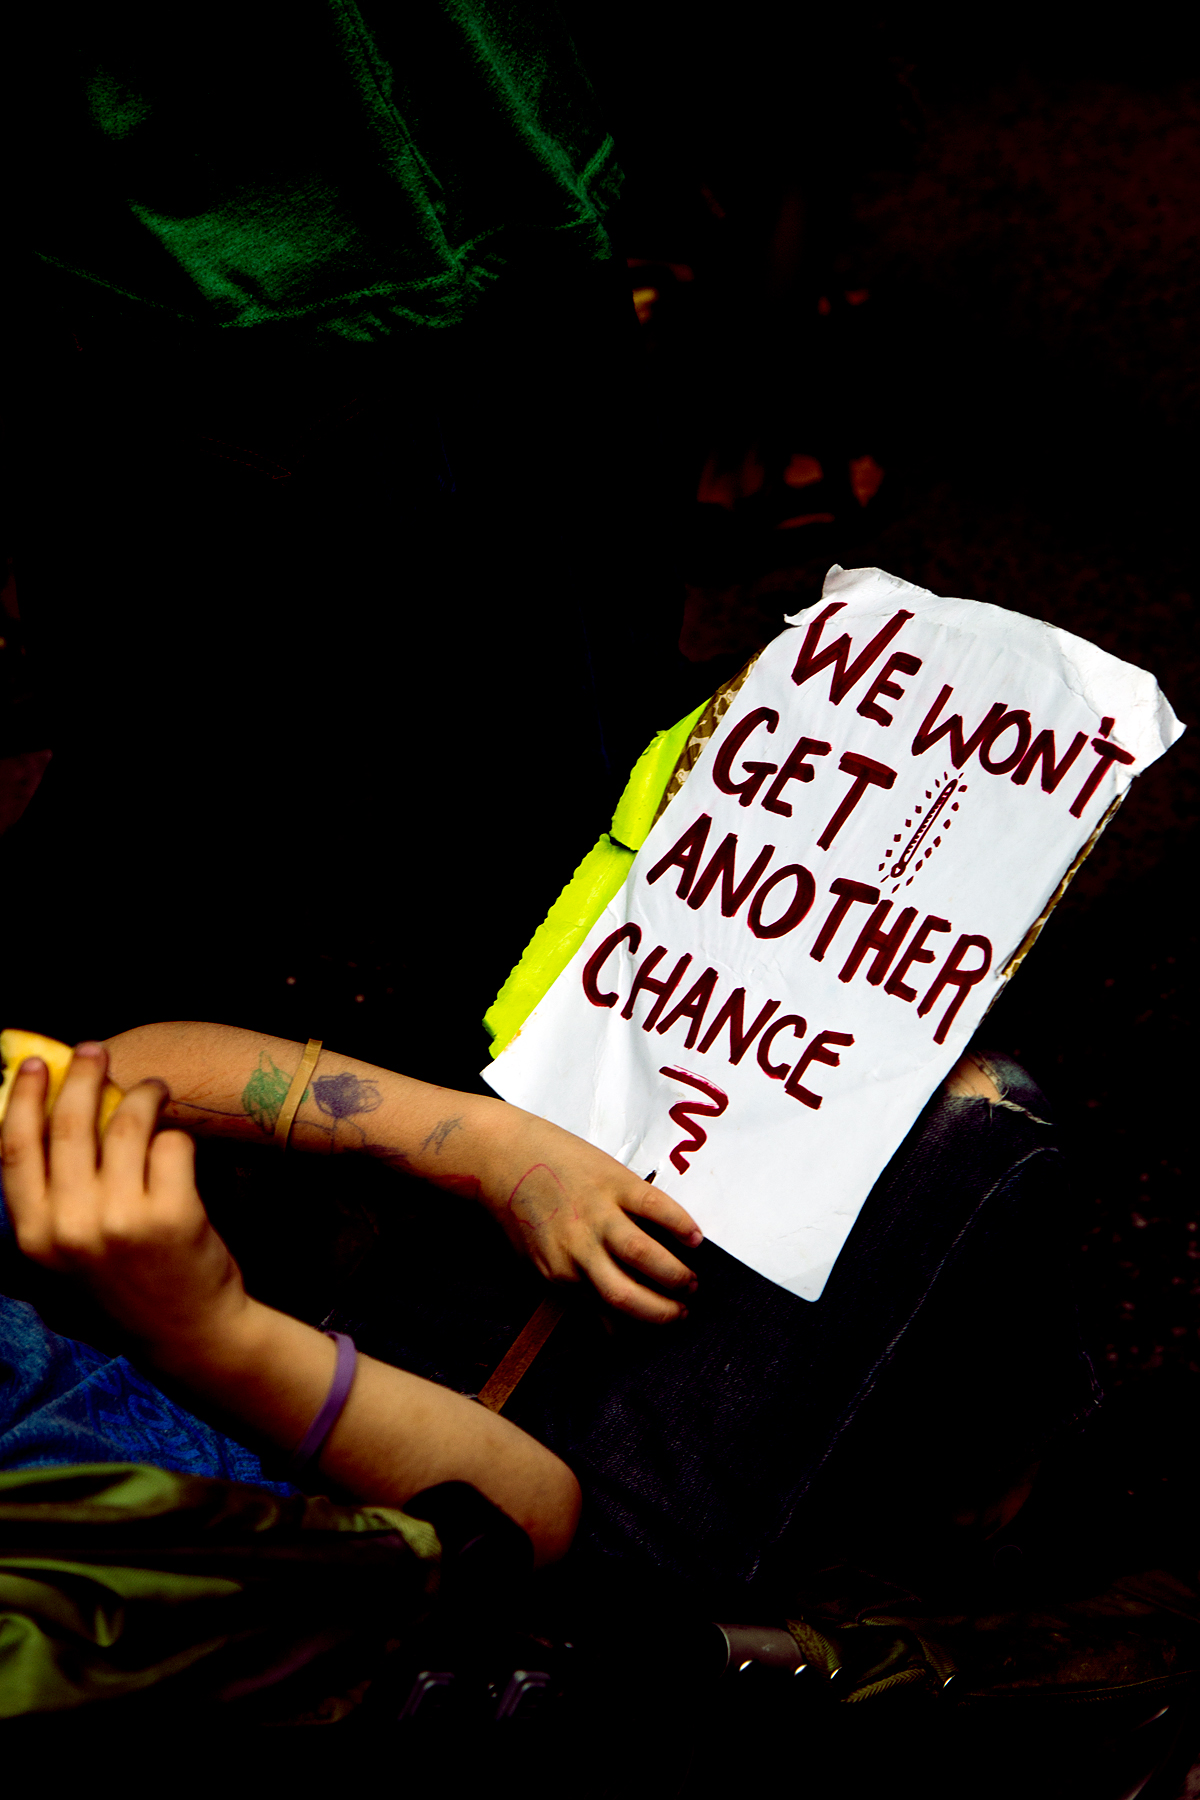
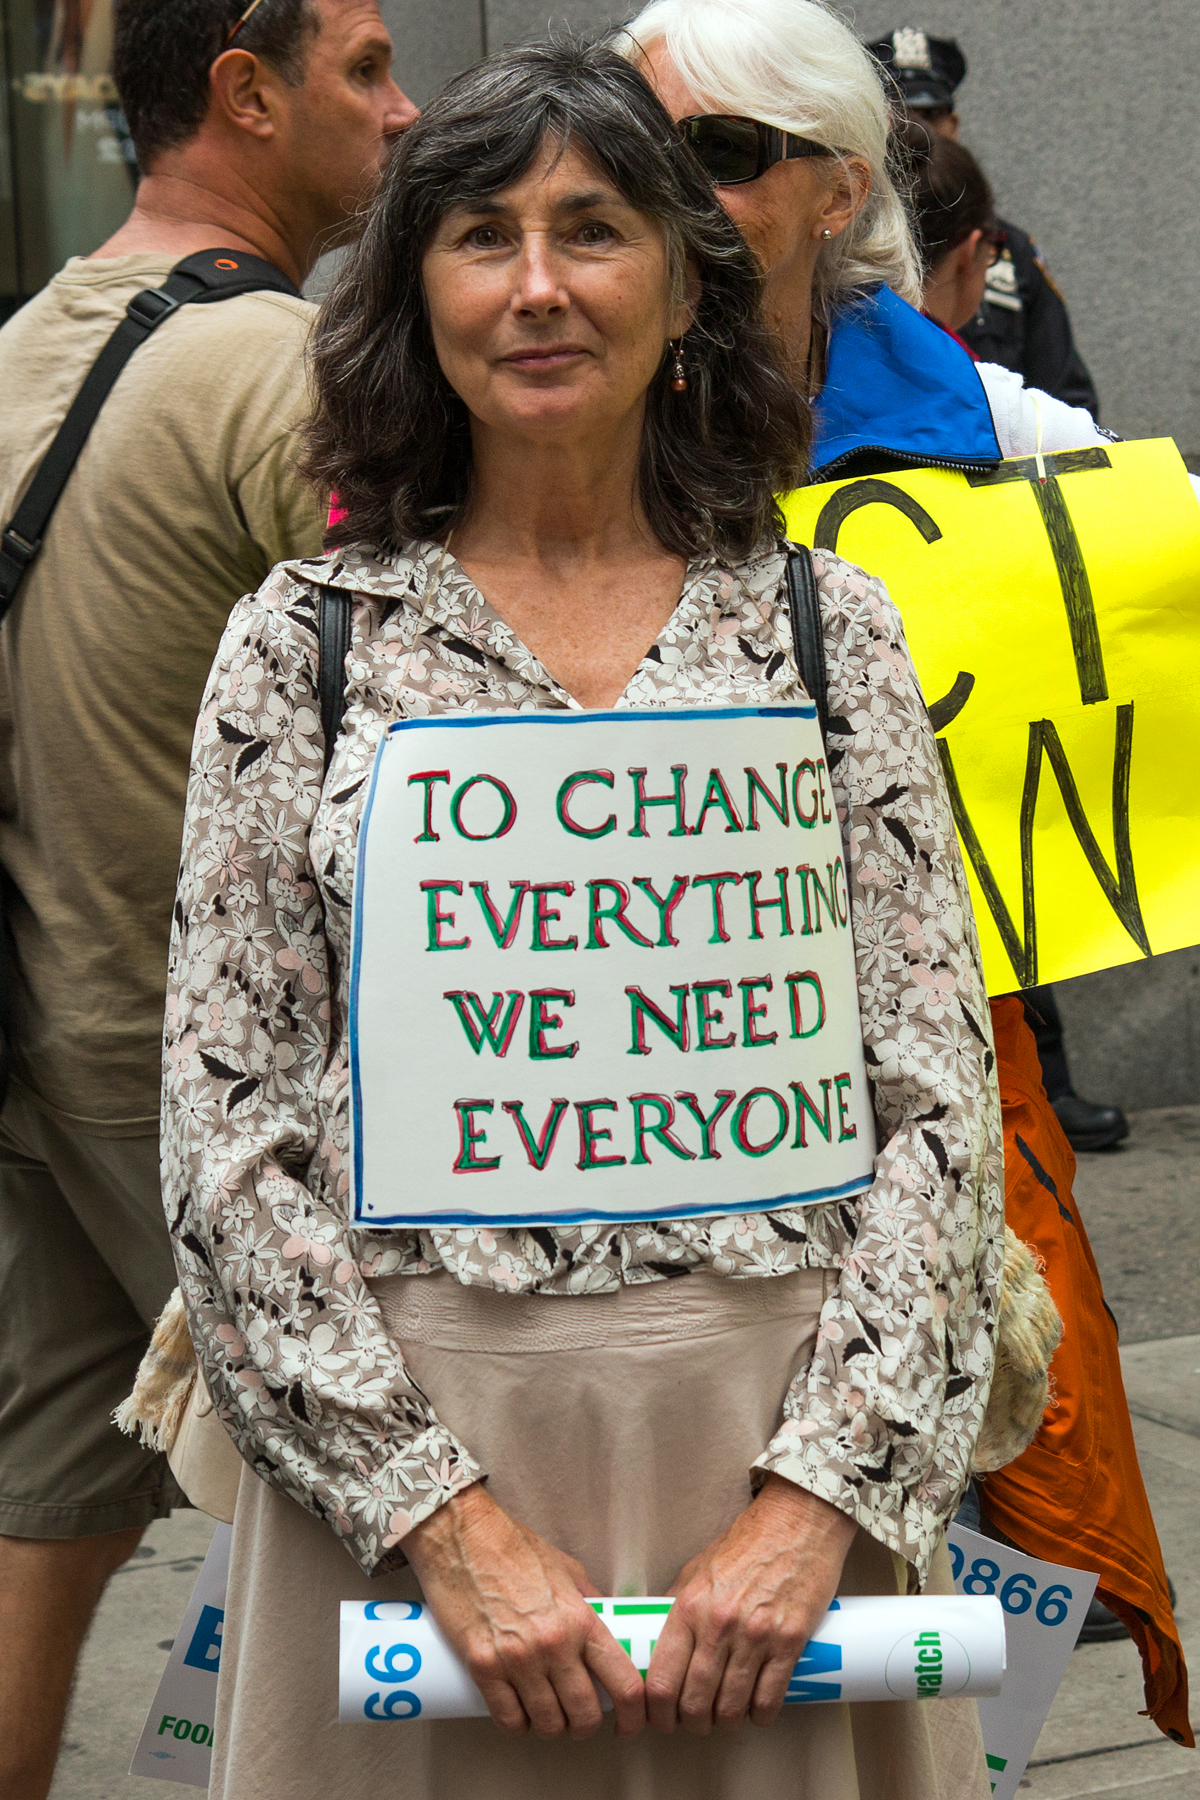
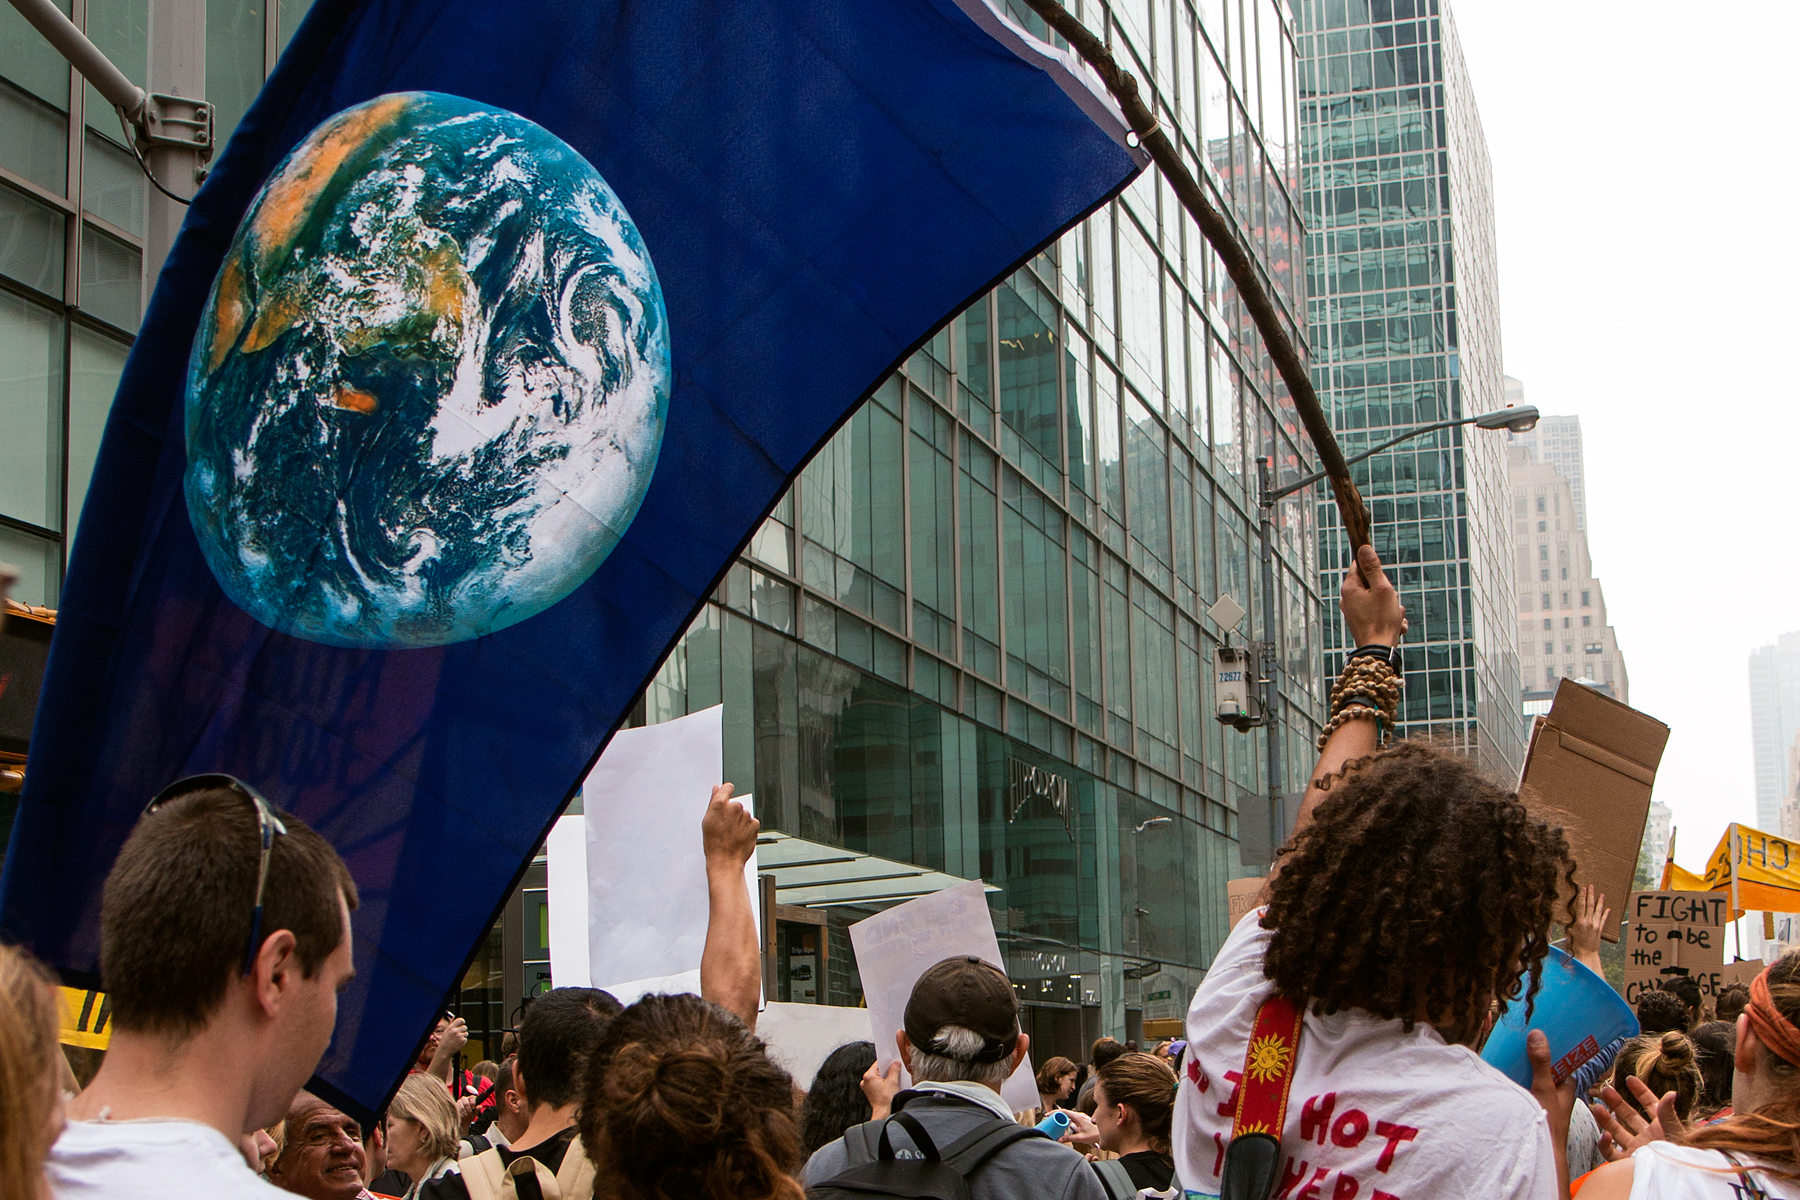
We came to make a stand. People of every age from every corner of the country amassed in New York City on September 21, 2014 – 400,000 people transported by hope. It may have been the autumnal equinox, but the event was a solstice of human expression and determination.
Down Central Park West, across 59th Street, south on Avenue of the Americas, onward to Times Square. Like the circuitous path of the people’s climate march, lawmakers and society at large have meandered around our fossil fuel dependency for too long but take notice: the era of wasting time and wasting away the planet is over.
You could see it in the eyes of college students, parents, grandparents, and children, and I could see it in my daughter, an unfrackable resolve, stronger than any geology. A man remarked that he hadn’t seen so many young people mobilized since the Vietnam War. It will take the involvement of many, many more to move institutions and the public beyond the status quo – to adopt better technologies, modify lifestyles, and accept wholesale conservation.
Images from the March. Photos by Savanna Lenker
I believe we’ve reached a tipping point with the atmosphere and mankind. The former may be hemorrhaging, getting worse before any sign of recuperation – and that’s downright frightening (from rampaging weather to rising seas, life on earth is in for a helluva ride). But the latter has found a partial cure: intergenerational power lifting and embracing renewable energy and lighter ways for civilization.
Change starts with humility and introspection and gains with peer support. In the one-day, peaceful occupation of midtown Manhattan, warm hearts of spectators and a world in solidarity pushed us ahead. Feel the inertia. Join the ride. Because going forward, nothing will be the same.
By Mary Ellen Cassidy, Community Outreach Coordinator, FracTracker Alliance
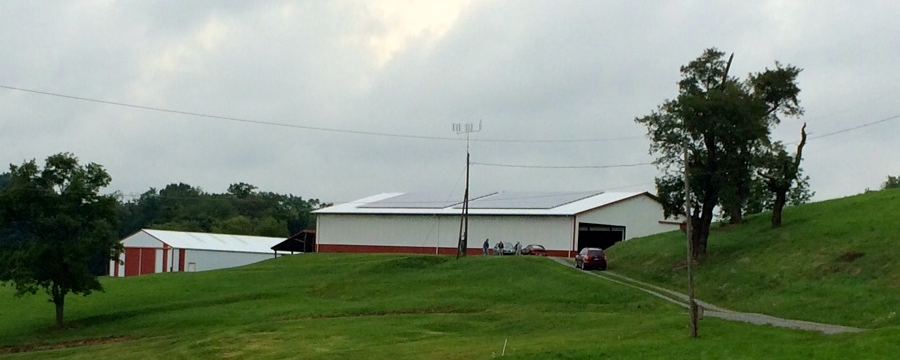
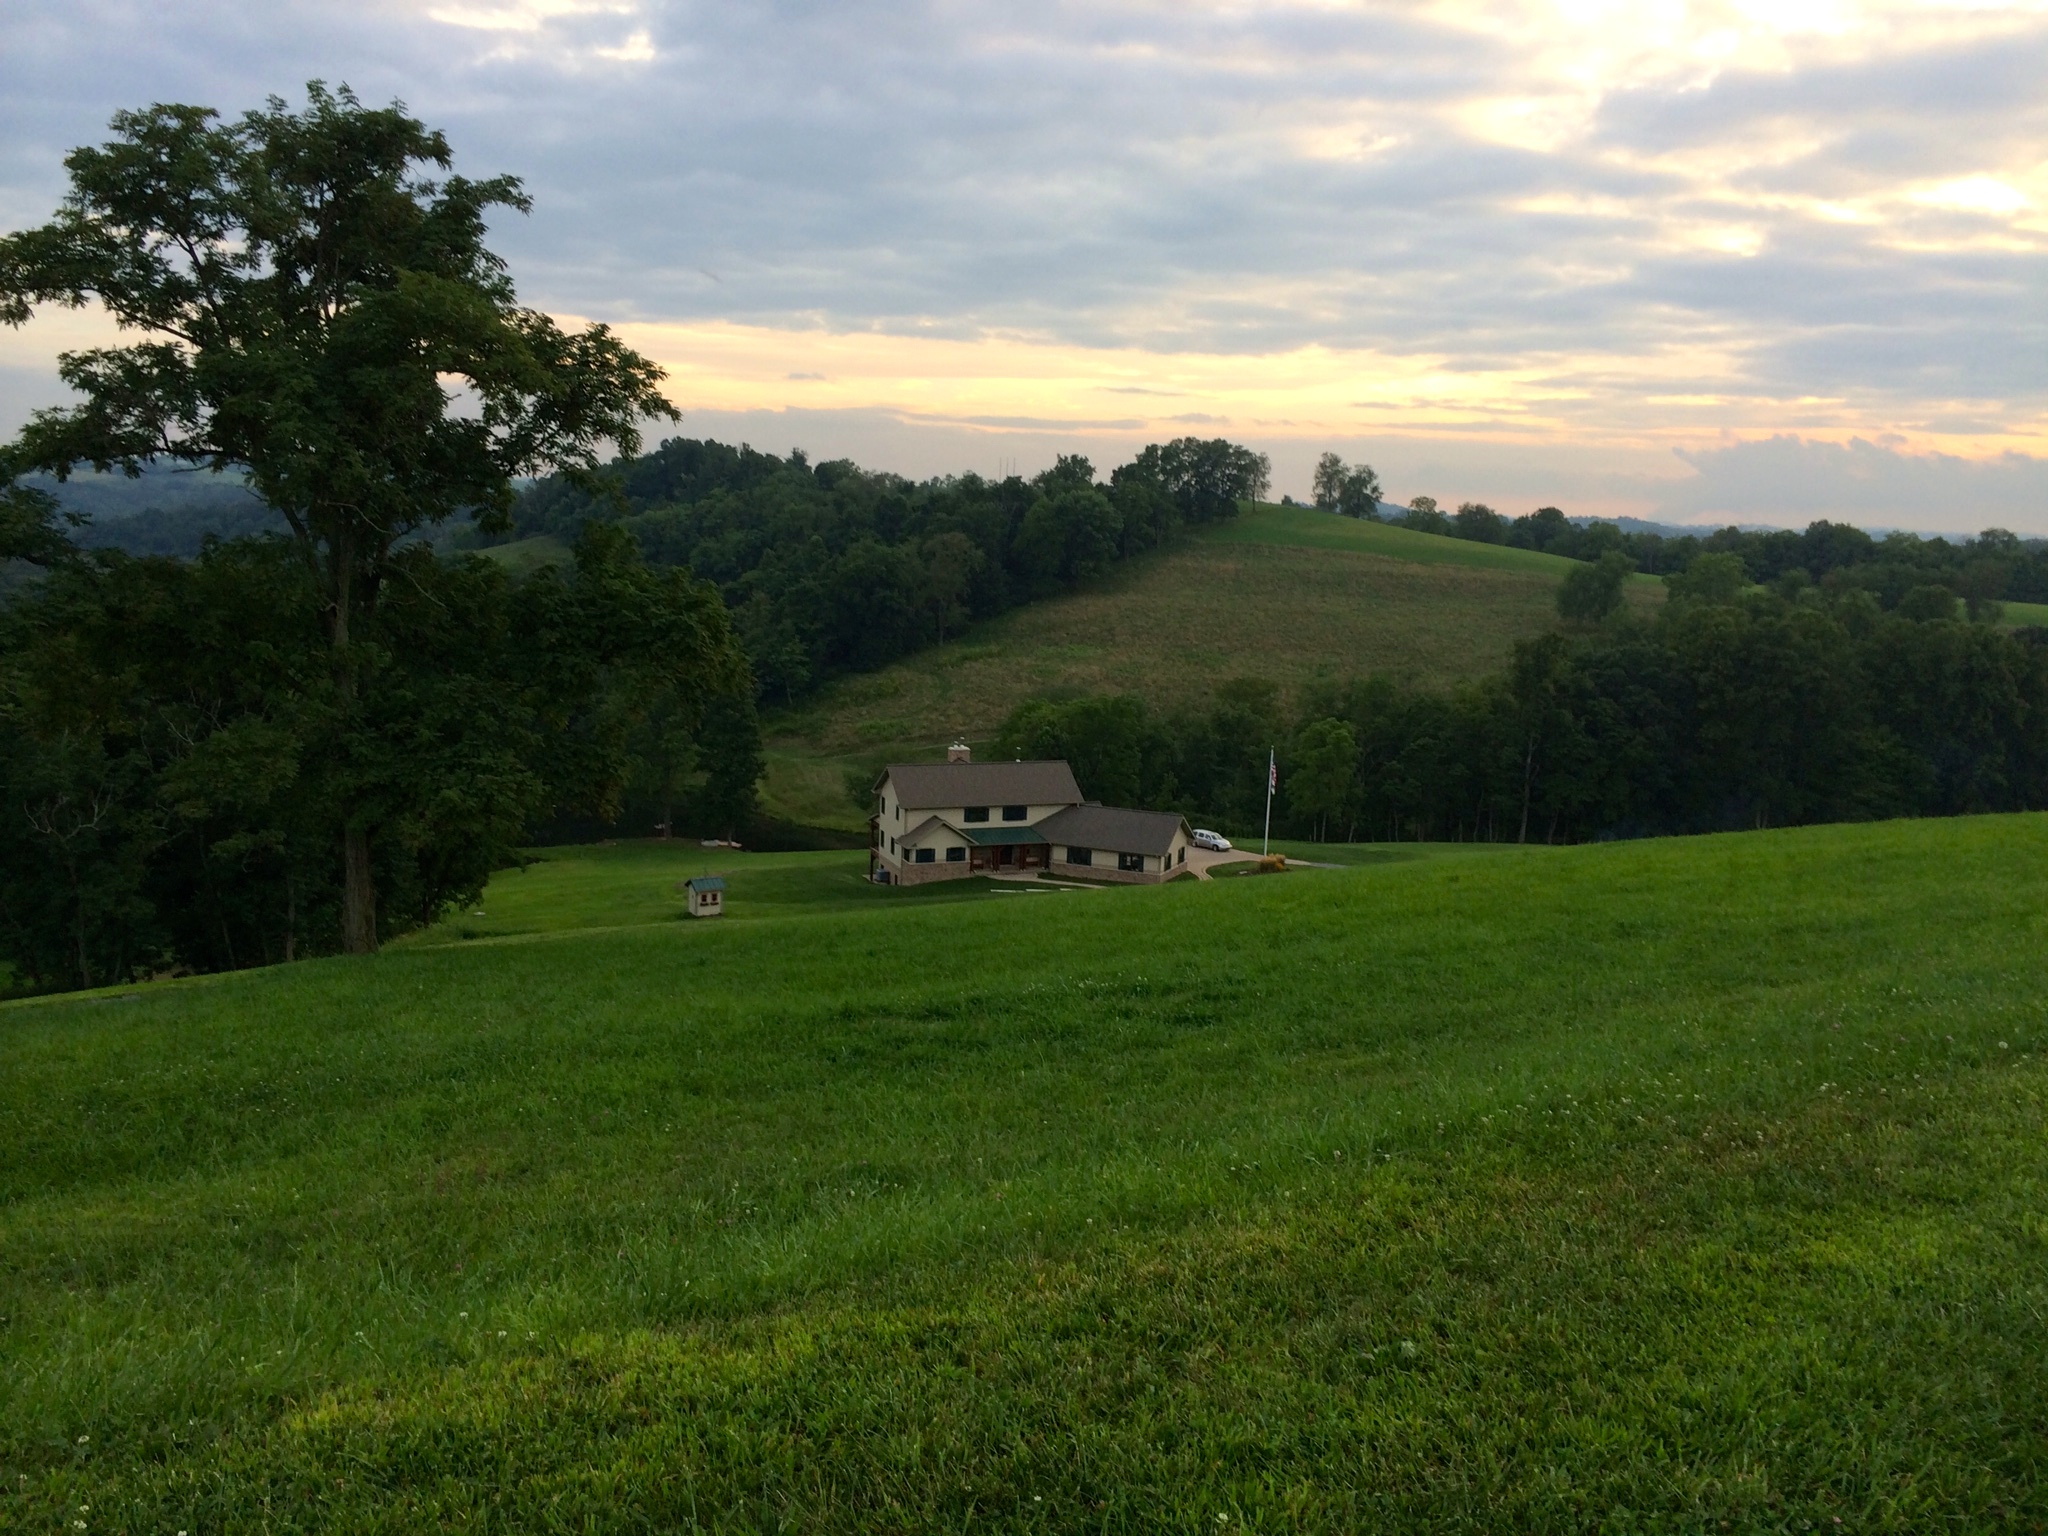
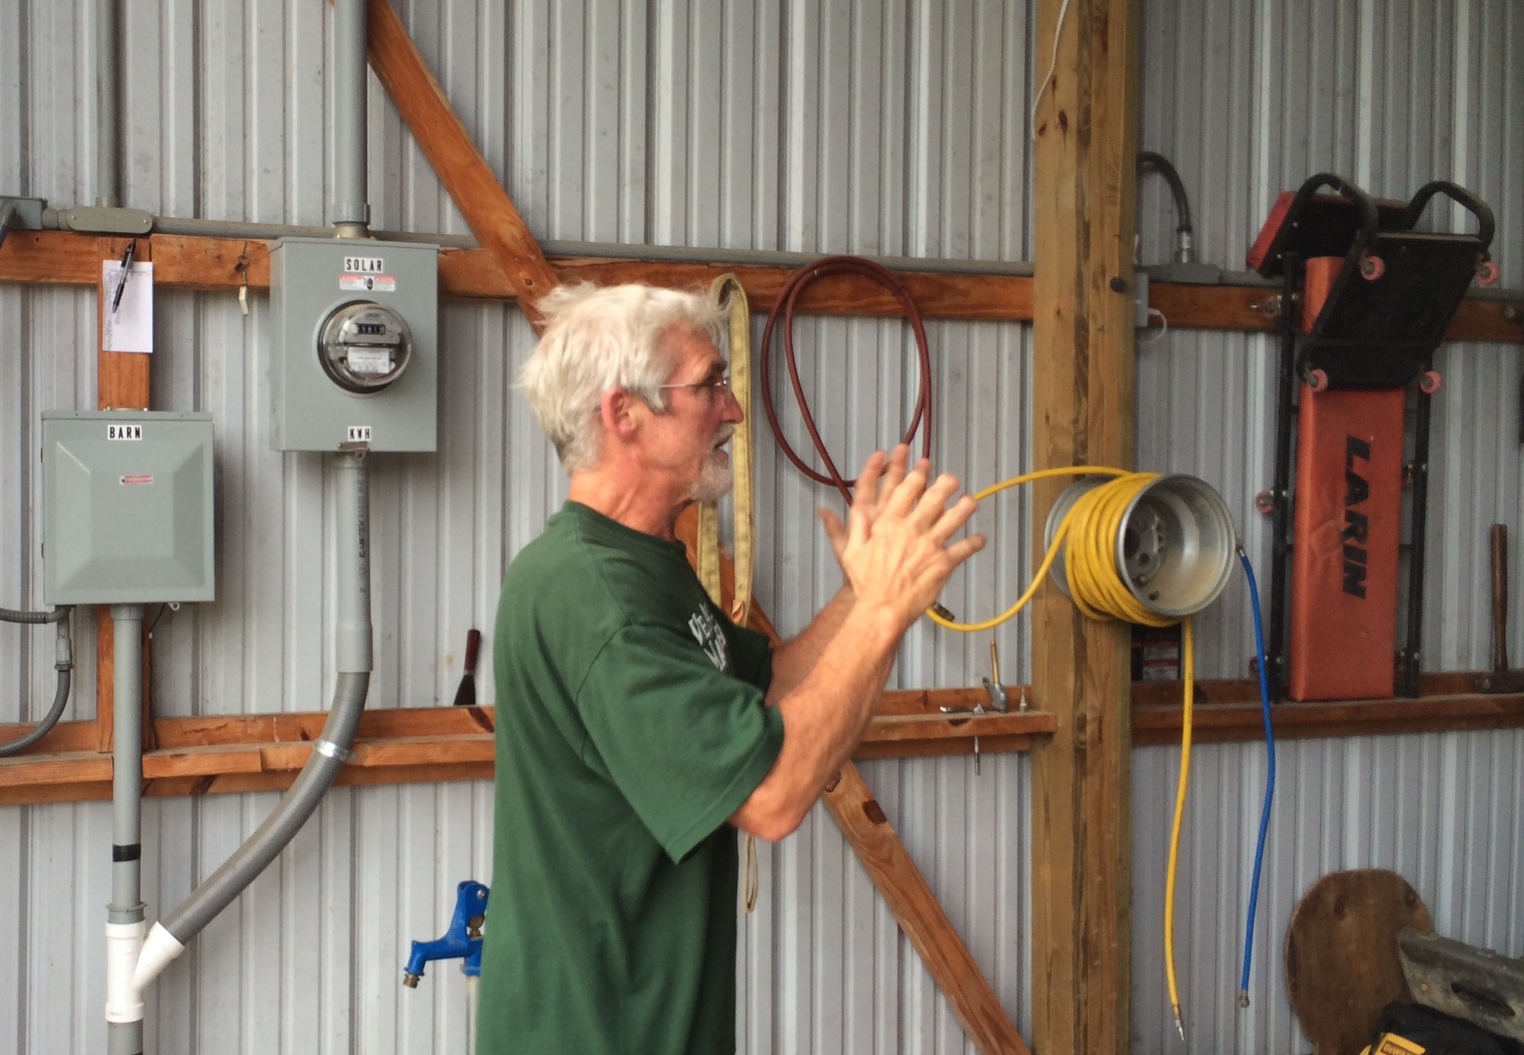
After spending the afternoon travelling to drilling pads and compressor stations for the extraction and processing of unconventional oil and gas in our nearby communities, I travelled to the Niehaus Farm in the beautiful hills of West Virginia to visit with Rich and Felicia Niehaus. As the discussion centered on energy issues, it became evident that there is something crucial missing from the conversation about unconventional oil and gas issues:
energy conservation, energy efficiency, or renewable energy.
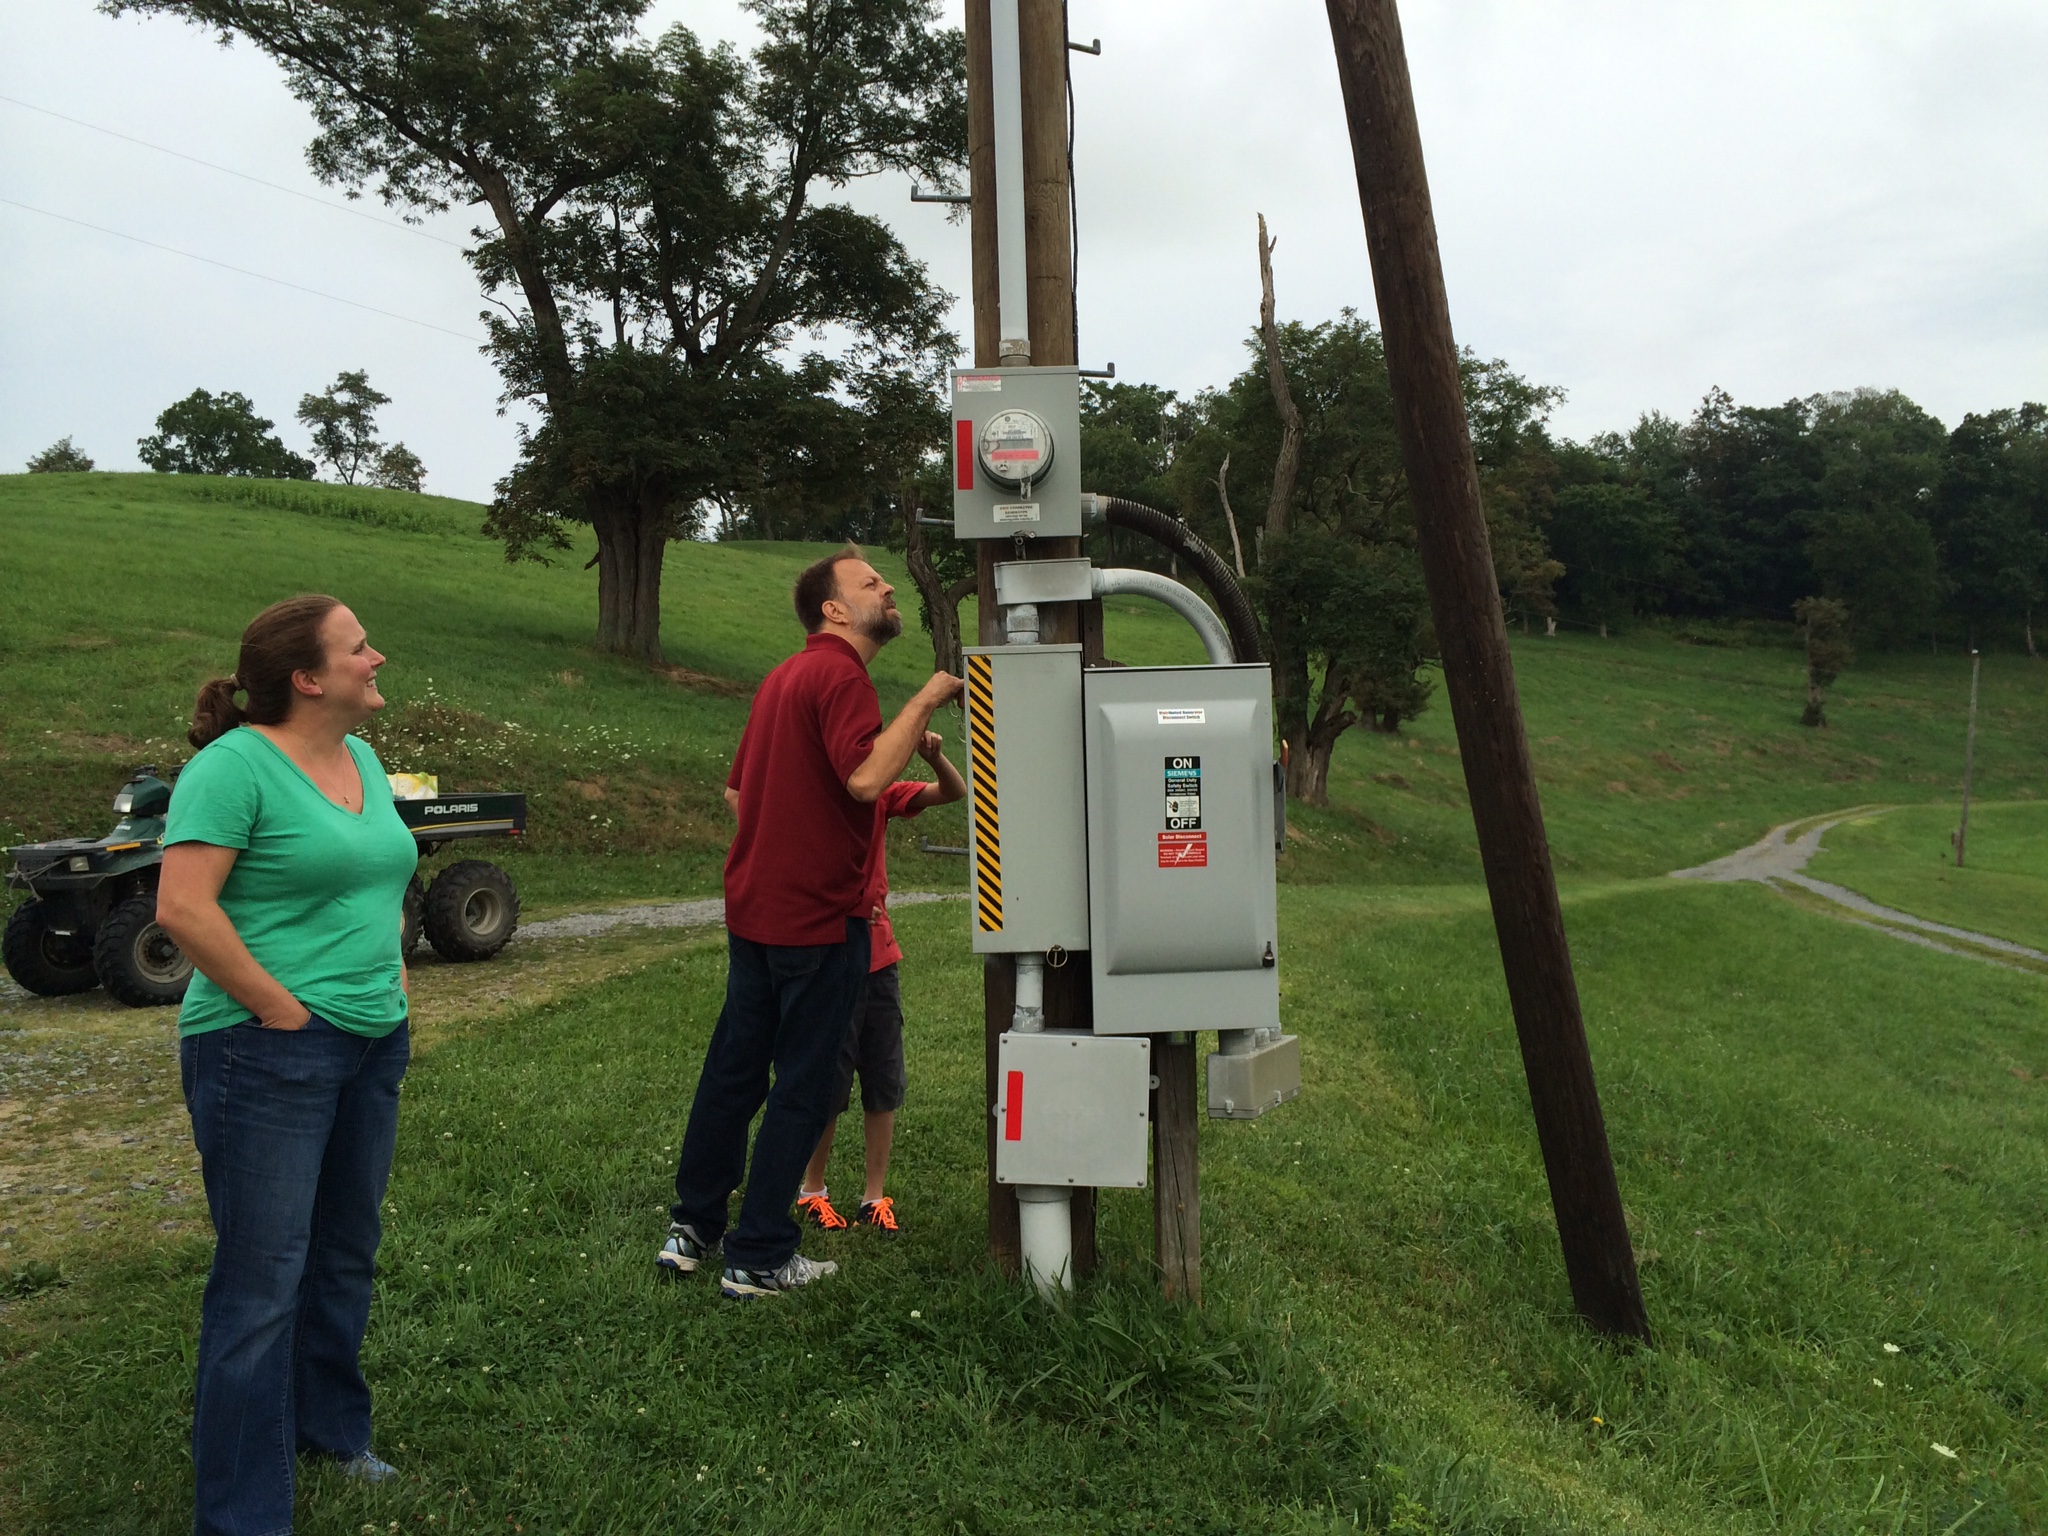
Conversations usually cover either fracking or energy conservation, efficiency, and renewables (ECER). It’s the exception for both to be covered in tandem even though they are the two sides of the same coin (Here, and here are examples of that exception). So, how did our conversation at the farm end up turning to ECER? Well, it turns out that this particular farm in West Virginia is entirely solar powered (photo above). Energy for the two barns and a beautiful home comes from rooftop panels installed in May of 2011. After finding funding and rebates to help with the upfront installation costs and participating in a renewable credits program, as of last year the Neihaus family spent $0.00 on utility bills. Their farm even generated a surplus of electricity, which they sold to the utility company as Solar Renewable Energy Credits – or SREC.
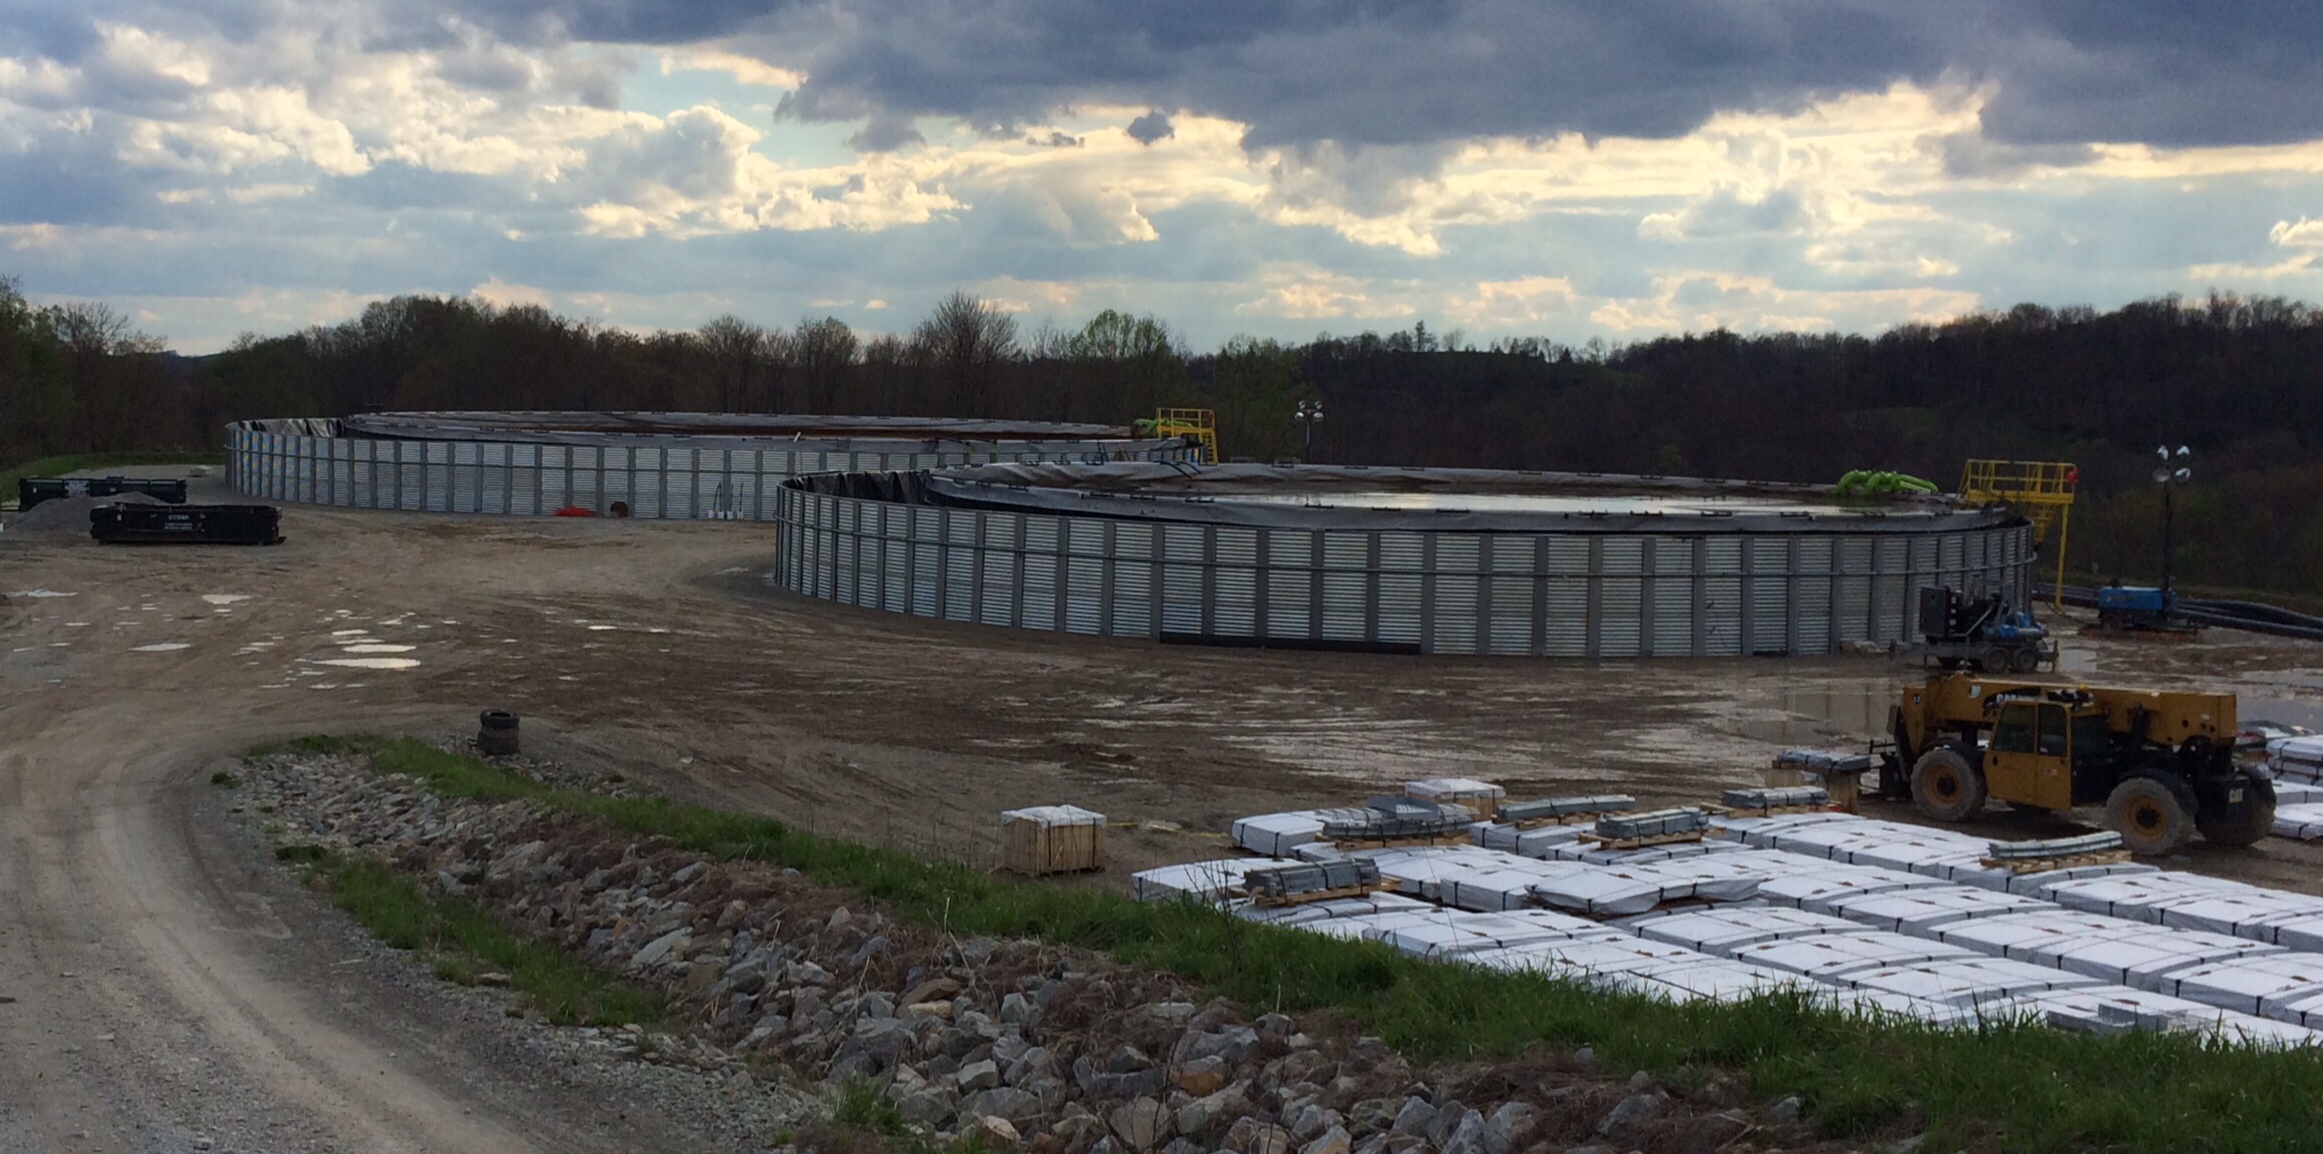
Solar farm tour in Cameron, WV
Reviewing the energy produced
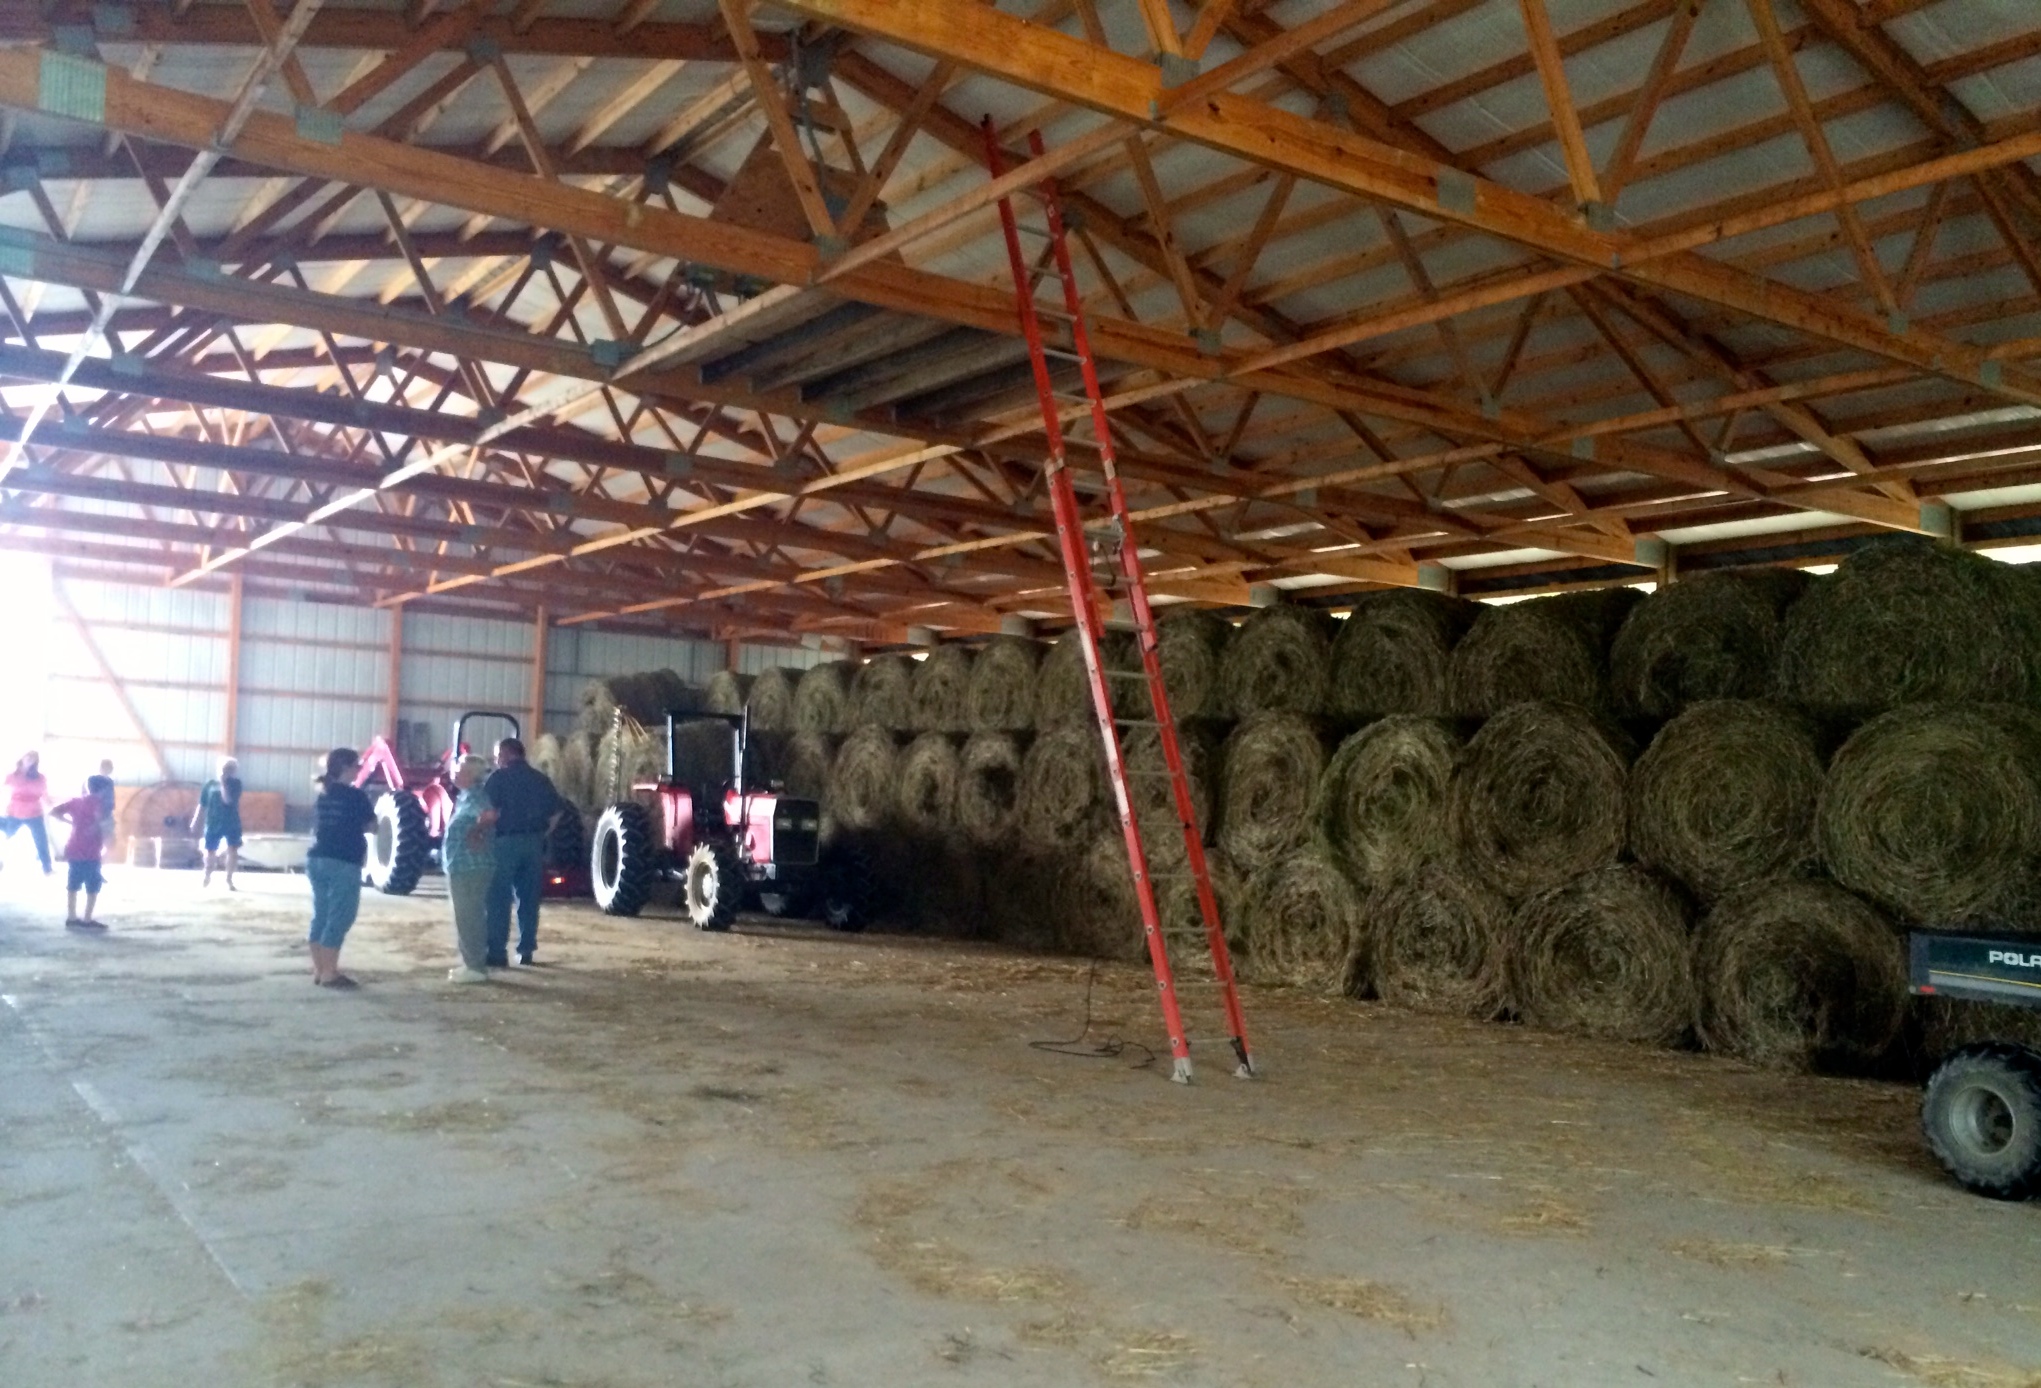
Inside the barn
Discussing renewables with Rich
Perceived Barriers to Renewables
Why don’t more people follow this route? I only have anecdotal answers right now. When discussing fracking or unconventional oil and gas with folks, I ask why they haven’t considered solar as an energy source. Their responses vary but generally look like:
It never even entered my mind.
I’ve heard about solar and wind but heard they are really expensive.
No one sells or installs them around here.
Seems like a lot of work and expense.
Unlike the landman from the oil and gas company who calls or visits your home to talk to you about the benefits of selling your mineral rights for fracking or pipelines, no “sunman / windman / efficiencyman” calls or comes to your home to share the benefits of ECERs. There are few billboards or stories in our local or national media telling us how renewables can power the nation and keep the lights on. However, there are few or no print advertisements for solar, no polished TV ads on the clean energy of solar, wind or geothermal.
Basically, while coal, oil and gas are promoted – and receive generous federal incentives – at every turn or click, the benefits of ECER are truly missing from our conversation, locally and nationally.
Dependability
What if we decided to include the benefits of ECER in all of our conversations about fracking and fossilized sources of energy? Here are just a few items to keep in mind when sharing information that would move us to a more positive energy system future.
First, remember that coal, gas and, nuclear plants are highly intermittent over long time periods, such as their operating year or life span, requiring planned and unplanned maintenance and repair. An article in Cleantechnica tells us that as a result of this downtime, nuclear plants only generate electricity 83% of the time; combined cycle natural gas plants, 86% of the time; and coal plants, 88%. “Coupled renewable systems, like wind with solar tied to baseload power like hydropower, geothermal and solar thermal (with molten salt energy storage) are examples of reliable, dependable energy systems. Solar thermal plants are up and running 98% of the time; hydroelectric dams, 95%, and geothermal plants, 91%.1 According to a FracTracker analysis of Ohio wind potential:
If OH were to pursue the additional 900 MW public-private partnership wind proposals currently under review by the Ohio Power Siting Board (OPSB), an additional 900,000-1.2 million jobs, $1.3 billion in wages, $3.9 billion in sales, and $102.9 million in revenue would result. If the state were to exploit 10% more of the remaining wind capacity, the numbers would skyrocket into an additional 5.5-7.1 million jobs, $8.1 million in wages, $23.8 billion in sales, and $627.9 million in public revenues.
Enough Energy to Power a Nation
Sustainably harnessing enough power to fuel a nation requires conservation and efficiency. According to a recent analysis by the Lawrence Livermore National Laboratory, the US actually wastes 61-86% of the energy it produces. This figure is especially outrageous because the tools and technology needed to save a significant portion of this wasted energy are available right now and would easily fall under President Obama’s “shovel ready” label. For instance, in the past few years, net-zero buildings — those that produce as much (or more) clean energy on site as they use annually — have been gaining momentum. More than 400 such buildings are documented globally, with about one-fourth in the U.S. and Canada.
Knowing the considerable negative impacts of fracking, it is incomprehensible that a targeted national energy conservation and efficiency conversation has yet to take place, and that state policies promoting ECER like those in Ohio are actively being undercut. Energy conservation and efficiency, when coupled with renewables have the capability to power the nation.2
Gas – Nonrenewable, Finite, Declining
Unlike ECER, oil and natural gas are finite resources. Additionally, highly productive, economically recoverable shale wells have very high geological depletion rates and will become more difficult and more expensive to access.3 “The average flow from a shale gas well drops by ~50-75% in the first year, and up to 78% for oil”, said Pete Stark, senior research director at IHS Inc (a global information company with expertise in energy and economics). In neighboring Ohio, first-year oil and natural gas production declined by 84% (21-48 barrels of oil per day), with respective declines of 27% and 10% in subsequent years, while freshwater usage increases by 3.6 gallons per gallon of oil. Even the United States’ most productive Bakken shale requires 2,500 new wells per year to maintain 1 million BDD, while traditional fields in Iraq require a mere 60 new wells per year. ECERs, on the other hand, are renewable systems with decline rates calculated in the billions-of-years time frame.
Fossilized Energy – Costs Exceed Benefits
Often you will hear that fracking and fossilized energy are “cheap and affordable.” According to a report by Environment America, the reality is that externalized costs of fossilized energy, were they included on the balance sheet, would make gas, oil and coal costly and unaffordable. Alternatively, 53 Fortune 100 Companies report savings of $1.1 billion annually through energy efficiency and renewable energy.4
Some reports indicate that due to the nature of fossil fuel extraction compared to renewables, there are more jobs to be had in renewables.5 There is also the [significantly higher job, tax revenue, and income] multiplier effect associated with renewable energy technologies. The Union of Concerned Scientists reminds us that,
In addition to creating new jobs, increasing our use of renewable energy offers other important economic development benefits. Local governments collect property and income taxes and other payments from renewable energy project owners. These revenues can help support vital public services, especially in rural communities where projects are often located.
Along with externalized costs, natural gas also gets a preferred boost from our nation’s R&D funding compared to ECER research. This issue does not even include the de facto subsidies provided by our military escapades, which Joe Stiglitz and Linda Bilmes recently put at $3 trillion. In Scientific American’s article, Fracking Hammers Clean Energy Research, David Bello looked at the budget of the ARPA-E (Advanced Research Projects Agency-Energy) and found that five years in, “the gassy revolution was becoming apparent,” with funding going to natural gas research rather than ECER breakthroughs. Bello is of the opinion:
It is also exactly in times of overreliance on one energy source that funding into alternatives is not only necessary, but required. ARPA–E should continue to focus on transformational energy technologies that can be clean and cheap even if political pressures incline the still young and potentially vulnerable agency to look for a better gas tank.
Also, globally, the UN Environmental Program reports that the world spends six times as much money subsidizing fossilized energy as they do renewables. Despite having less government support, renewables have achieved record growth since 2000. The EIA reports that renewables are the fest-growing power source based on percentages, and in 2018 is estimated to rise to 25% of the global gross power generation. The EIA reports that, “On a percentage basis, renewables continue to be the fastest-growing power source… Globally, renewable generation is estimated to rise to 25% of gross power generation in 2018.” Germany alone generates 27% of its energy demand from renewables.
Climate Change – Sources & Solutions
Recent NOAA research suggests fugitive methane leaking from natural gas activity may be substantial, with leakage rates of 4-9% of the total production. This figure is significantly above the 2% recommended level for potential climate change benefits. Ken Caldeira, atmospheric scientist with the Carnegie Institution for Science recently noted:
We have to decide whether we are in the business of delaying bad outcomes or whether we are in the business of preventing bad outcomes. If we want to prevent bad climate outcomes, we should stop using the atmosphere as a waste dump. If we build these natural gas plants, we reduce incentives to build the near zero emission energy system we really need. It is time to start building the near zero emission energy system of the future. Expansion of natural gas is a delaying tactic, not a solution. A switch to natural gas would have zero effect on global temperatures by the year 2100.
Caldiera and Myhrvold’s paper on transitional energy concludes, “If you take 40 years to switch over entirely to natural gas, you won’t see any substantial decrease in global temperatures for up to 250 years [due to the CO2 inertia effect]. There’s almost no climate value in doing it.”
No Longer Missing
To make a short story long, that is what’s missing from the conversation – the great story of the benefits and solutions of ECER. How can we move towards a more positive and diversified energy future if we continue to bury the lead? The real solutions to our energy challenge cannot be relegated to a sidebar conversation. A disconnect between what is and what can be will keep us on the path to dire economic and public health impacts.
Back to the Niehaus farm…
As we were enjoying the fresh air, the pastoral beauty and soft sounds of nature that evening, I tried to picture what this landscape would look like, smell like, sound like, feel like, if instead of enjoying this farm fueled by solar, we were sitting back at one of the many homes bordering a drilling pad or processing facility that I had visited earlier in the day. I tried to envision what the wildlife, streams and skies would look like, what the children’s legacy would be, wondering if we were perhaps too distracted calculating costs instead of values.
When speaking of his investment in solar and his approach to life, Rich shares with us that he subscribes to the ancient Indian proverb, “We do not Inherit the Earth from our Ancestors; we Borrow it from our Children.”
After this “renewed” experience at the farm that evening, I reaffirmed my efforts to not miss any more opportunities to raise the profile of ECERs when people are debating the pros and cons of fracking and fossils. Energy Conservation, Efficiency and Renewables can no longer go missing from our conversations or we allow the myth to flourish that only fossils can “keep the lights on.” With ECERs in the conversation we may actually transition from this “transition fuel,” to a truly transformational future.
As Buckminster Fuller once said:
You never change things by fighting the existing reality. To change something, build a new model that makes the existing model obsolete.
Additional References
To learn more, go to the Rocky Mountain Institute website.
A report by WWF, Ceres, Calvert Investments and David Gardiner and Associates finds that
Addressing the issue of job creation, the Union of Concerned Scientists reports, “Compared with fossil fuel technologies, which are typically mechanized and capital intensive, the renewable energy industry is more labor-intensive. This means that, on average, more jobs are created for each unit of electricity generated from renewable sources than from fossil fuels.”
https://www.fractracker.org/a5ej20sjfwe/wp-content/uploads/2014/10/Solar-Panels-Feature.png400900FracTracker Alliancehttps://www.fractracker.org/a5ej20sjfwe/wp-content/uploads/2025/09/2025-Wordmark-Logo.pngFracTracker Alliance2014-10-06 12:21:042020-07-21 10:42:46Missing from the Conversation
State Senator Joseph Scarnati III, from north-central Pennsylvania, has introduced a bill that would redefine the distinction between conventional and unconventional oil and gas wells throughout the state. In Section 1 of the bill, the sponsors try to establish the purpose of the legislation, making the case that:
Conventional oil and gas development has a benign impact on the Commonwealth
Many of the wells currently classified as conventional are developed by small businesses
Oil and gas regulations, “must permit the optimal development of oil and gas resources,” as well as protect the citizens and environment.
Previous legislation already does, and should, treat conventional and unconventional wells differently
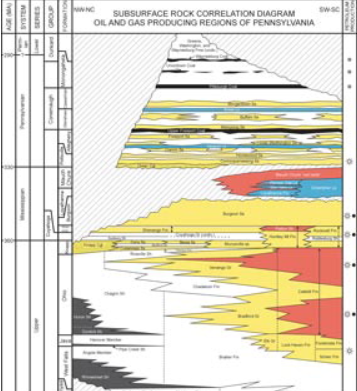
This diagram shows geologic stata in Pennsylvania. The Elk Group is between the Huron and Rhinestreet shale deposits from the Upper Devonian period. Click on the image to see the full version. Source: DCNR
Certainly, robust debate surrounds each of these points, but they are introductory in nature, not the meat and potatoes of Senate Bill 1378. What this bill does is re-categorize some of the state’s unconventional wells to the less restrictive conventional category, including:
All oil wells
All natural gas wells not drilled in shale formations
All shale wells above (shallower than) the base of the Elk Group or equivalent
All shale wells below the Elk Group from a formation that can be economically drilled without the use of hydraulic fracturing or multi-lateral bore holes
All wells drilled into any formation where the purpose is not production, including waste disposal and other injection wells
The current distinction is in fact muddled, with one DEP source indicating that the difference is entirely due to whether or not the formation being drilled into is above or below the Elk Group, and another DEP source indicates that the difference is much more nuanced, and really depends on whether the volumes of hydraulic fracturing fluid required to profitably drill into a given formation are generally high or low.
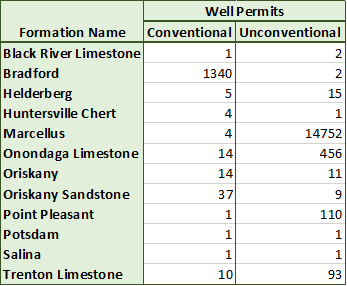
This table shows the number of distinct wells in each producing formation in Pennsylvania that has both conventional and unconventional wells drilled into it. Data source: DEP, downloaded 7/9/2014.
As one might expect, this ambiguity is represented in the data. The chart at the left shows the number of distinct number of wells by formation, for each producing formation that has both conventional and unconventional wells in the dataset. Certainly, there could be some data entry errors involved, as the vast majority of Bradford wells are conventional, and almost all of the Marcellus wells are unconventional. But there seems to be some real confusion with regards to the Oriskany, for example, which is not only deeper than the Elk Group, but the Marcellus formation as well.
While an adjustment to the distinction of conventional and unconventional wells in Pennsylvania is called for, one wonders if the definitions proposed in SB 1378 is the right way to handle it. If the idea of separating the two is based on the relative impact of the drilling operation, then a much more straightforward metric might be useful, such as providing a cutoff in the amount of hydraulic fracturing fluid used to drill a well. Further, each of the five parts of the proposed definition serve to make the definition of unconventional wells less inclusive, meaning that additional wells would be subject to the less stringent regulations, and that the state would collect less money from the impact fees that were a part of Act 13 of 2012.
Instead, it is worth checking to see whether the definition of unconventional is inclusive enough. In May of this year, FracTracker posted a blog about conventional wells that were drilled horizontally in Pennsylvania.
Conventional, non-vertical wells in Pennsylvania. Please click the expanding arrows icon at the top-right corner to access the legend and other map controls. Please zoom in to access data for each location.
These wells require large amounts of hydraulic fracturing fluids, and are already being drilled at depths of only 3,000 feet, and could go as shallow as 1,000 feet. It’s pretty easy to argue that due to the shallow nature of the wells, and the close proximity to drinking water aquifers, these wells are deserving of even more rigorous scrutiny than those drilled into the Marcellus Shale, which generally ranges from 5,000 to 9,000 feet deep throughout the state.
A summary of the different regulations regarding conventional and unconventional wells can be found from PennFuture. In general, unconventional wells must be further away from water sources and structures than their conventional counterparts, and the radius of presumptive liability for the contamination of water supplies is 2,500 feet instead of 1,000.
SB 1378 has been re-referred to the Appropriations Committee.
https://www.fractracker.org/a5ej20sjfwe/wp-content/uploads/2014/07/formations_ConUnc_07092014.png286347Matt Kelso, BAhttps://www.fractracker.org/a5ej20sjfwe/wp-content/uploads/2025/09/2025-Wordmark-Logo.pngMatt Kelso, BA2014-07-09 15:04:362020-07-21 10:42:41What’s in PA Senate Bill 1378?
By Brook Lenker, Executive Director, FracTracker Alliance
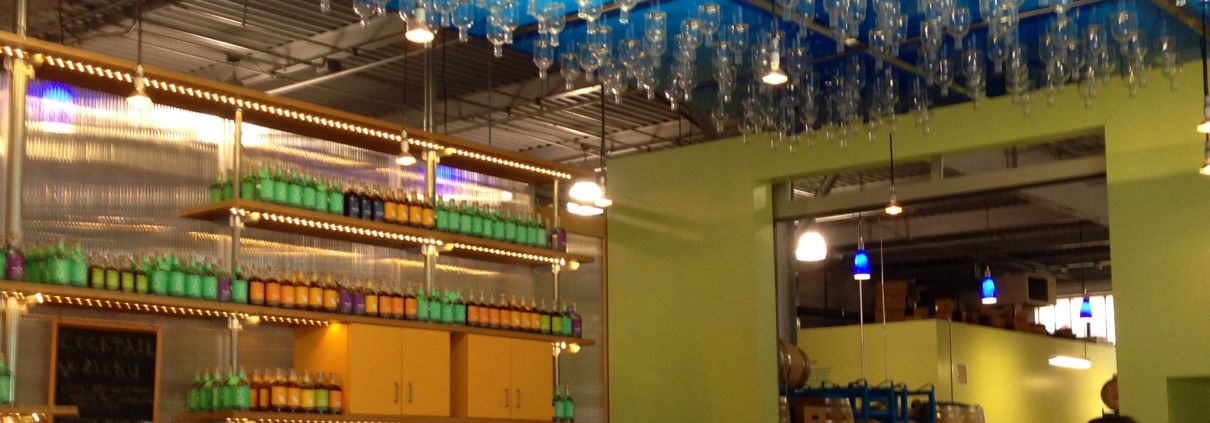
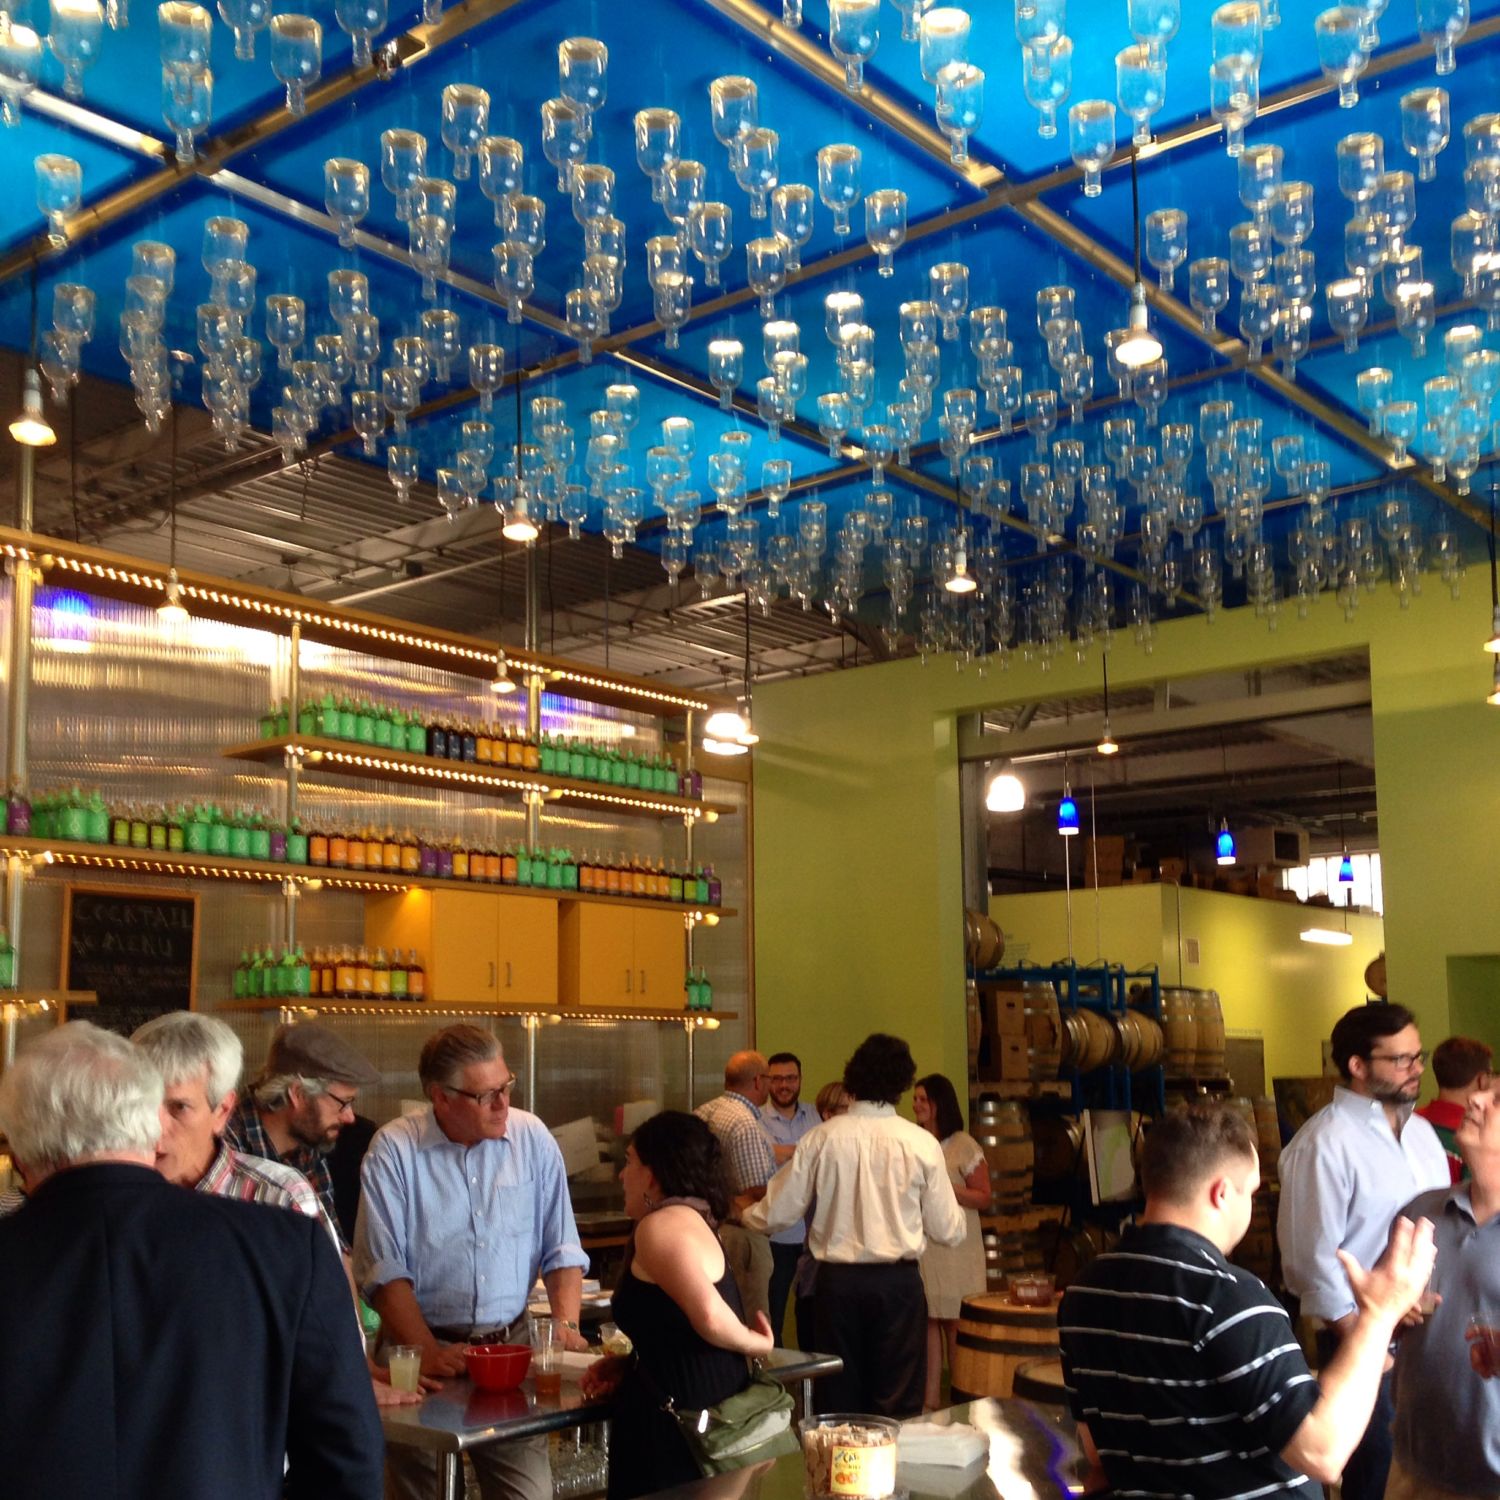
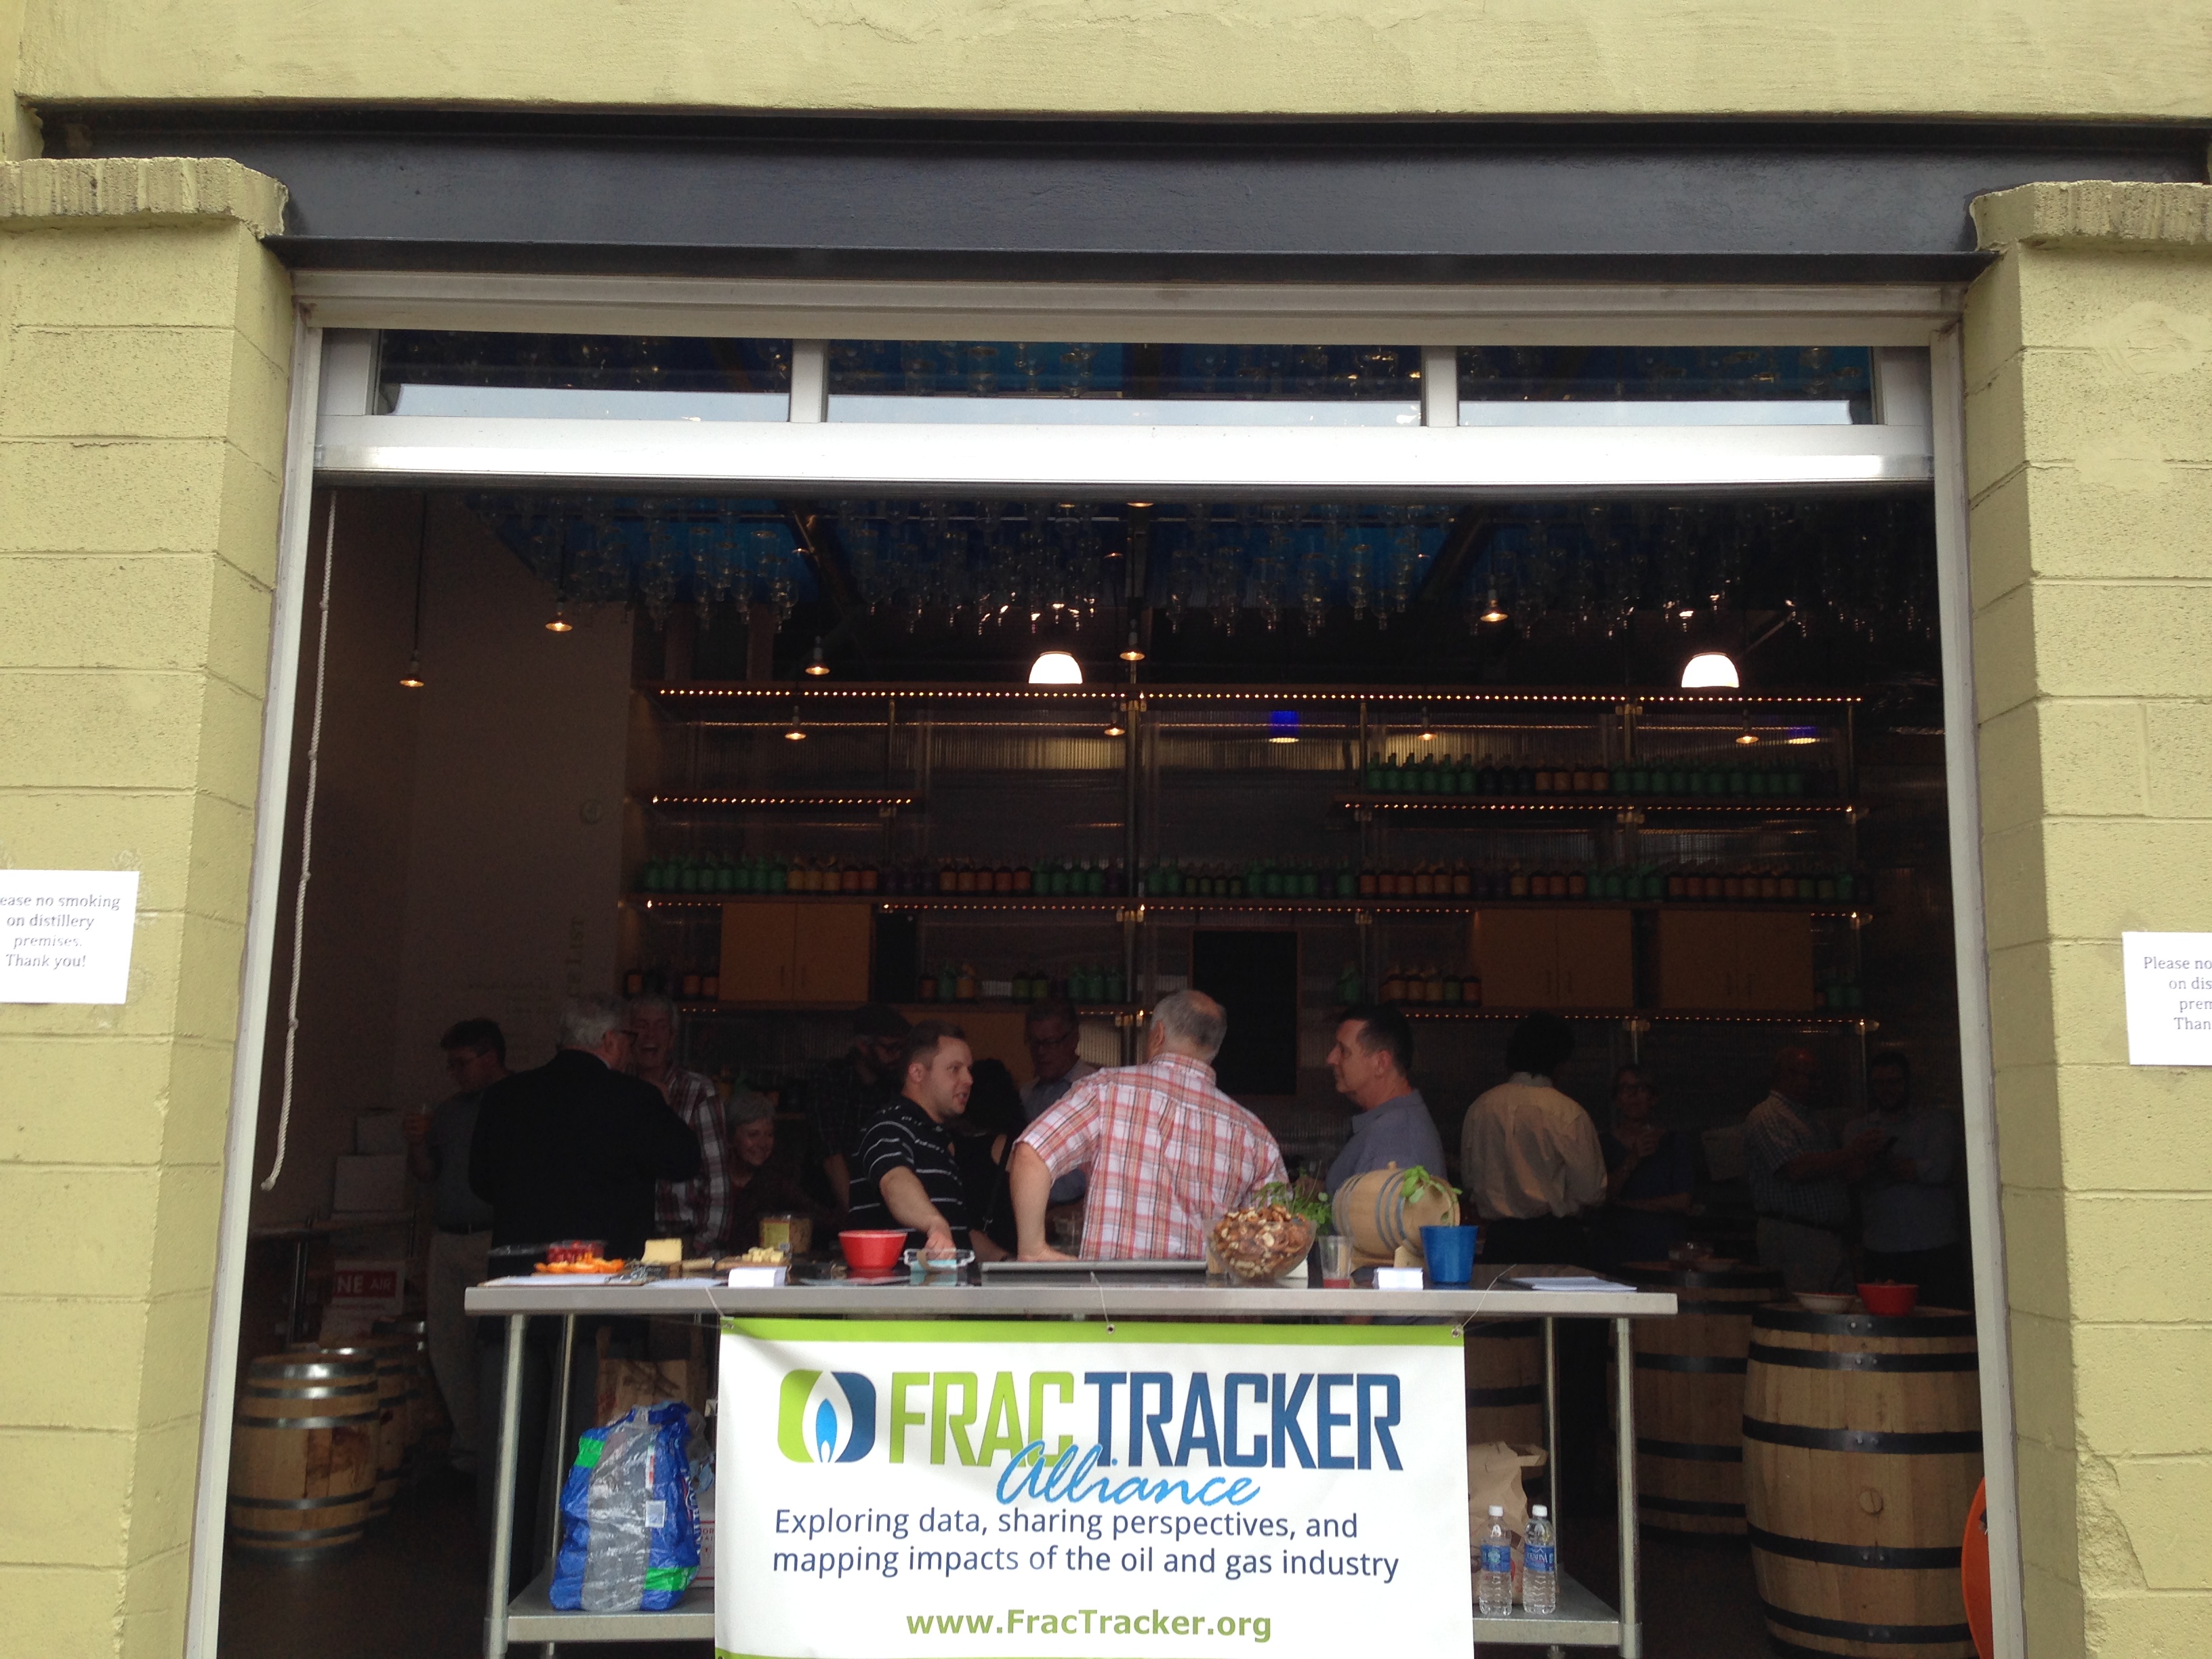
Enjoying some whiskey in Pittsburgh
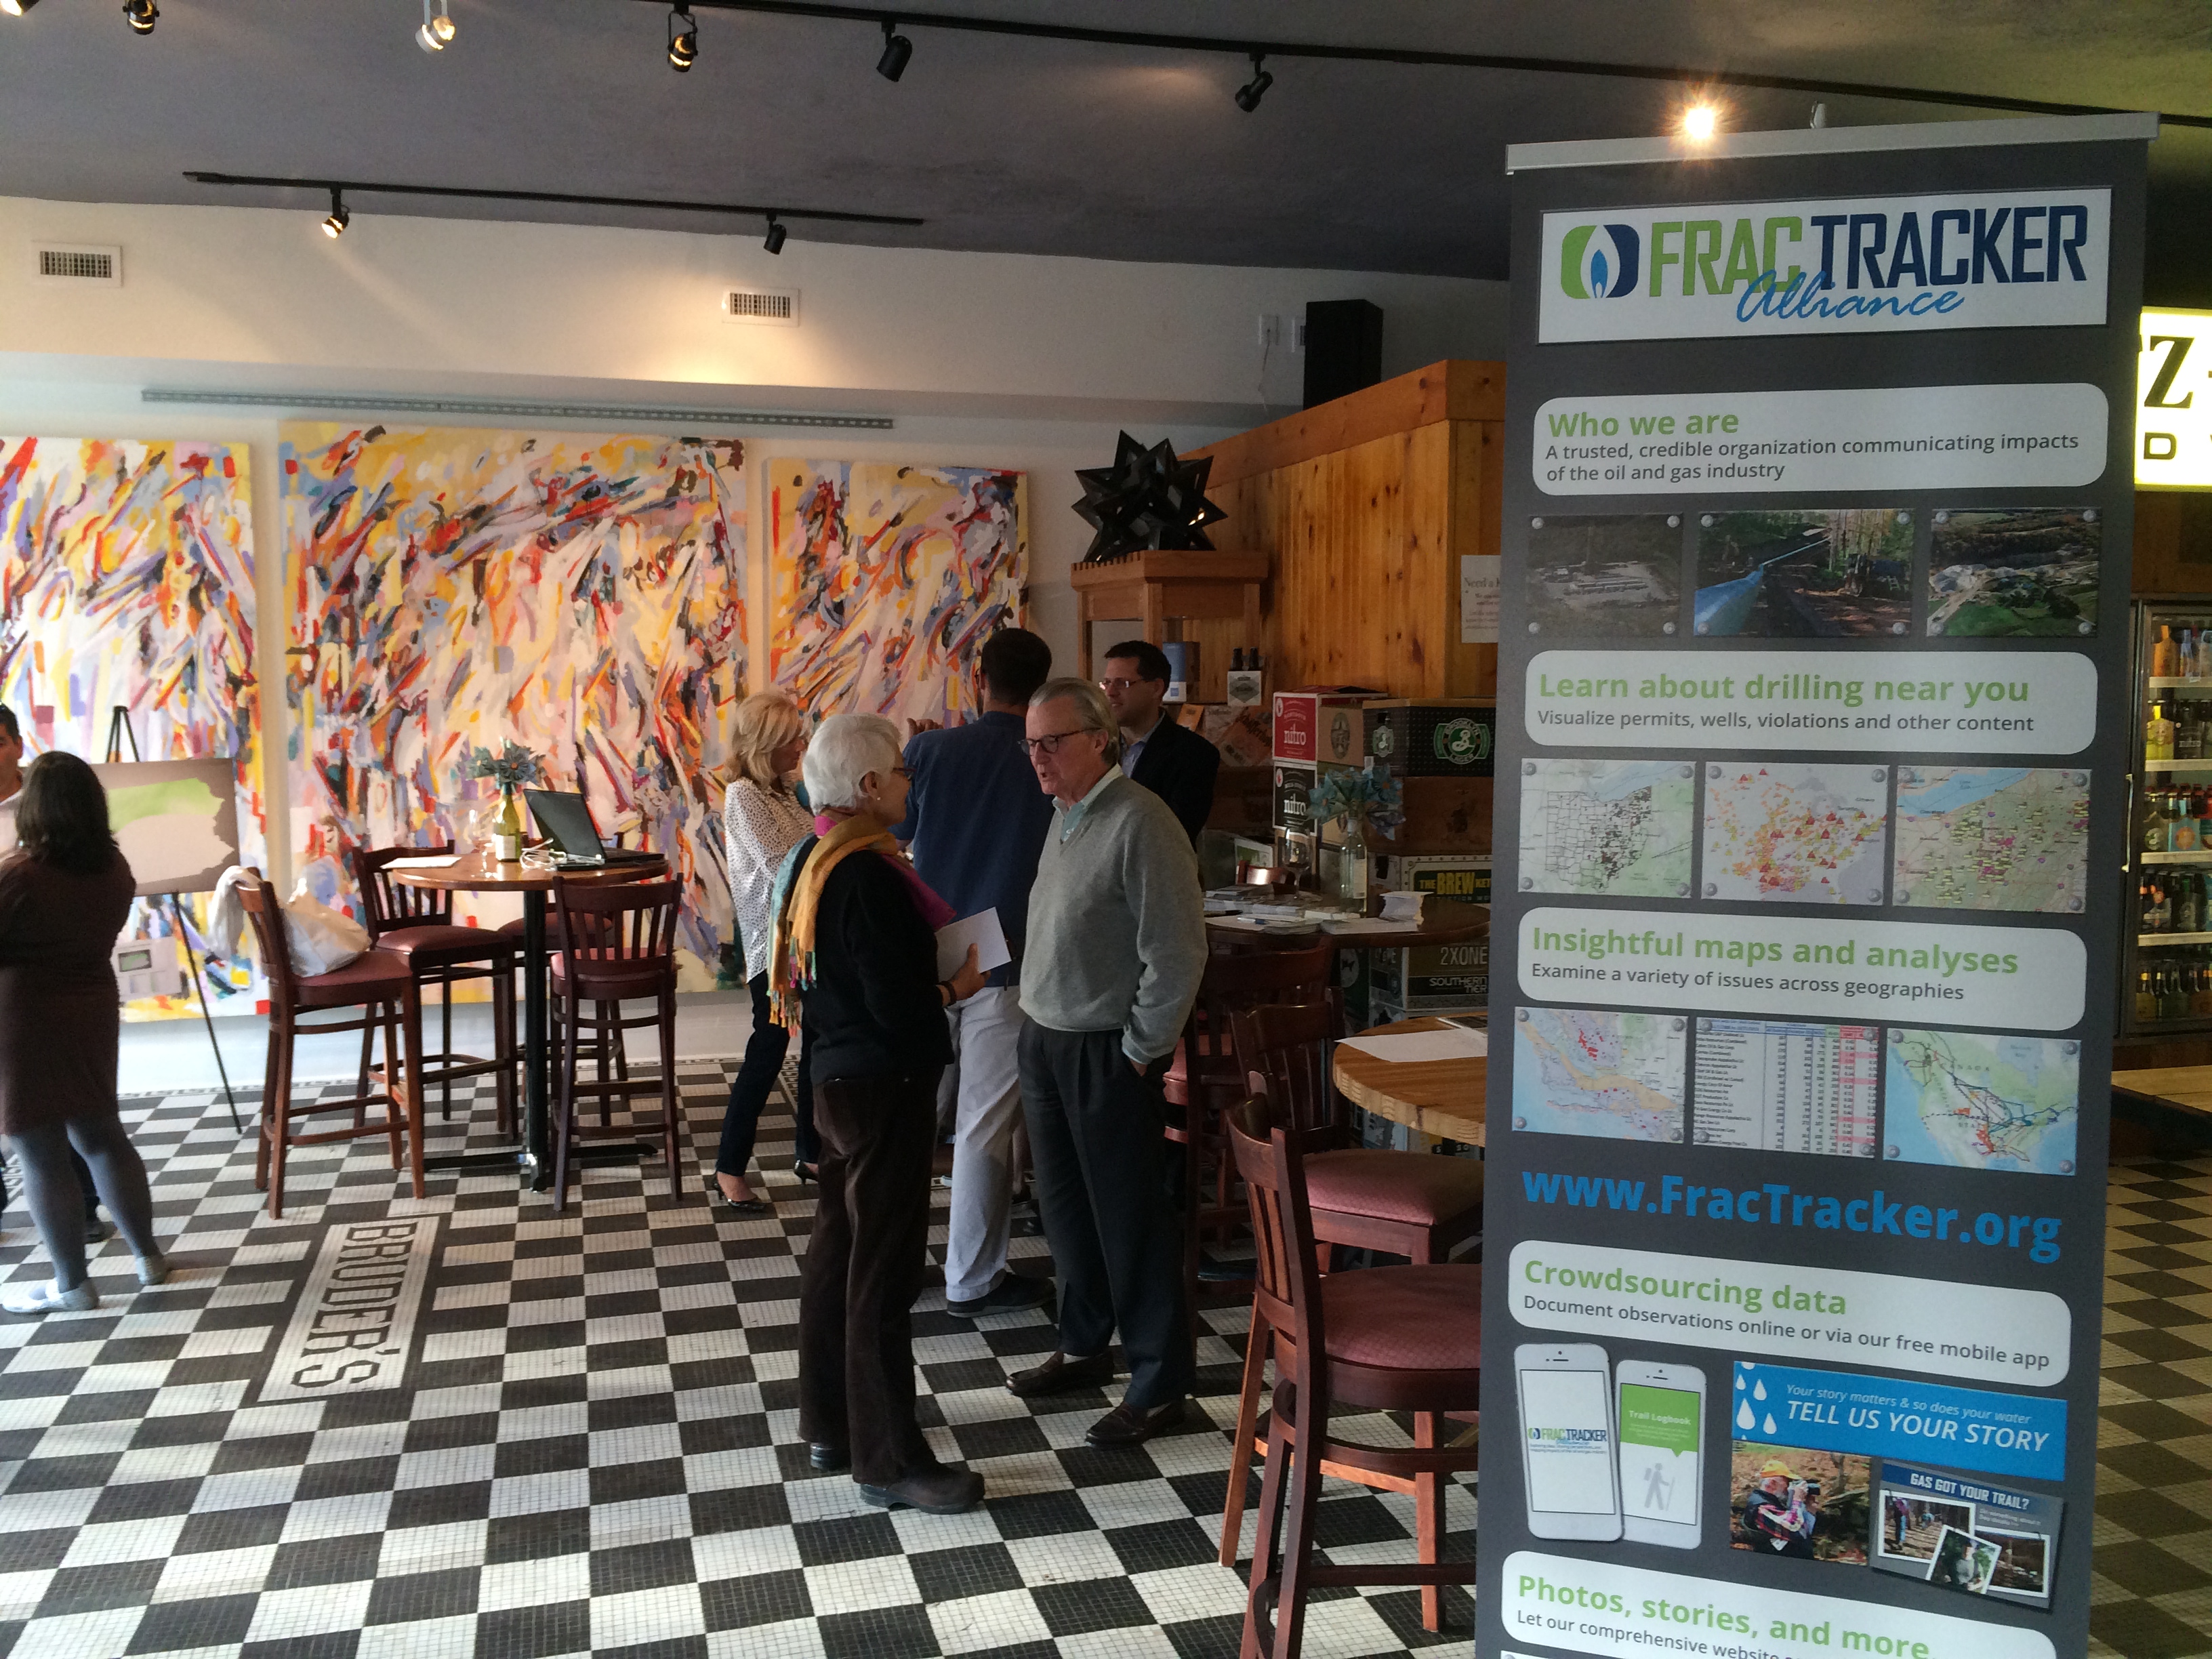
It’s almost July, but just a few weeks ago, FracTracker wrapped up the last of three fundraising events. From a site in San Francisco overlooking the Pacific to a budding distillery in Pittsburgh’s Strip District, friends and colleagues came together to show their support for our work and their concern about the effects of unconventional drilling. If you were able to join us for these events – whatever the motivation, we appreciated your collective, deliberate act of kindness. Thank you!
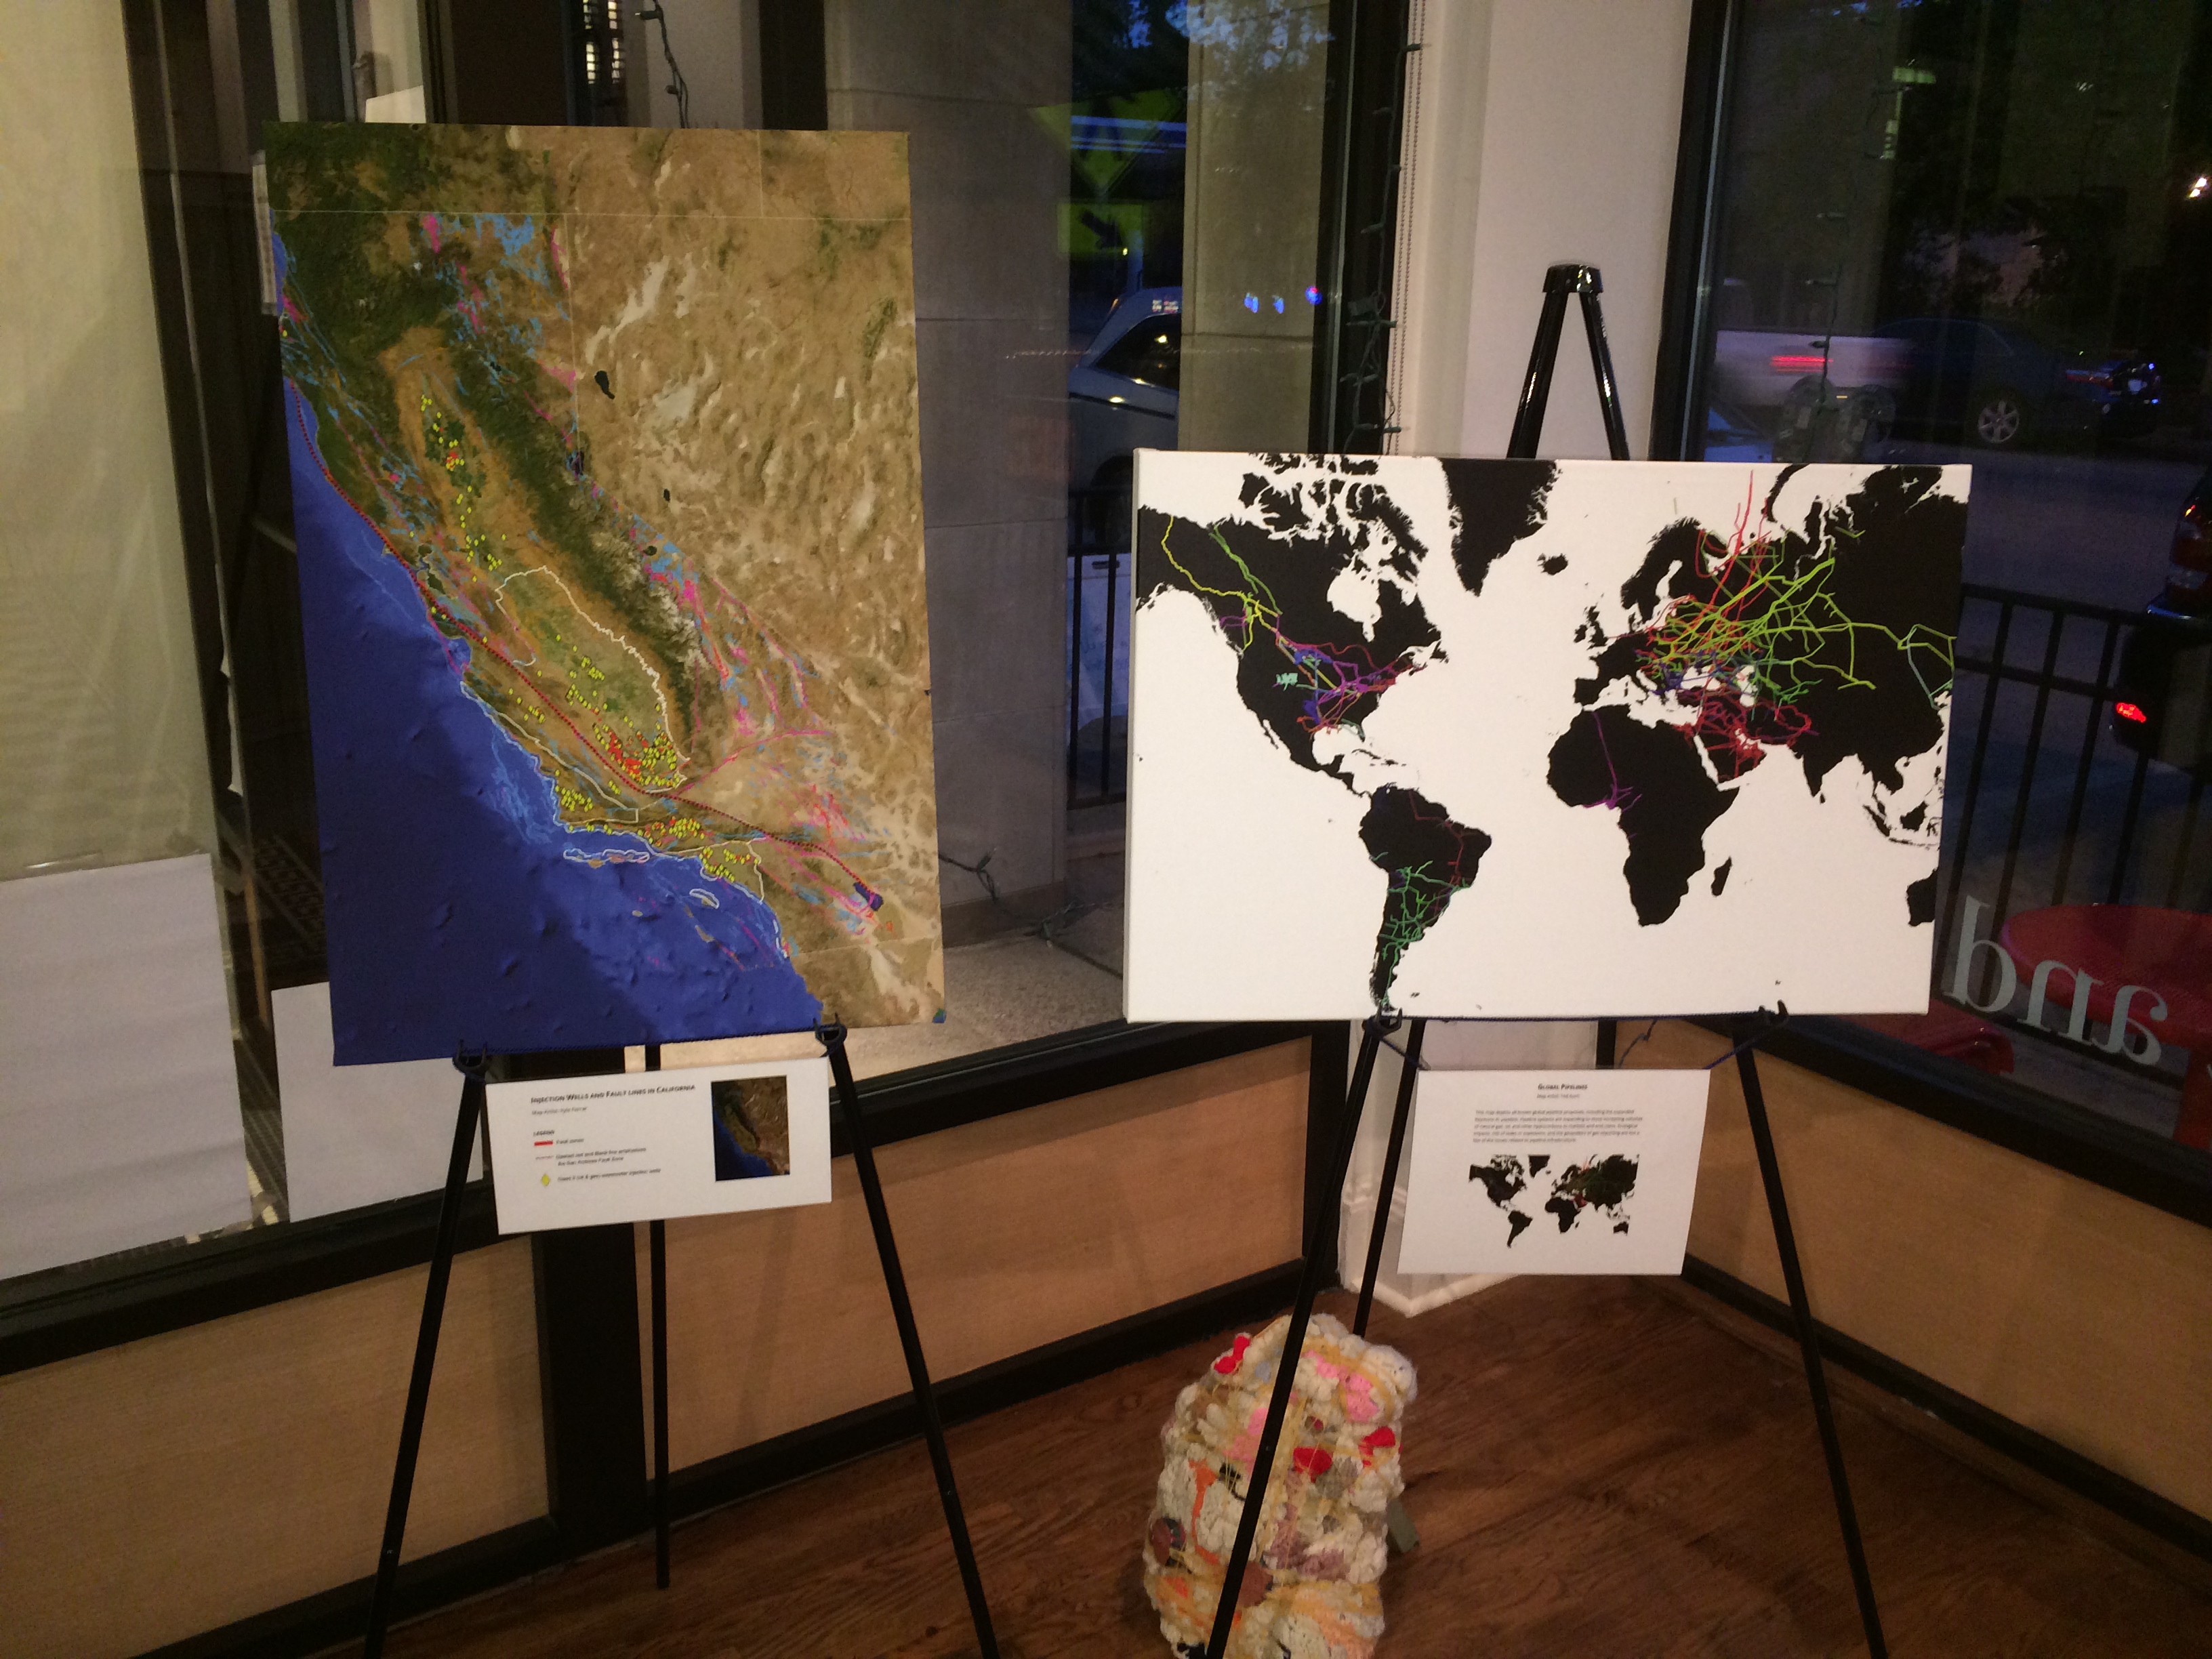
The gatherings were generally small but lots of fun – full of conversation, positive energy, and, yes, good spirits. At the Cleveland Heights event, we even had live music thanks to the jazzy guitar of Alan Brooks and at all three venues a colorful exhibit of thought-provoking, conversation-stoking maps entitled “Cartography on Canvas.” These events were our first foray into fundraisers. From the experience they’ll be improved and made even more memorable, unique, extraordinary. That’s our goal.
We aim to entice more attendees, enhance our revenue, and, most importantly, grow the network of the informed – not just informed about the activities of FracTracker but of all the groups, efforts, and learnings related to the impacts of extreme hydrocarbon extraction. Soon, another round of events – guaranteed to be mood improving, mind expanding affairs – will be rolled out. Prepare to mark your calendars, join the fun, and make your own social statement!
A special thank you goes out to FracTracker staff, interns, and board members who put in extra time and effort to help ensure the success of these initial fundraisers. Thank you, too, to our incredible door prize and auction item contributors:
https://www.fractracker.org/a5ej20sjfwe/wp-content/uploads/2014/06/IMG_6508.jpg15001500FracTracker Alliancehttps://www.fractracker.org/a5ej20sjfwe/wp-content/uploads/2025/09/2025-Wordmark-Logo.pngFracTracker Alliance2014-06-30 11:08:202020-07-21 10:42:28Putting the “Fun” in Fundraisers