Water Use Graph by Frac Sand Operator
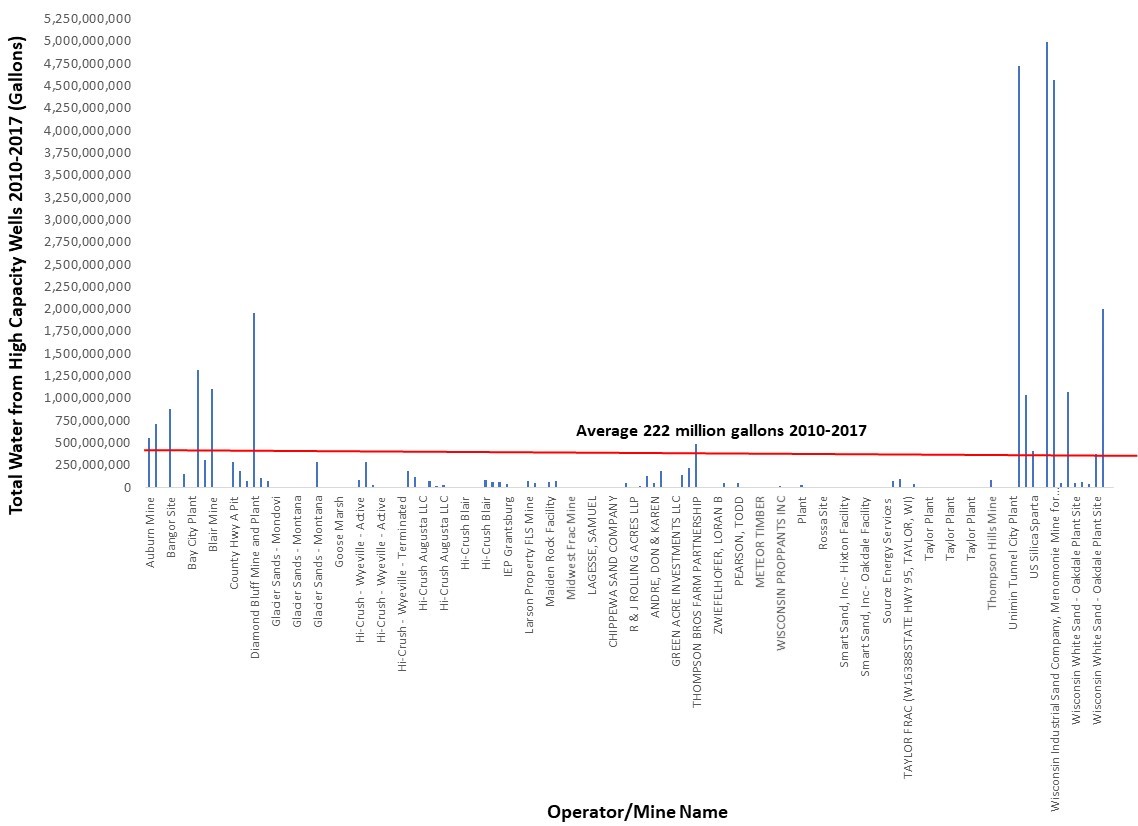
Water Use Graph by Frac Sand Operator, 2010-2017
If you are not happy with the results below please do another search
Water Use Graph by Frac Sand Operator, 2010-2017
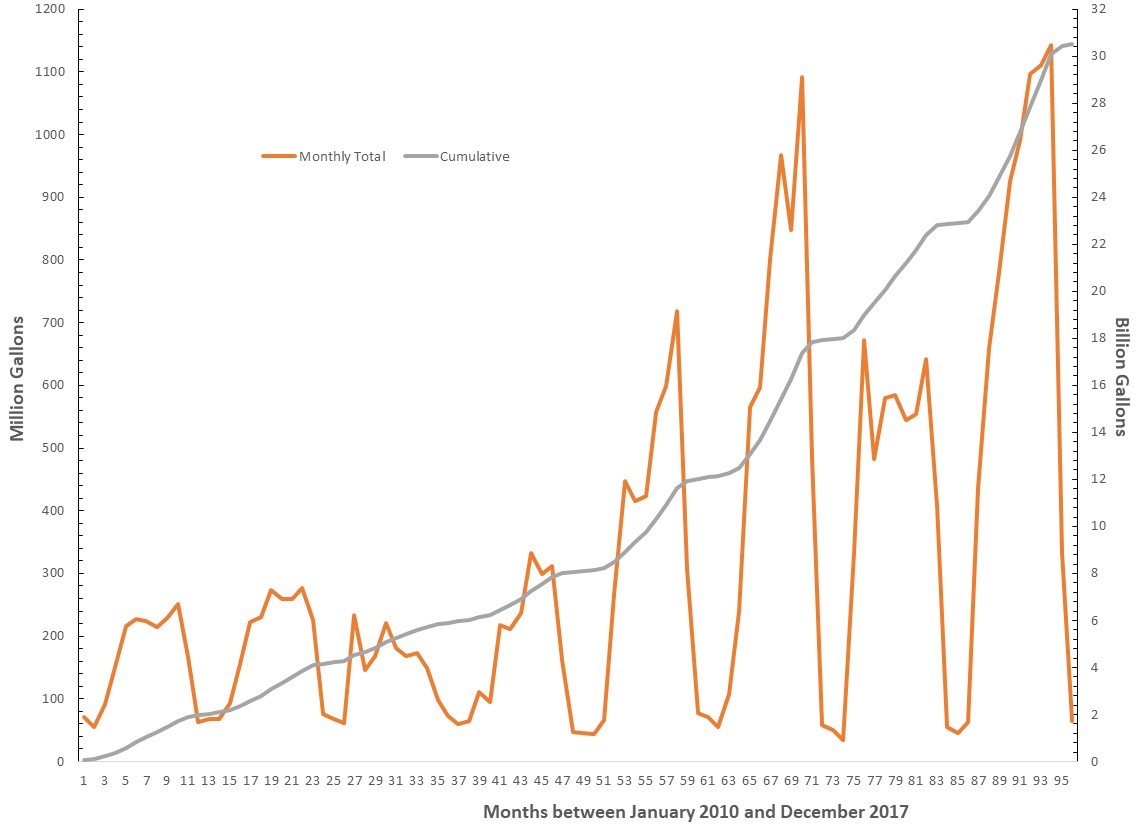
A graph of water use trends for frac sand mining which shows significant increase in monthly and cumulative water consumption
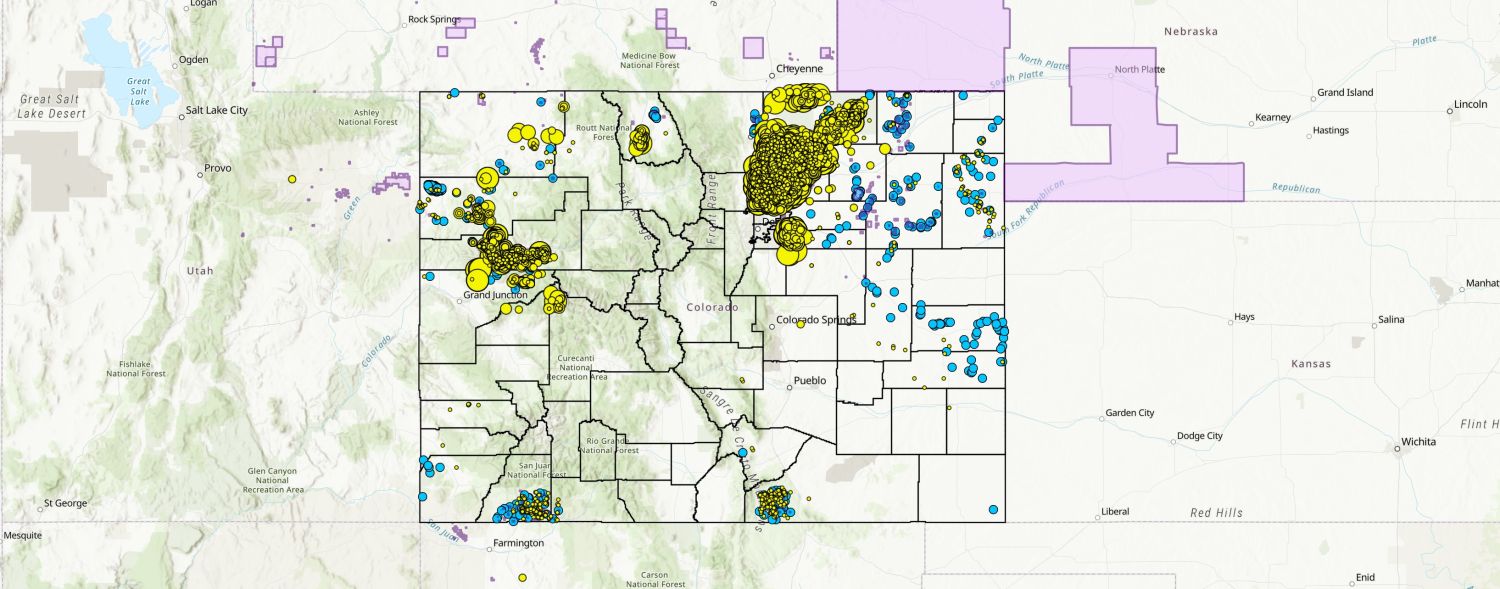
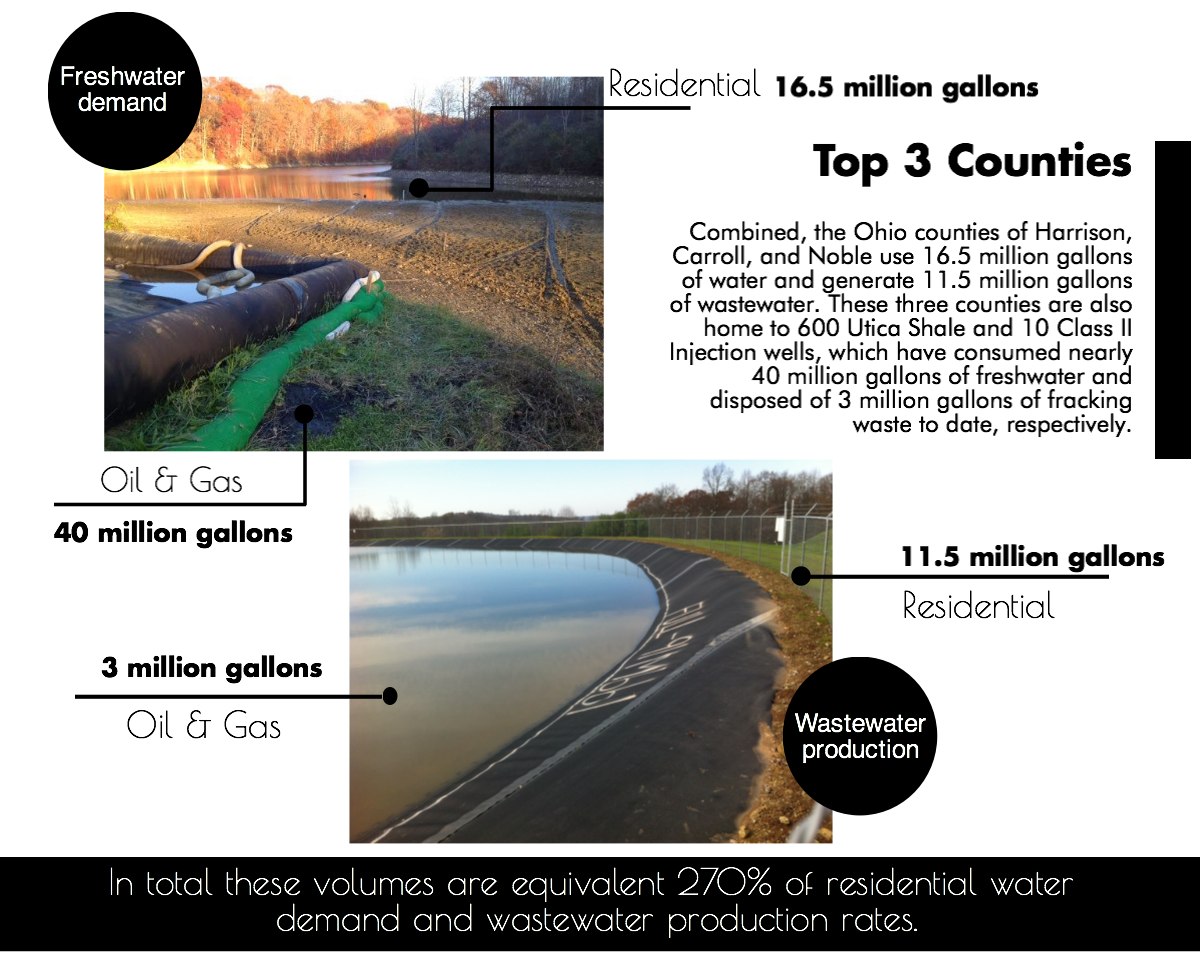
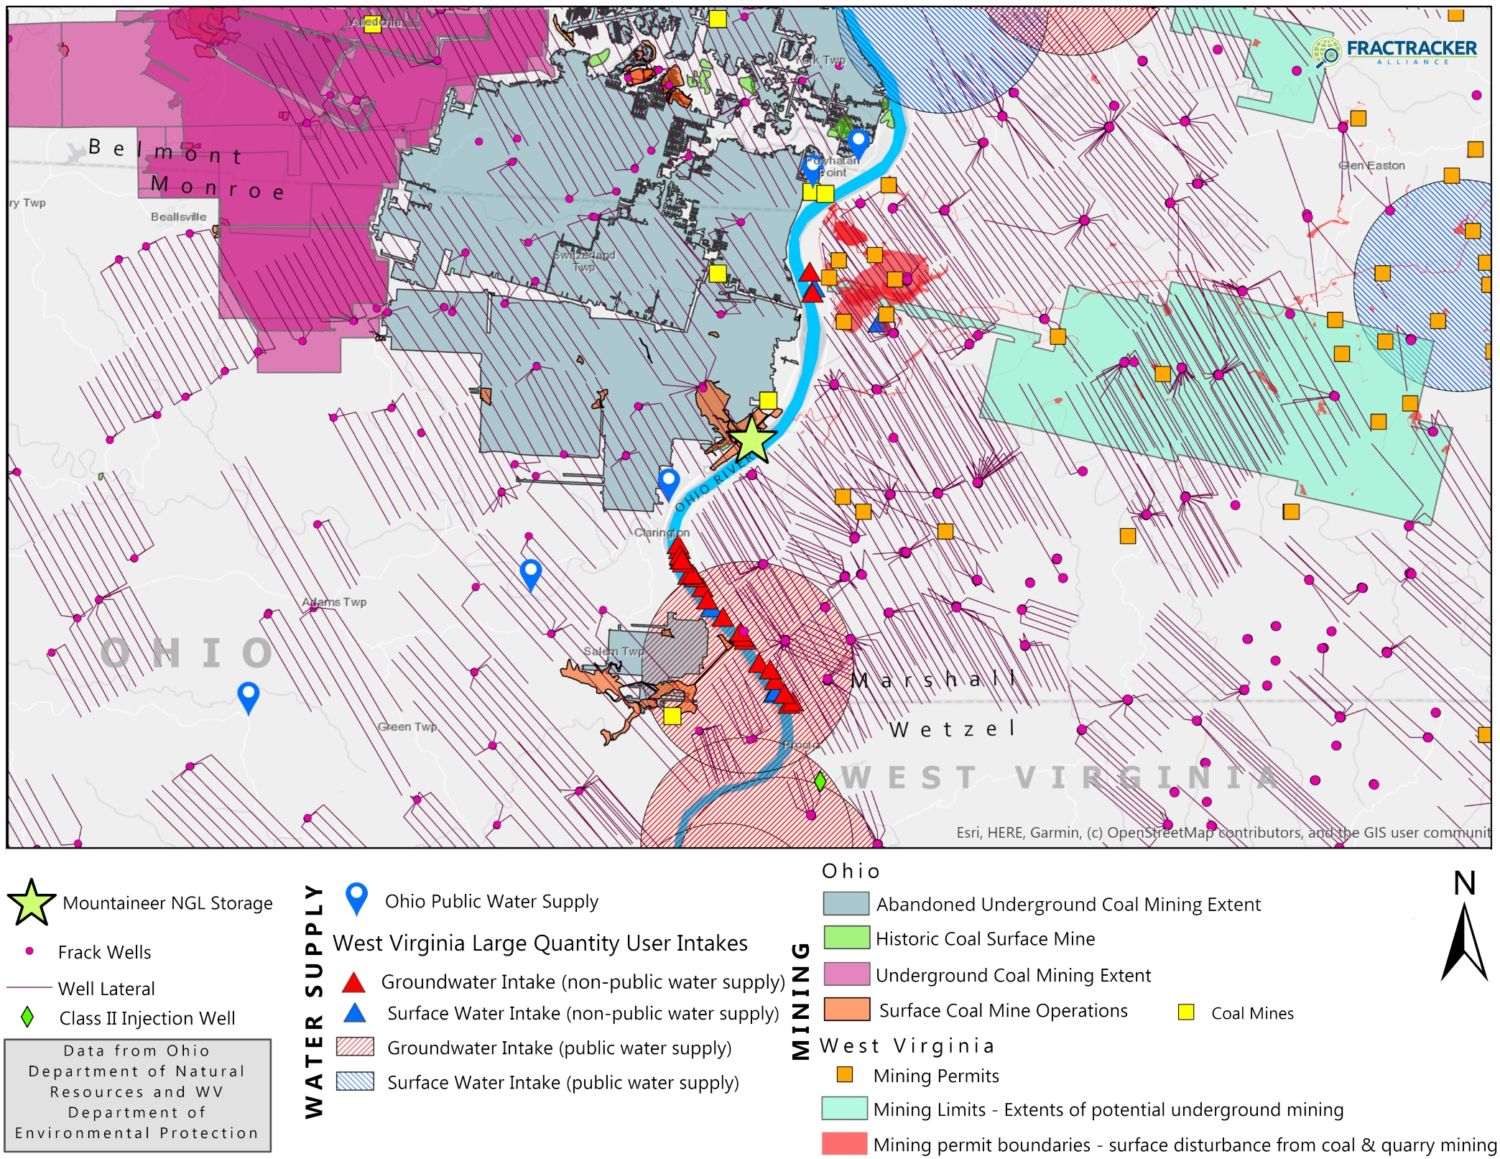
This map shows a proposed natural gas liquid storage site (the star in the center) and the water sources and fossil fuel development that surround it. This map was used to help generate comments during a public comment period for the site’s permits.
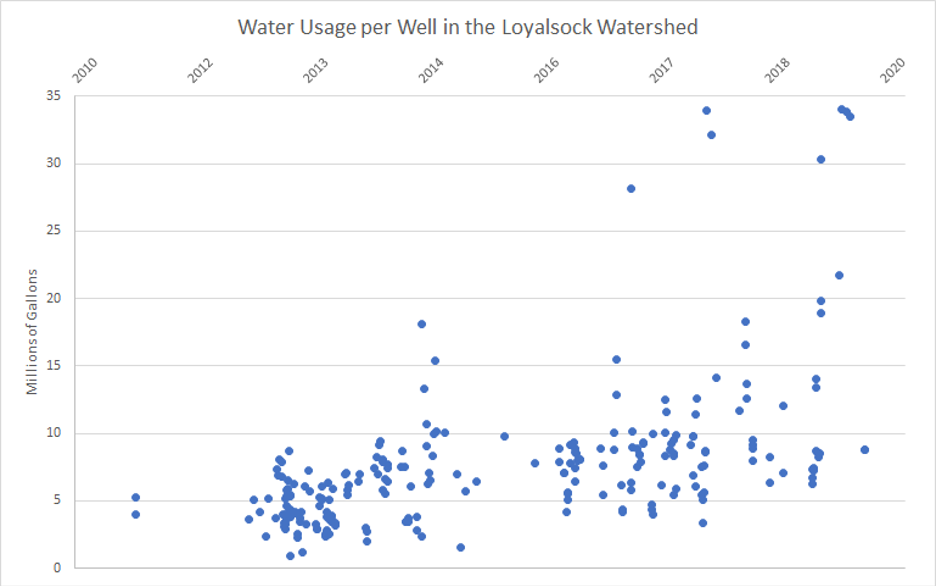
Unconventional wells in Pennsylvania were always resource-intensive, but this GIF shows that the amount of water used per well has grown significantly in recent years. In 2013, these wells used an average of 5.8 million gallons per well. By 2019, that figure had increased 145%, consuming more than 14.3 million gallons per well. This is a glimpse into the unsustainable resource demands of this industry and the decreasing energy returned on investment.
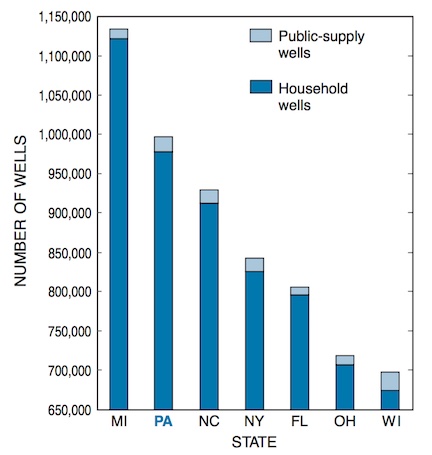
Number of household and public water supply groundwater wells by state (DCNR).
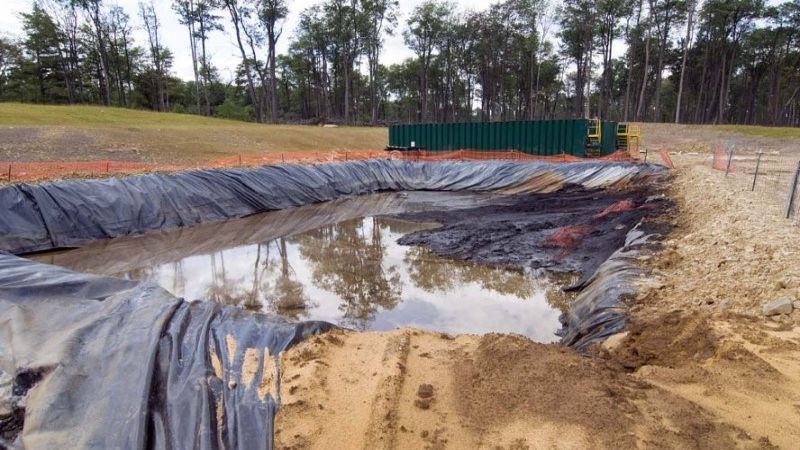
Open pits used to be permitted for temporary storage of oil and gas waste. Here, the liner is not properly covering the bottom-right corner, sludge is piled up past the liner in the top-right corner, and temporary fencing is failing in numerous locations. Photo by Barb Jarmoska.
Open pits used to be permitted for temporary storage of oil and gas waste. Here, the liner is not properly covering the bottom-right corner, sludge is piled up past the liner in the top-right corner, and temporary fencing is failing in numerous locations. Photo by Barb Jarmoska.
![]()
216 Franklin St, Suite 400, Johnstown, PA 15901
Phone: +1 (717) 303-0403 | info@fractracker.org
FracTracker Alliance is a 501(c)3 non-profit: Tax identification number: 80-0844297