Trout Unlimited Testing for Water Quality in PA’s Marcellus Region
Trout Unlimited (TU) is one of several organizations that are actively monitoring water quality in Pennsylvania’s rivers and streams. Currently, TU is collecting data in 99 different watersheds throughout the Commonwealth in an effort to help understand potential impacts of shale gas drilling and related industries on Pennsylvania’s waterways. Mitchell Blake, TU’s Pennsylvania Marcellus Shale Field Organizer explains:
Trout Unlimited’s Coldwater Conservation Corps (CCC) is a network of volunteer stream stewards who monitor water quality throughout the Commonwealth of Pennsylvania. With over 350 members trained, hailing from almost every Pennsylvania Trout Unlimited chapter, the CCC volunteers focus on achieving early detection of pollution events during oil and gas drilling and production activities and collecting a baseline inventory of data on important coldwater fisheries. Using a scientific tool that focuses on trout populations and forecasted Marcellus development, CCC volunteers strategically choose their monitoring locations within their chapter and report and map their data using Trout Unlimited’s water quality monitoring database. Protection of coldwater fisheries is an integral part of Trout Unlimited’s mission and more than any other segment of society, it is fisherman who spend considerable time on these streams, and thus are well positioned to watch over them.
While the data collection is ongoing, there are several logistical concerns involved with data digitization and distribution before the water quality data can be made available to the general public, but Mr. Blake is hopeful that these issues will be resolved in the coming months.
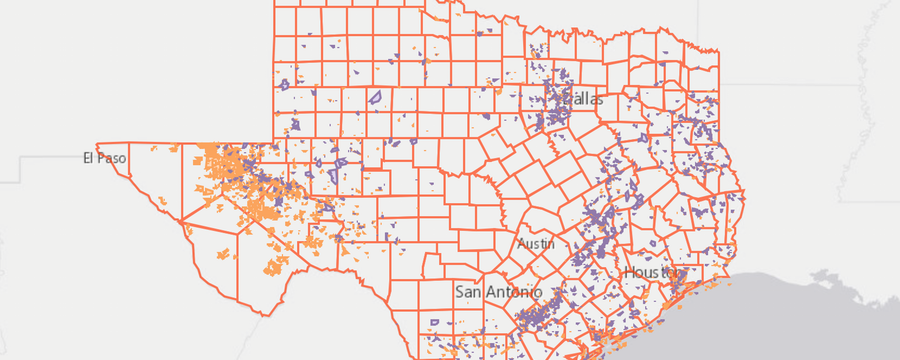
Watersheds where water quality testing is being conducted by TU volunteers are highlighted in green. For full access to map controls, please click the expanding arrows icon at the top right corner of the map.
At the FracTracker Alliance, we are excited to see TU’s desire to share this data with the public. It may seem like a thankless task to brave the elements to obtain baseline water quality data, but it is important work that everyone can benefit from. And while everyone hopes never to find the proverbial “smoking gun” in terms of streams being negatively impacted by industry, data collection efforts such as these are invaluable resources in identifying potential contamination events, should they occur.


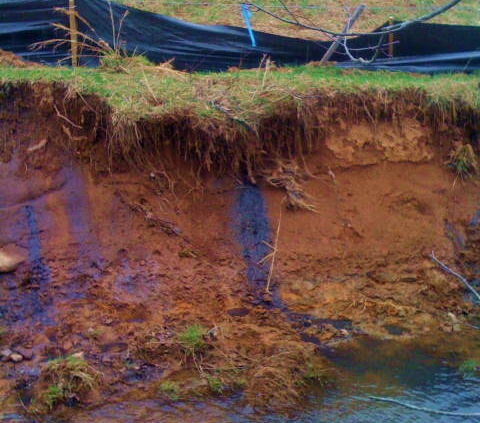
 Wetzel County Action Group photo, copyright of Ed Wade, Jr.")

")


. - Click to enlarge")
 - Click to enlarge")