A Fresh Look at Oil and Gas Drilling from Europe
By Ted Auch, Kyle Ferrar, and Samantha Rubright with Max Gruenig
Fourteen days is not nearly enough time to fully understand the complex differences between oil and gas drilling issues and policies in the United States and several European Union countries. The EU’s drilling policies, geography, and the industry’s level of activity are quite distinct from those of the States in some cases. Still, as part of the Our Energy Solutions project, four staff from FracTracker Alliance and Ecologic Institute attempted to understand and share as many lessons-learned in Europe as we could in the first two weeks of September. Our interest covered all aspects of oil and gas development, but focused on those relating to the use of stimulation techniques (hydraulic fracturing – fracking) in unconventional reservoirs. Even with significant differences between the US and EU, there is still much to be gleaned in sharing our regulatory approaches, community concerns, and environmental challenges.
“Chaos is merely order waiting to be deciphered” ― José Saramago, The Double
London, England Meetings
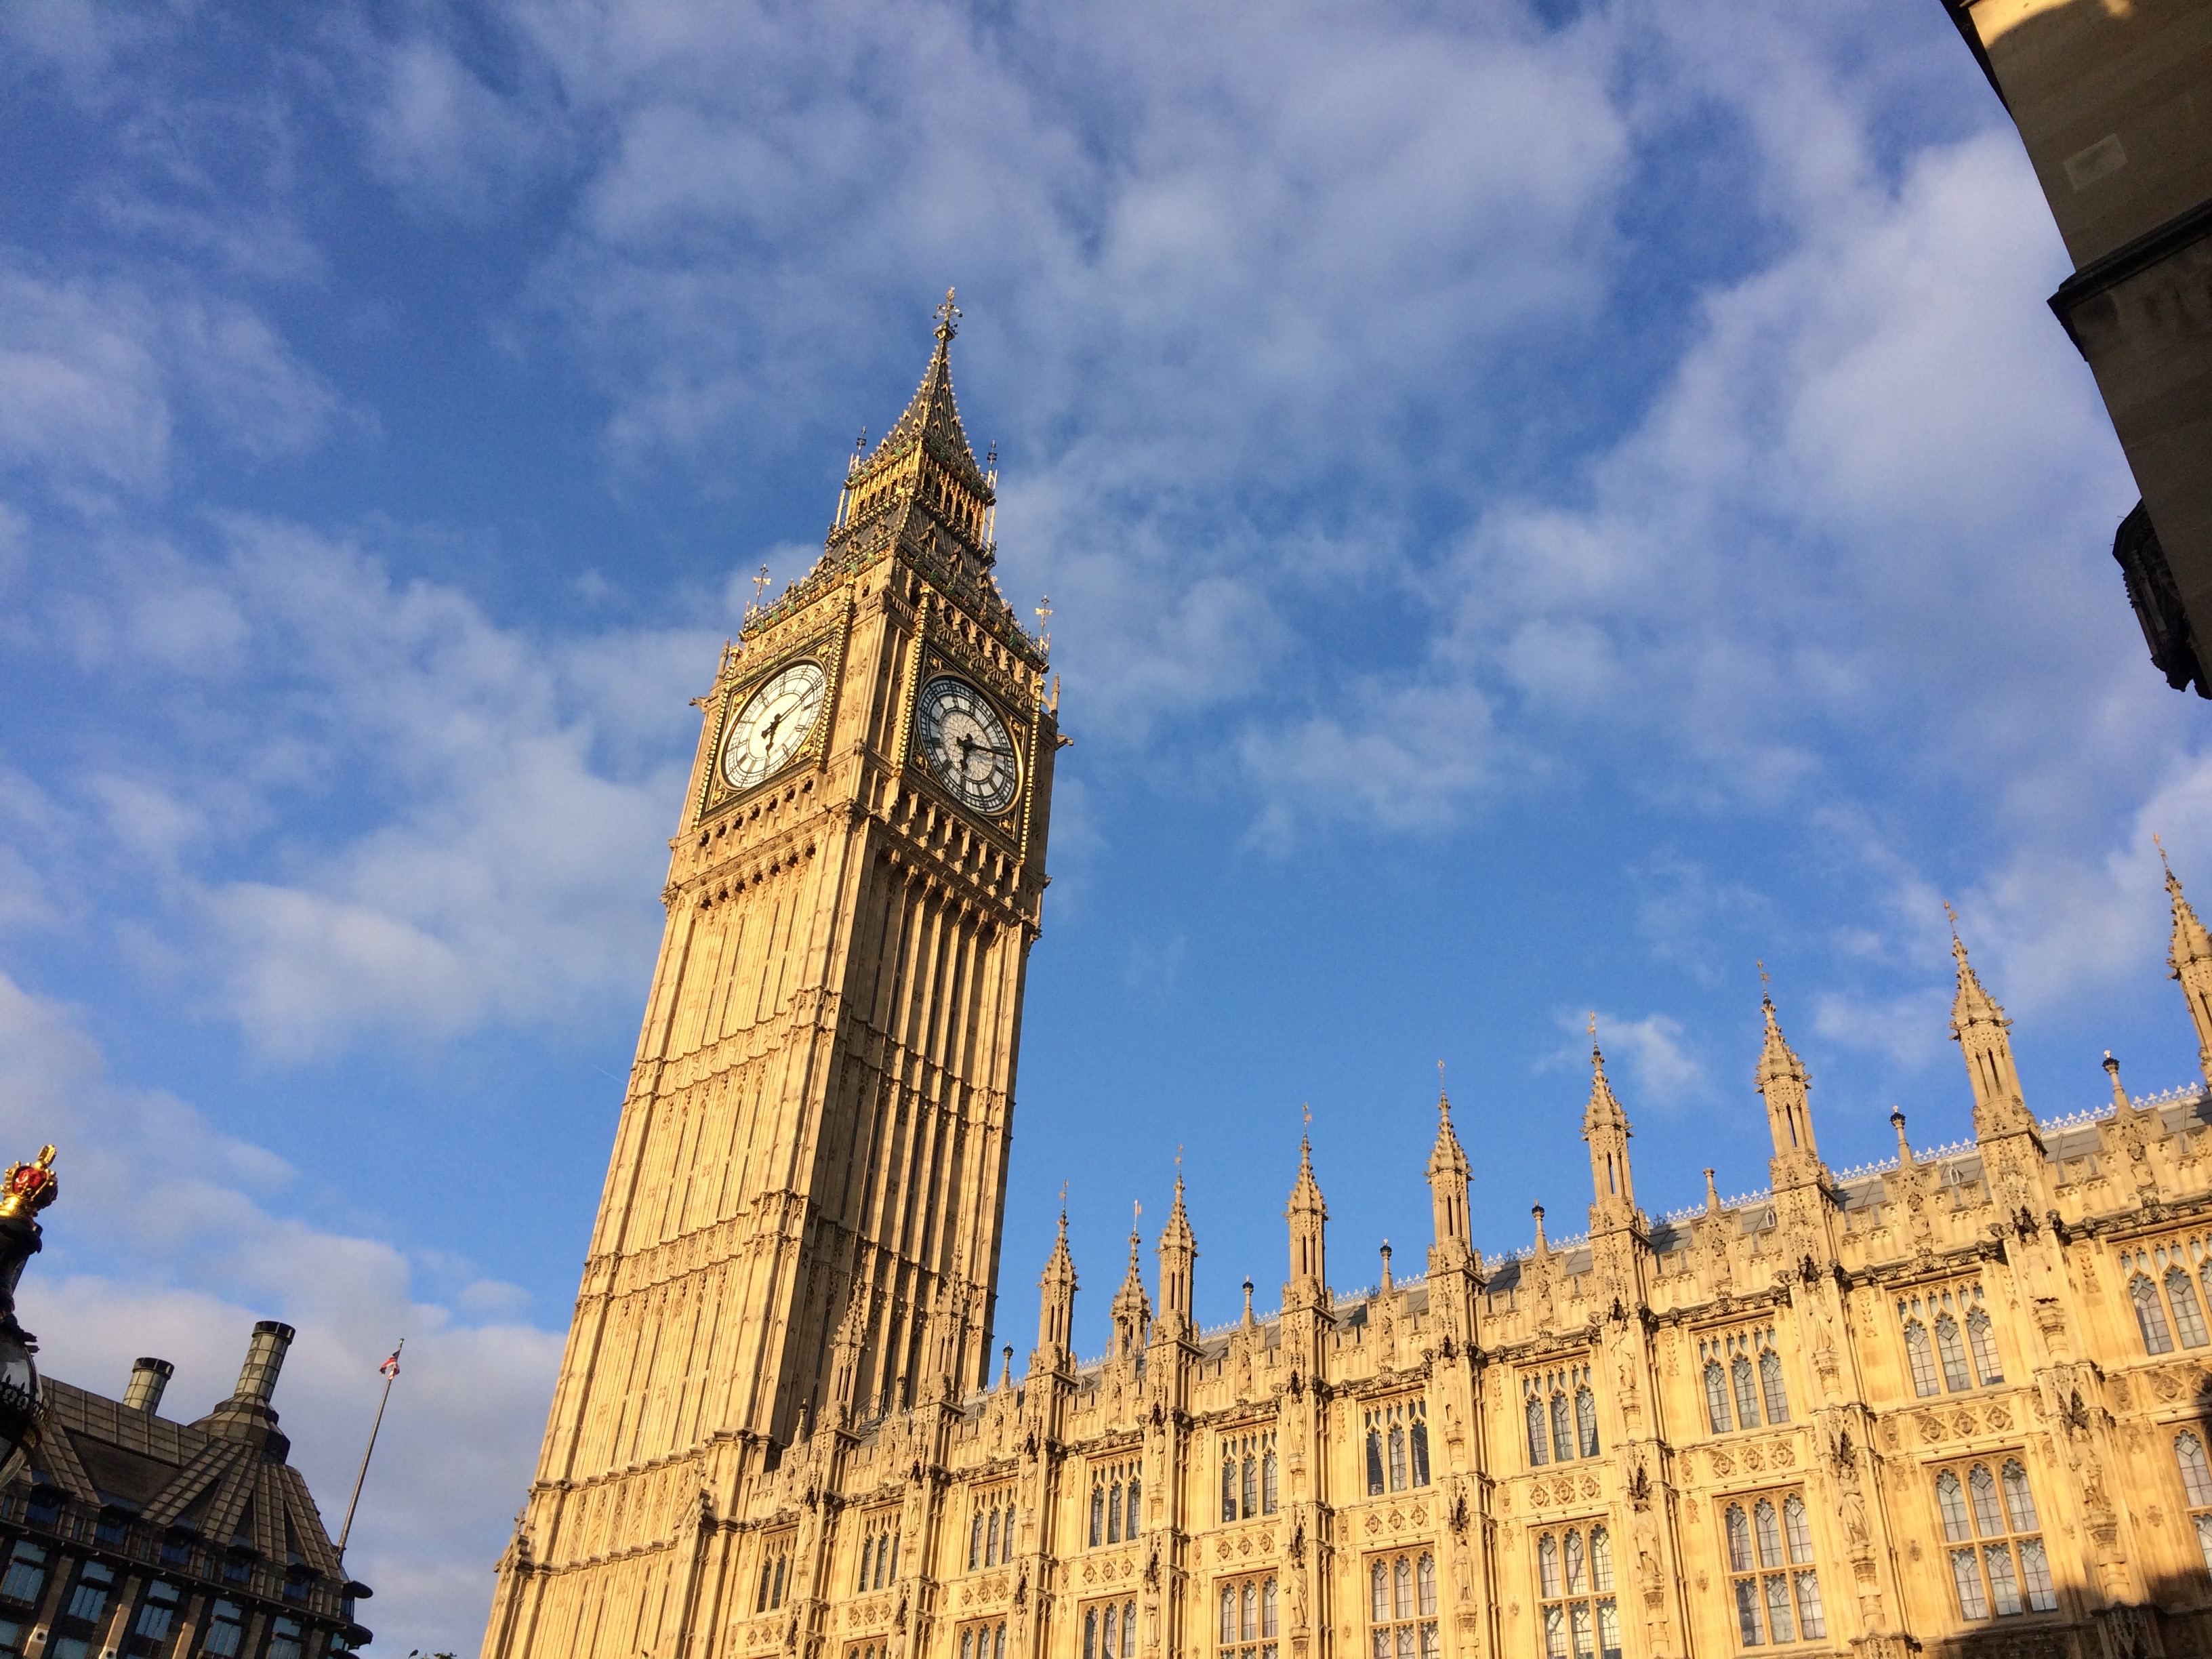
The House of Commons meeting was held in Parliament, just below London’s Big Ben. Photo by Sam Rubright
Our European tour started in London with Ecologic Institute’s Max Gruenig. The first stop was a meeting with University of Salford Professor of Regeneration and Sustainable Development Erik Bichard outside of The Palace of Westminster. Erik has worked extensively to understand and chronicle common threads that weave together community response(s) to hydraulic fracturing (fracking) proposals. Much of Erik’s research in the UK has focused on the efforts of the leading shale gas extraction company in the EU, Cuadrilla Resources, to employ hydraulic fracturing technologies, as well as local oppositions to this development. The major points of contention are in Lancashire County, Northwest England and Balcombe in West Sussex. Erik pointed to the fact that Cuadrilla admitted their claims that the 4% decline in UK energy cost was a result of Lancashire oil and gas exploitation were significantly overstated. Such manipulative statements appear to be cut directly from North American energy’s playbook.
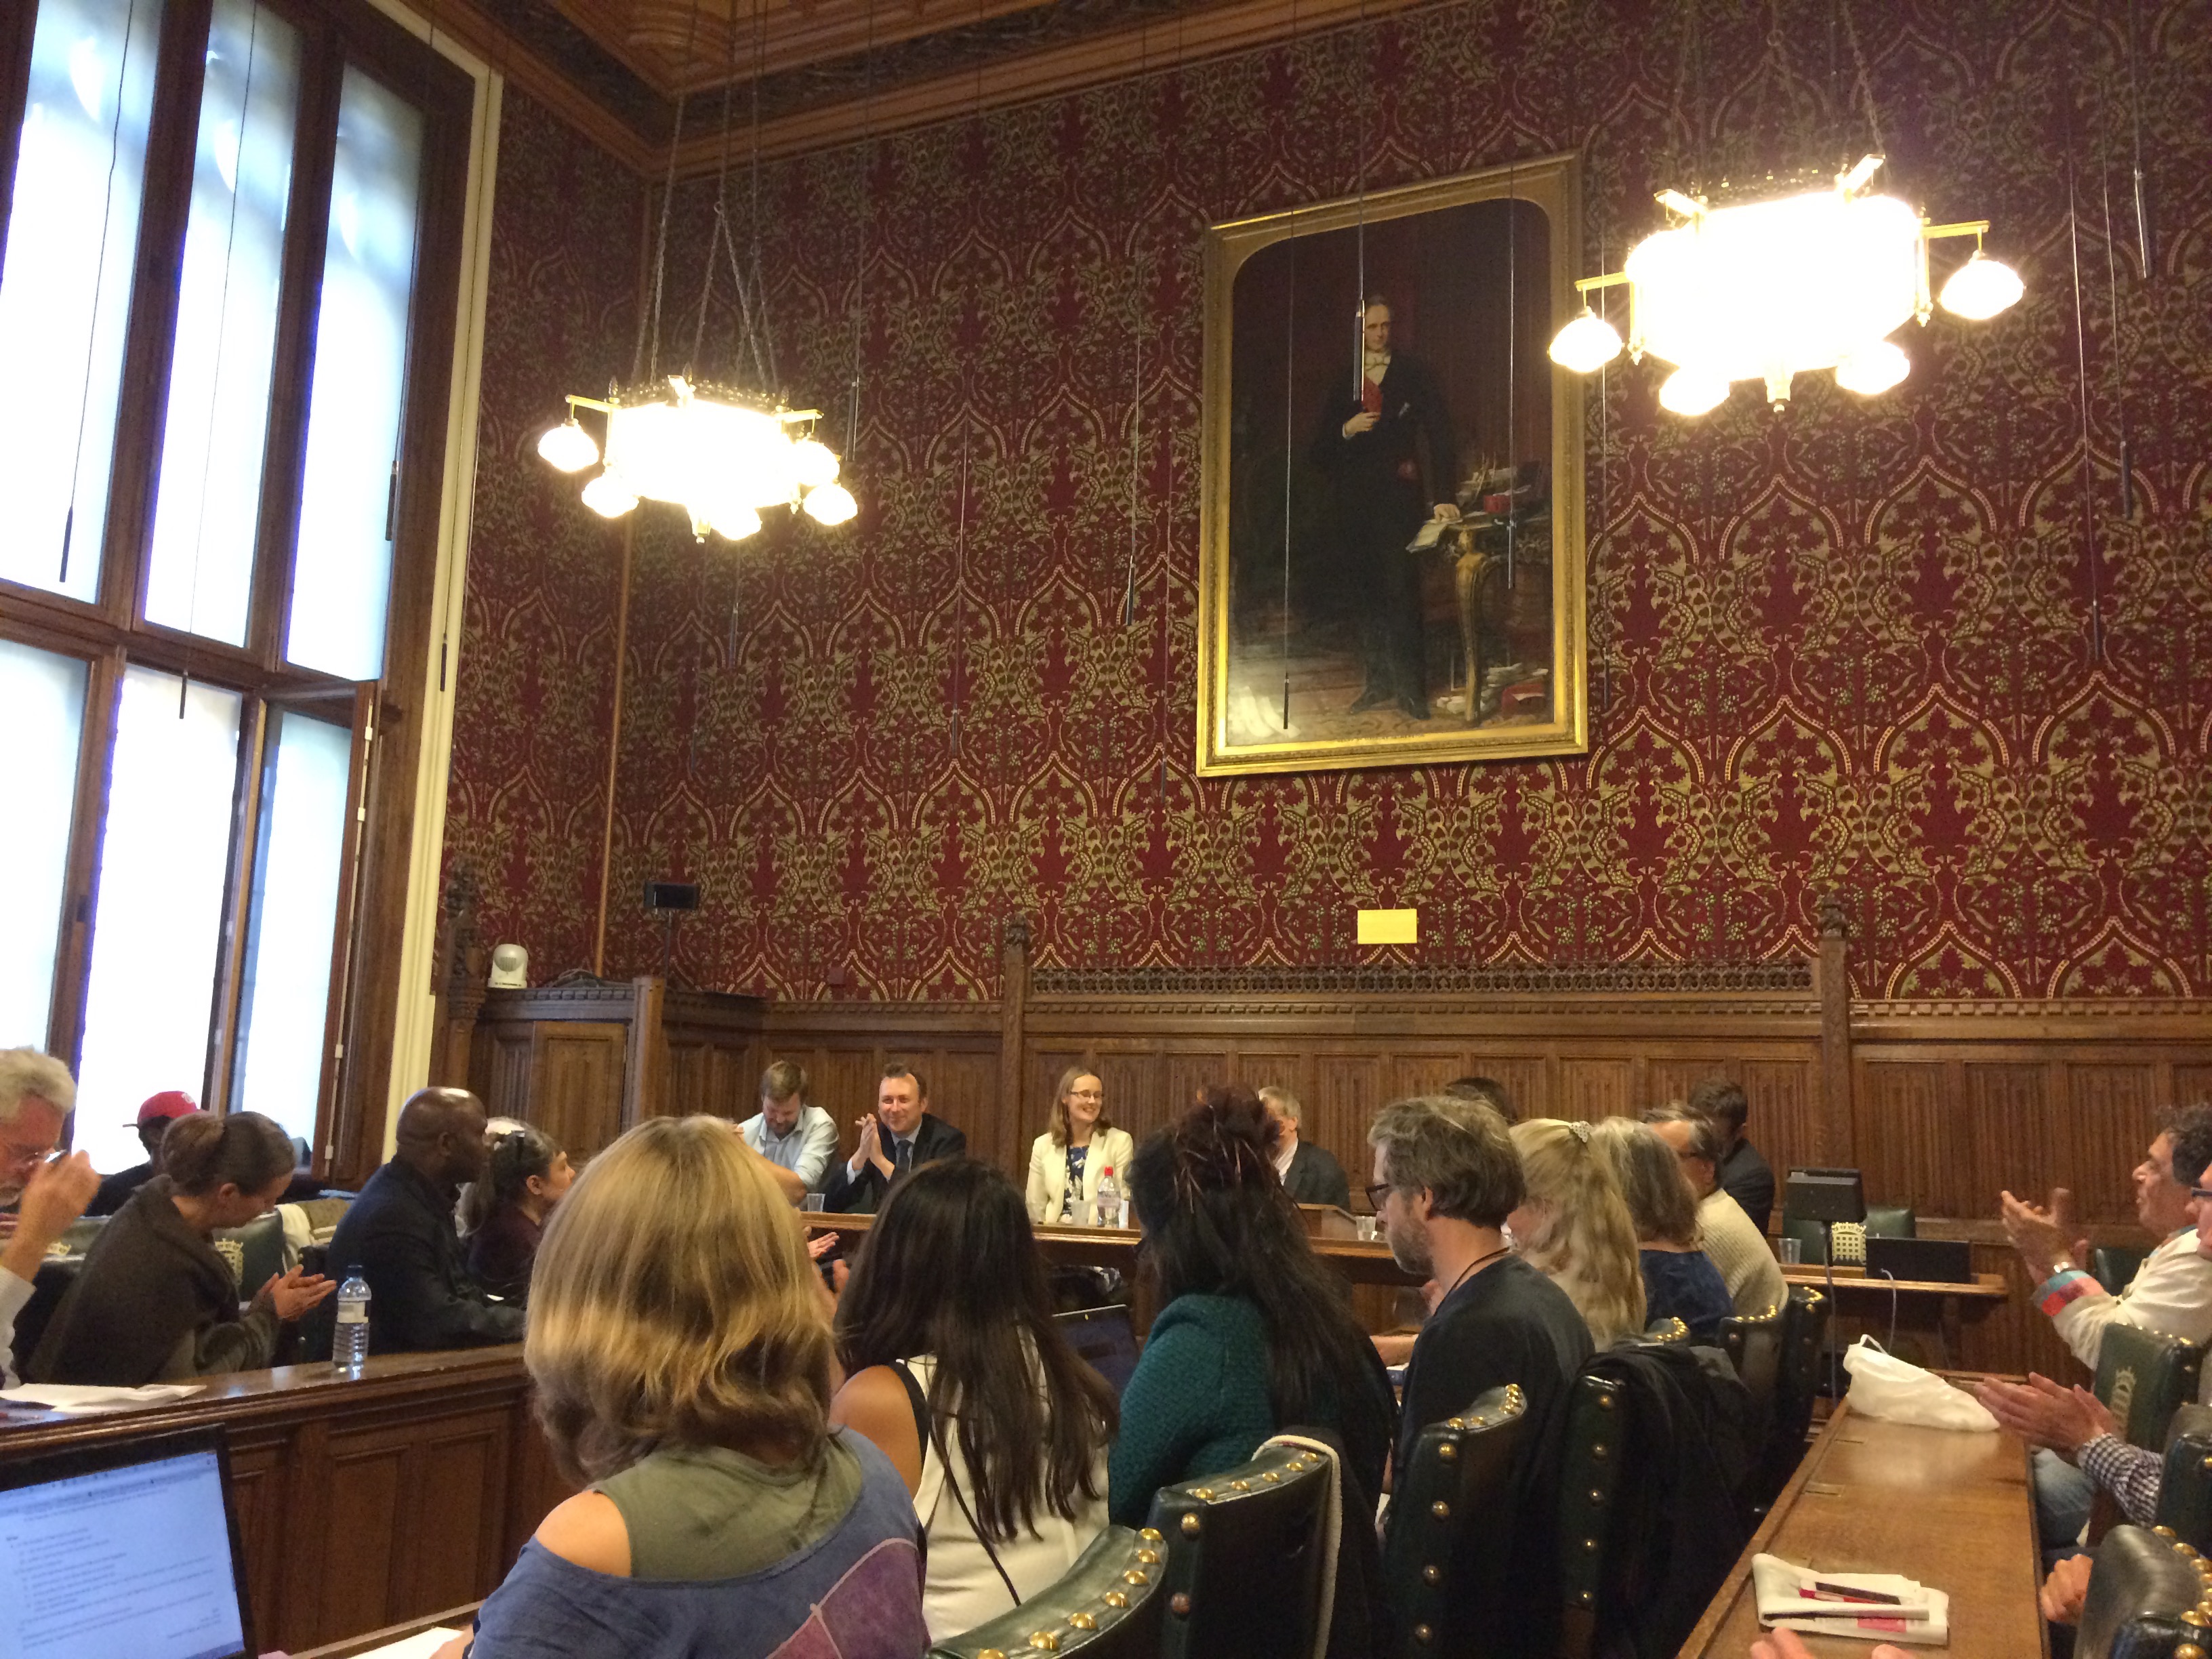
House of Commons meeting, London. Photo by Sam Rubright
We then attended a spirited Fracking with Nature Meeting at The House of Commons hosted by 21st Century Network and convened by MP Cat Smith (photo right). Many, if not all, of the attendees were concerned about the negative impacts of fracking and oil and gas development in general, but perhaps the event’s purpose self-selected for those attendees. We found the conversations to be very advanced considering that the UK has not seen nearly the same level of oil and gas activity as the US. Most questions centered on the potential for fracking to negatively impact ground water, followed by the induction of earthquakes. Air quality was not discussed as often, despite the serious risks that oil and gas air pollutants pose to health, and the frequency and severity of ambient degradation reported in the US. With the UK’s move to cut subsidies for renewables and a push toward fracking, these concerns may soon become a reality.
We later met with one of the speakers at the House of Commons meeting, Damien Short LLB, MA, PhD, Director of the University of London’s Human Rights Consortium[1] and the Extreme Energy Initiative.[2] NGO’s, we learned, are on the forefront of the issue, debating the need to prioritize community health over corporate profits. They have had quite a lot of success on this front, despite Tory projections.[3] The past state of UK politics under the direction of PM David Cameron, was supportive of extractive industries and corporate interests, blocking any attempt to introduce regulations. Even with the defeat of David Cameron’s administration, new “fast-tracking” rules to accelerate permits for fracking passed in August.[4] The overwhelming victory of democratic socialist Jeremy Corbyn as the leader of the opposition Labour Party – means that the tenure of the current fracking moratoria in North Yorkshire, as well as in Scotland, Wales, and Northern Ireland[5] could be brief.
Our time in London was filled with several other meetings, including one with Greenpeace UK’s new fracking coordinator, Hannah Martin. During our meeting she indicated that while Greenpeace was sympathetic to the views and tactics of Mr. Corbyn, they were concerned that his election would further divide Labour. In her opinion this change could allow the oil and gas sympathetic – and united – Tories to expedite their vision for fracking in the UK.
Regardless of the similarities between community concerns and industry tactics, however, one difference between the UK and US was crystal clear; no matter their view on the use of fracking, Brits support a substantial Petroleum Revenue Tax (PRT) rate to the tune of 50-60%. The PRT will fall to 35% in January, 2016, however. This latter figure is a sizeable decrease but would still be 40% higher than the average in the US. California for example, the fourth largest producing state, does not and has never levied a severance tax.[6] Unfortunately, the UK is seeing similar conflict of interest issues and deliberate attempts to de-democratize the rule-making around fracking, as demonstrated in a recent move to prevent a proper parliamentary debate about drilling under protected areas in the UK.
Brussels, Belgium Workshop and Meeting
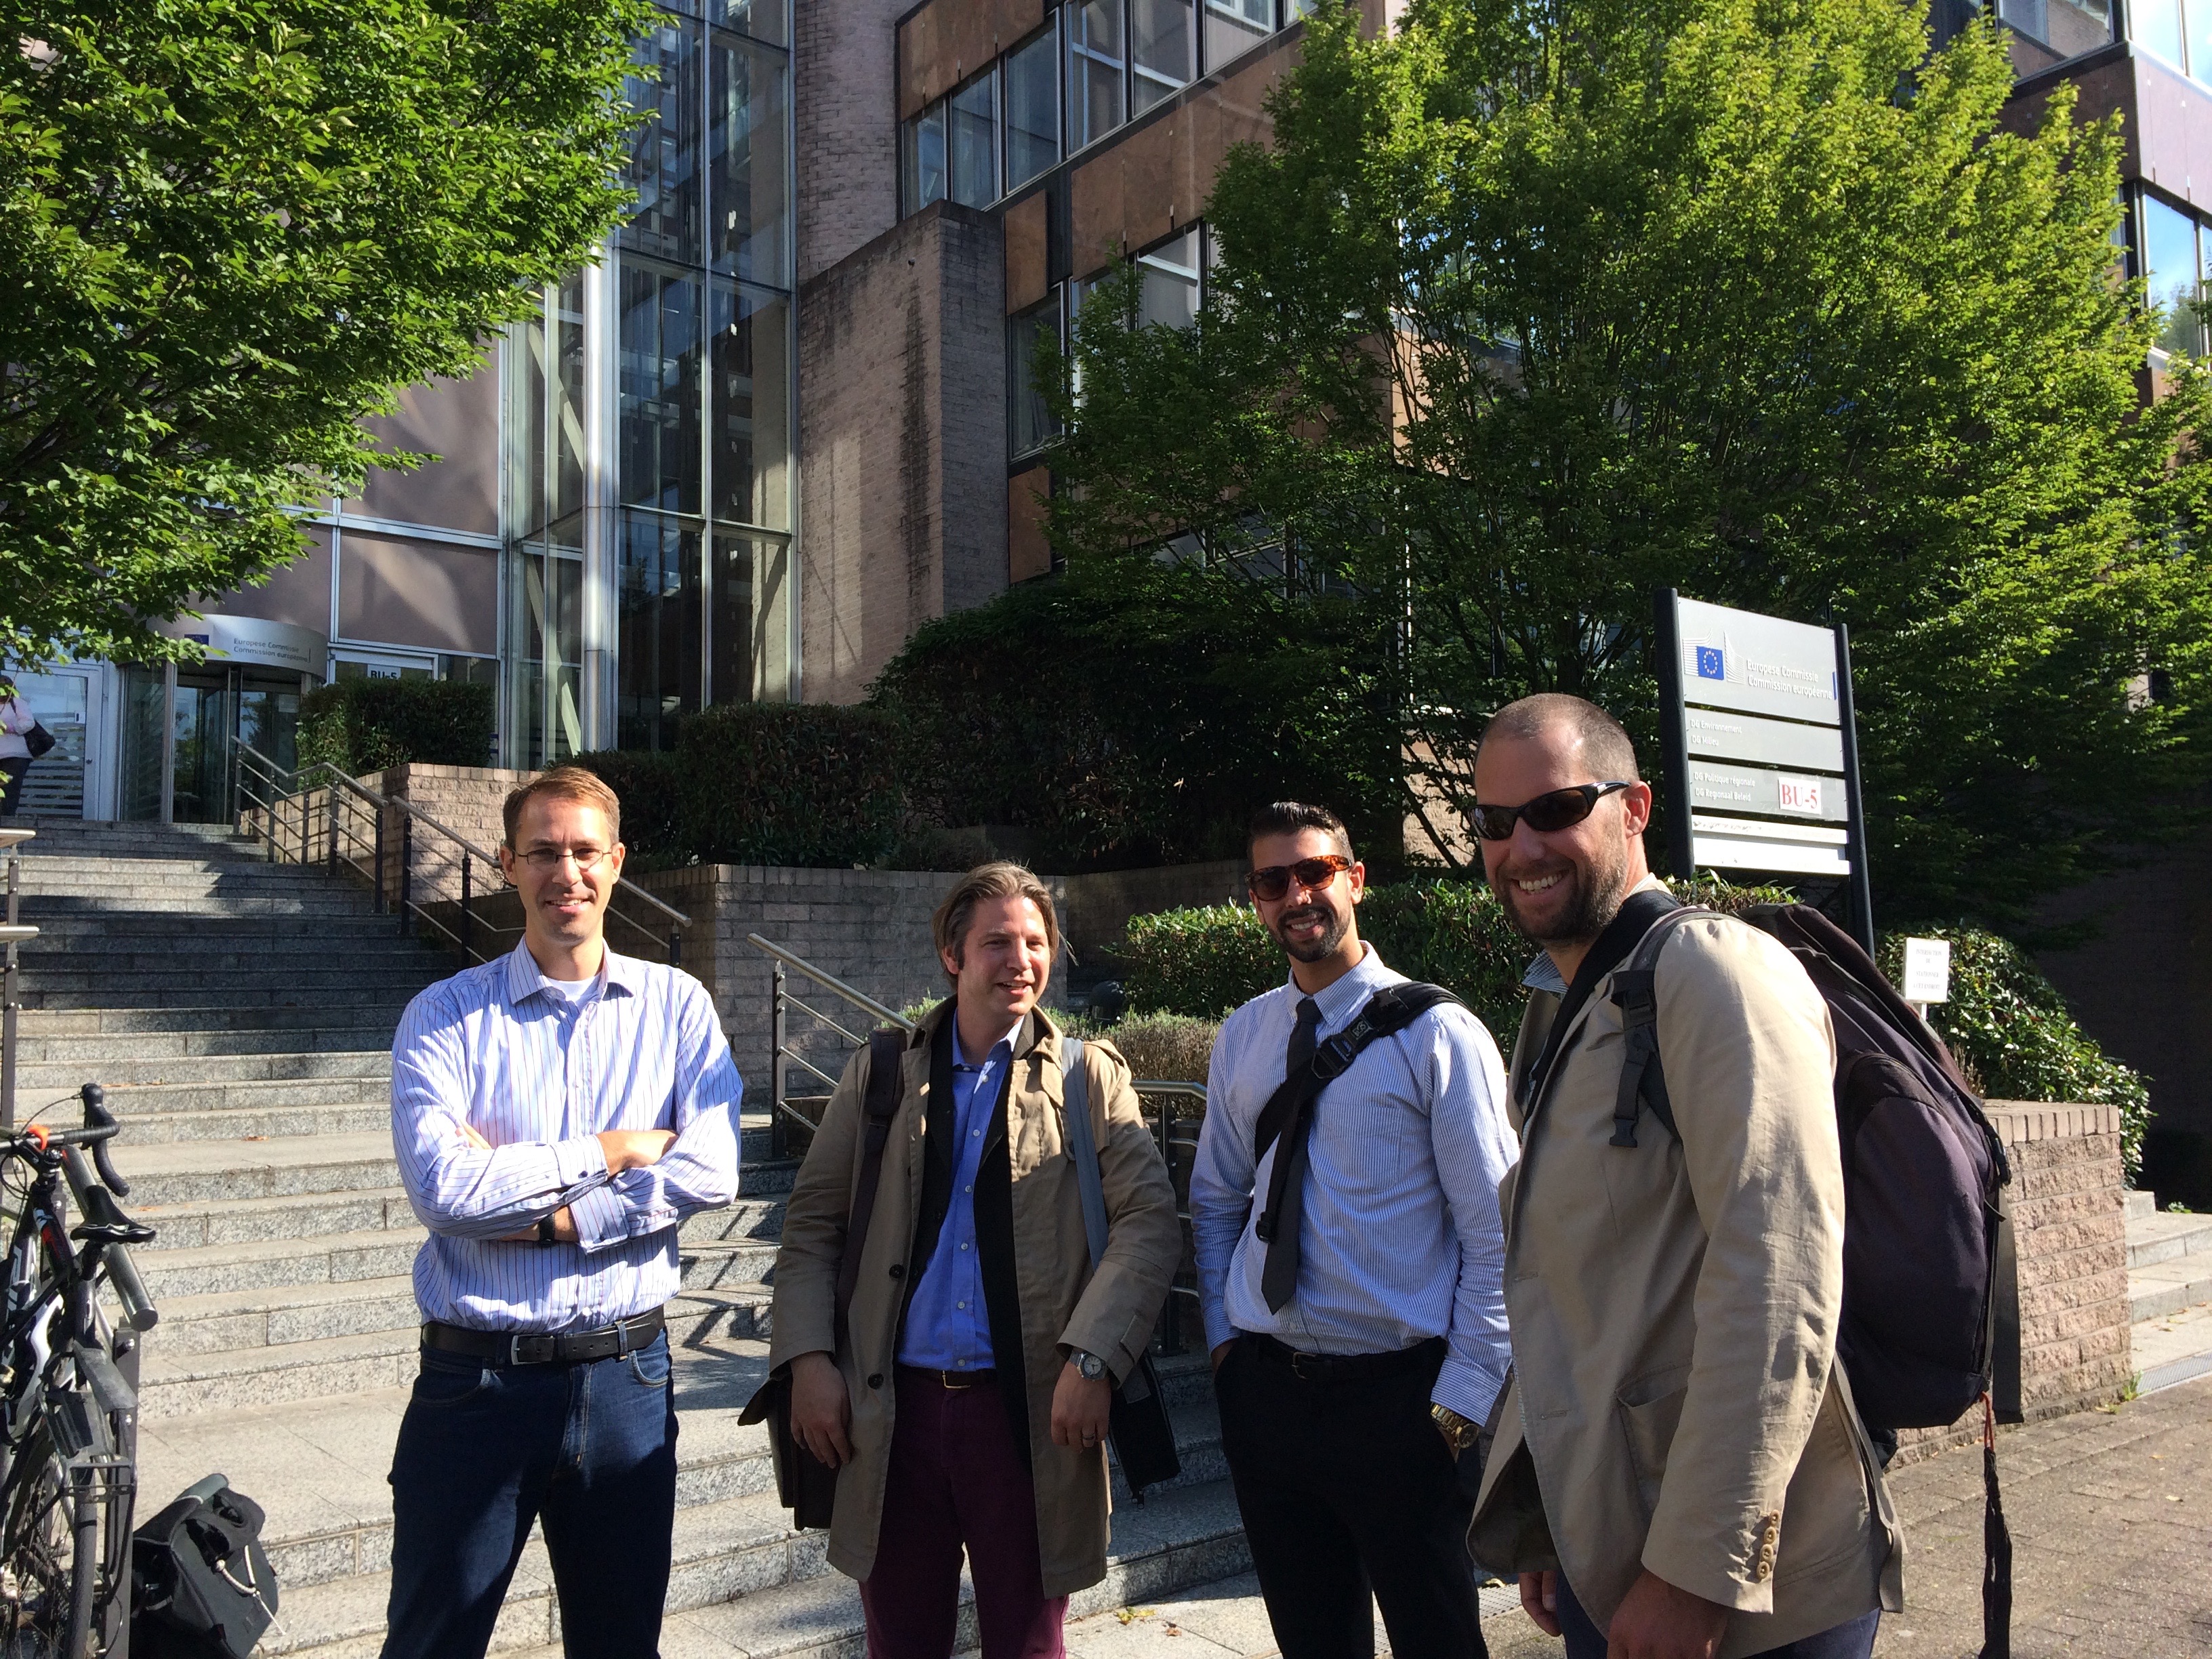
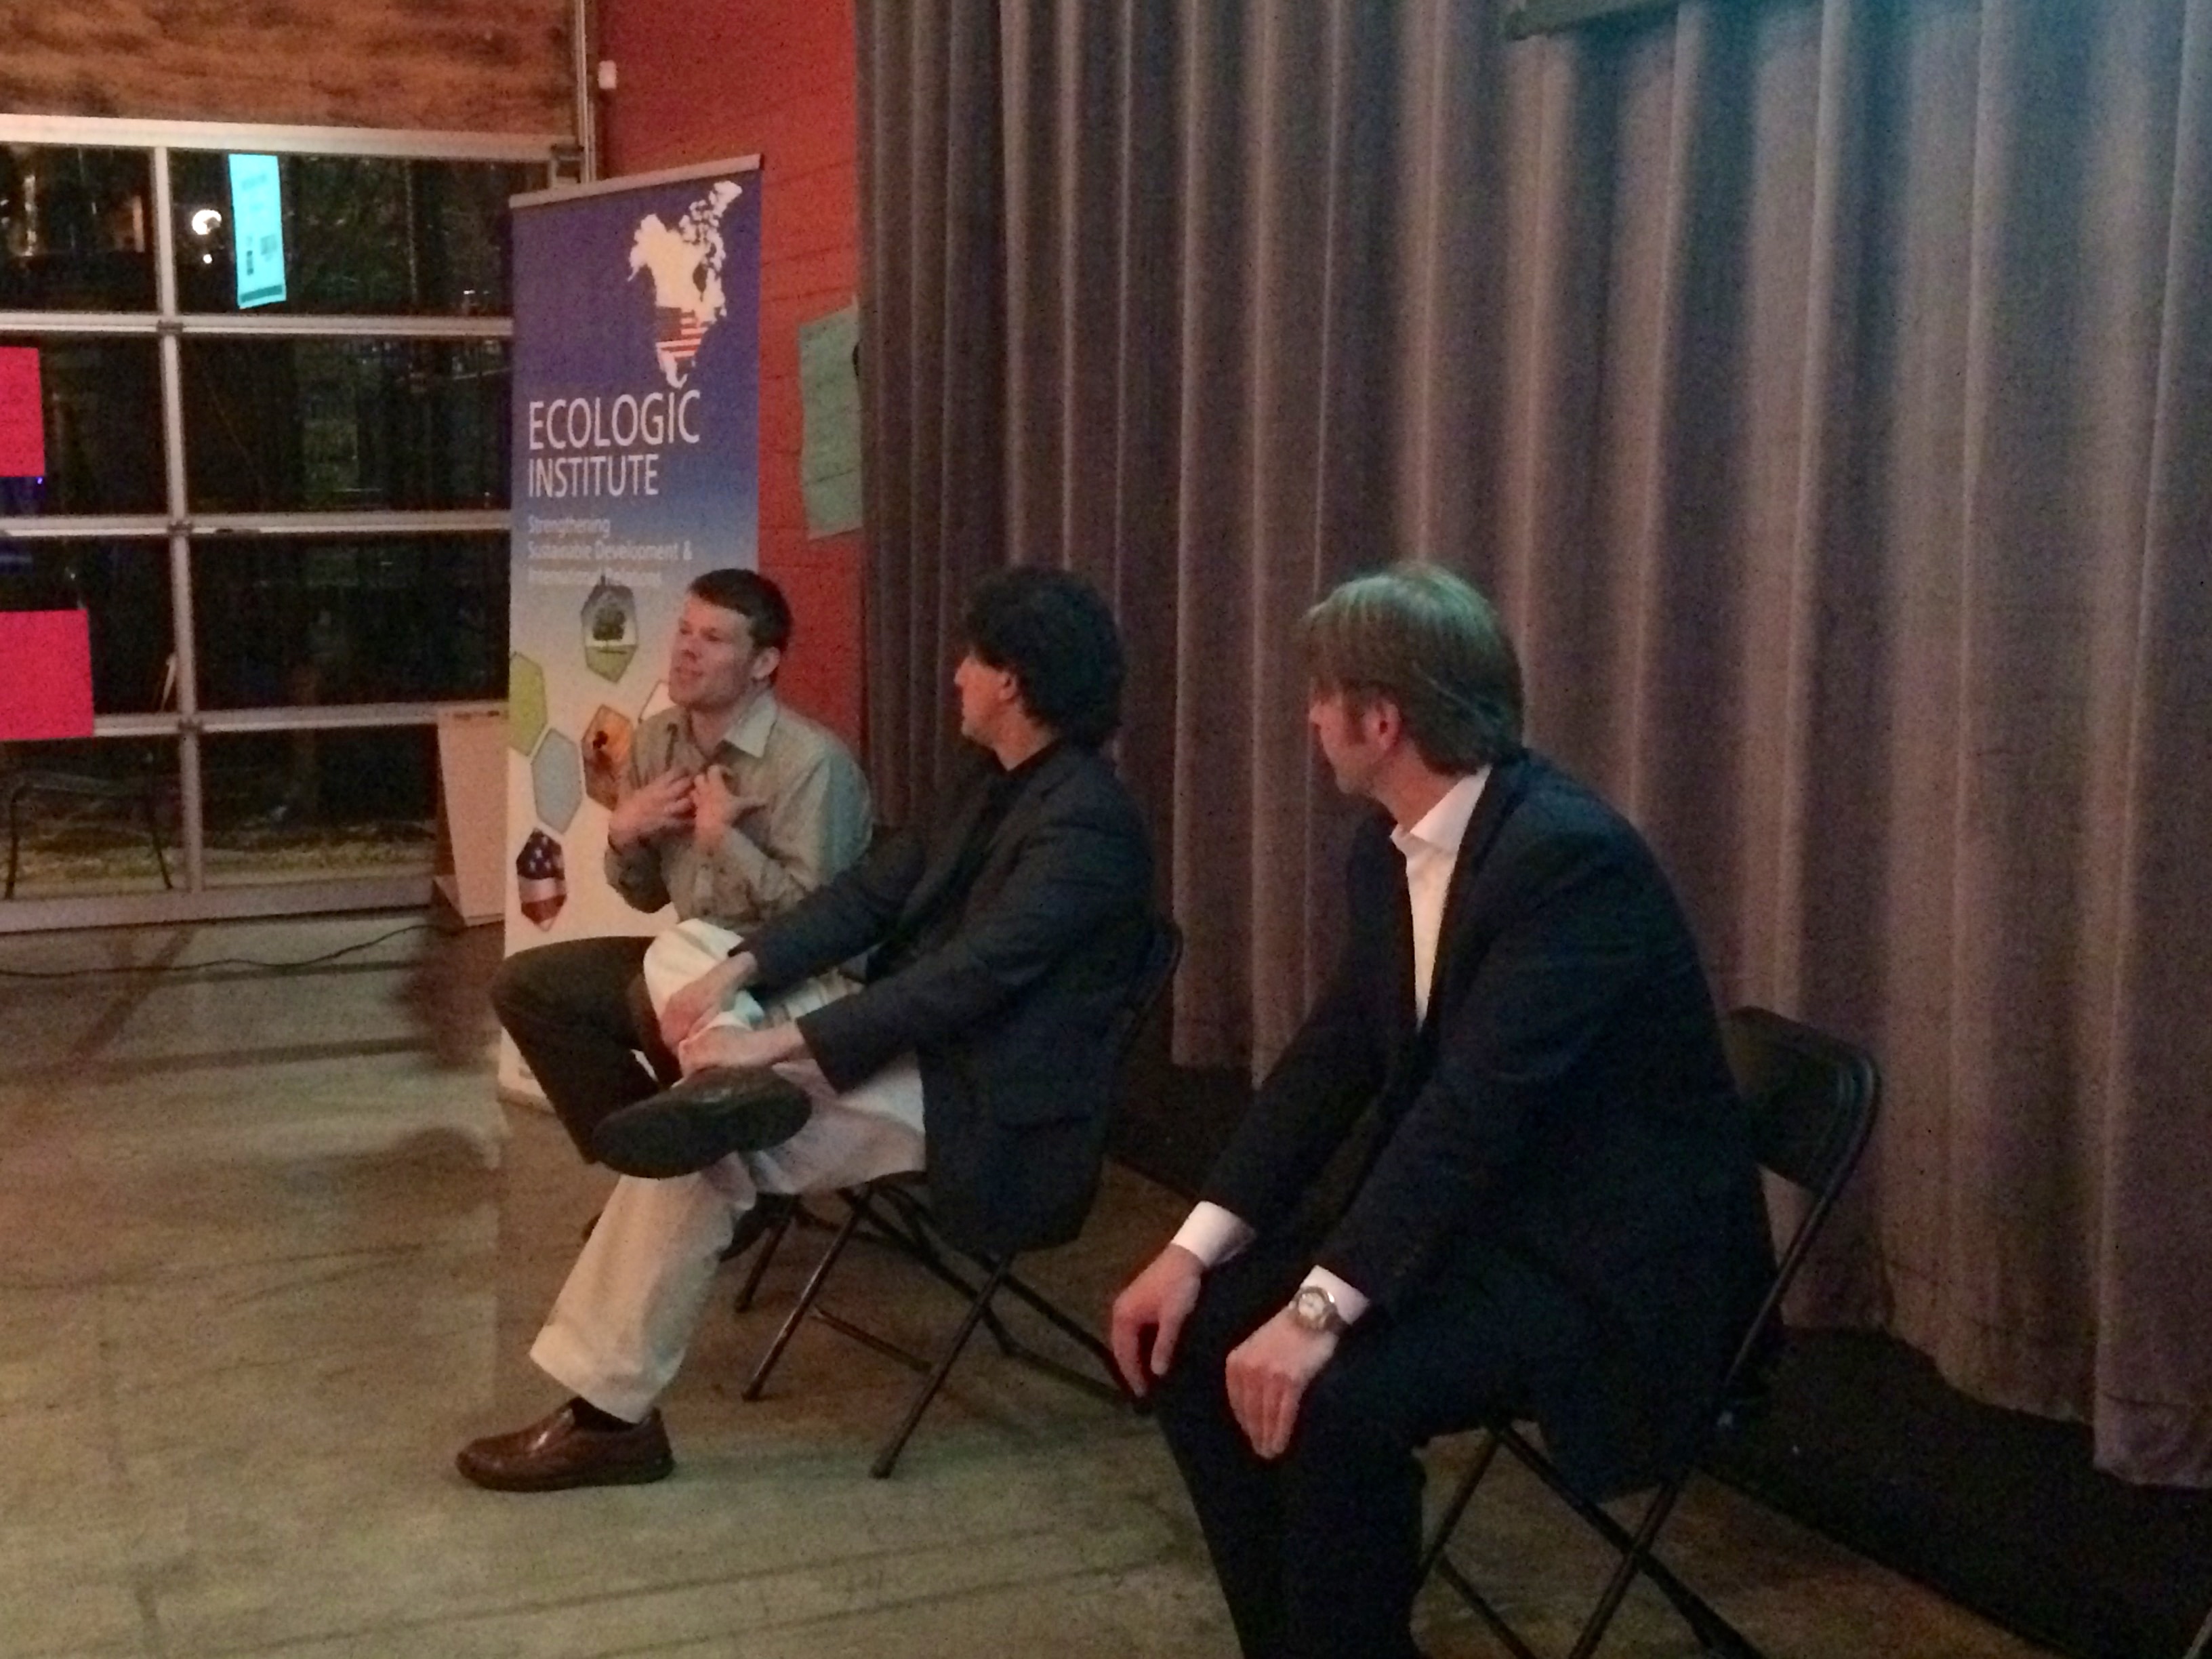
Geert, Max, Kyle, and Ted after our meeting with the European Commission in Brussels. Photo by Sam Rubright
The next phase of OES Europe took us to Brussels to host a community workshop and meet with members of the European Commission’s Directorate-General for Environment. Both events brought to light many concerns and questions about drilling’s safety.
The European Commission is currently drafting a best available techniques reference document (BREF) regarding hydrocarbon extraction for the European Union to consider in December 2015. The recommendations will build upon the “Minimum Principles,” published in January, 2014.[7] Representatives from the European Commission asked us about a variety of concerns that have arisen from drilling in the US, and how Europe might have similar or different experiences. The Commission was most interested in environmental health risks and research focused on exposure to air pollutants, as well as other degraded environmental media (drinking water, soil, etc.). We also shared figures about water consumption, land use, and waste management. It was immediately apparent that the lack of high quality publicly accessible data in the US is making it very difficult for the Commission to make well-informed decisions or policy recommendations. This meeting was arranged by Geert De Cock, of Food and Water Europe, and – interestingly – was one of the first times that the European Commission met with non-industry representatives. (Several major oil and gas players have offices near the European Commission’s in Brussels.)
Rotenburg (Wümme), Germany Workshop
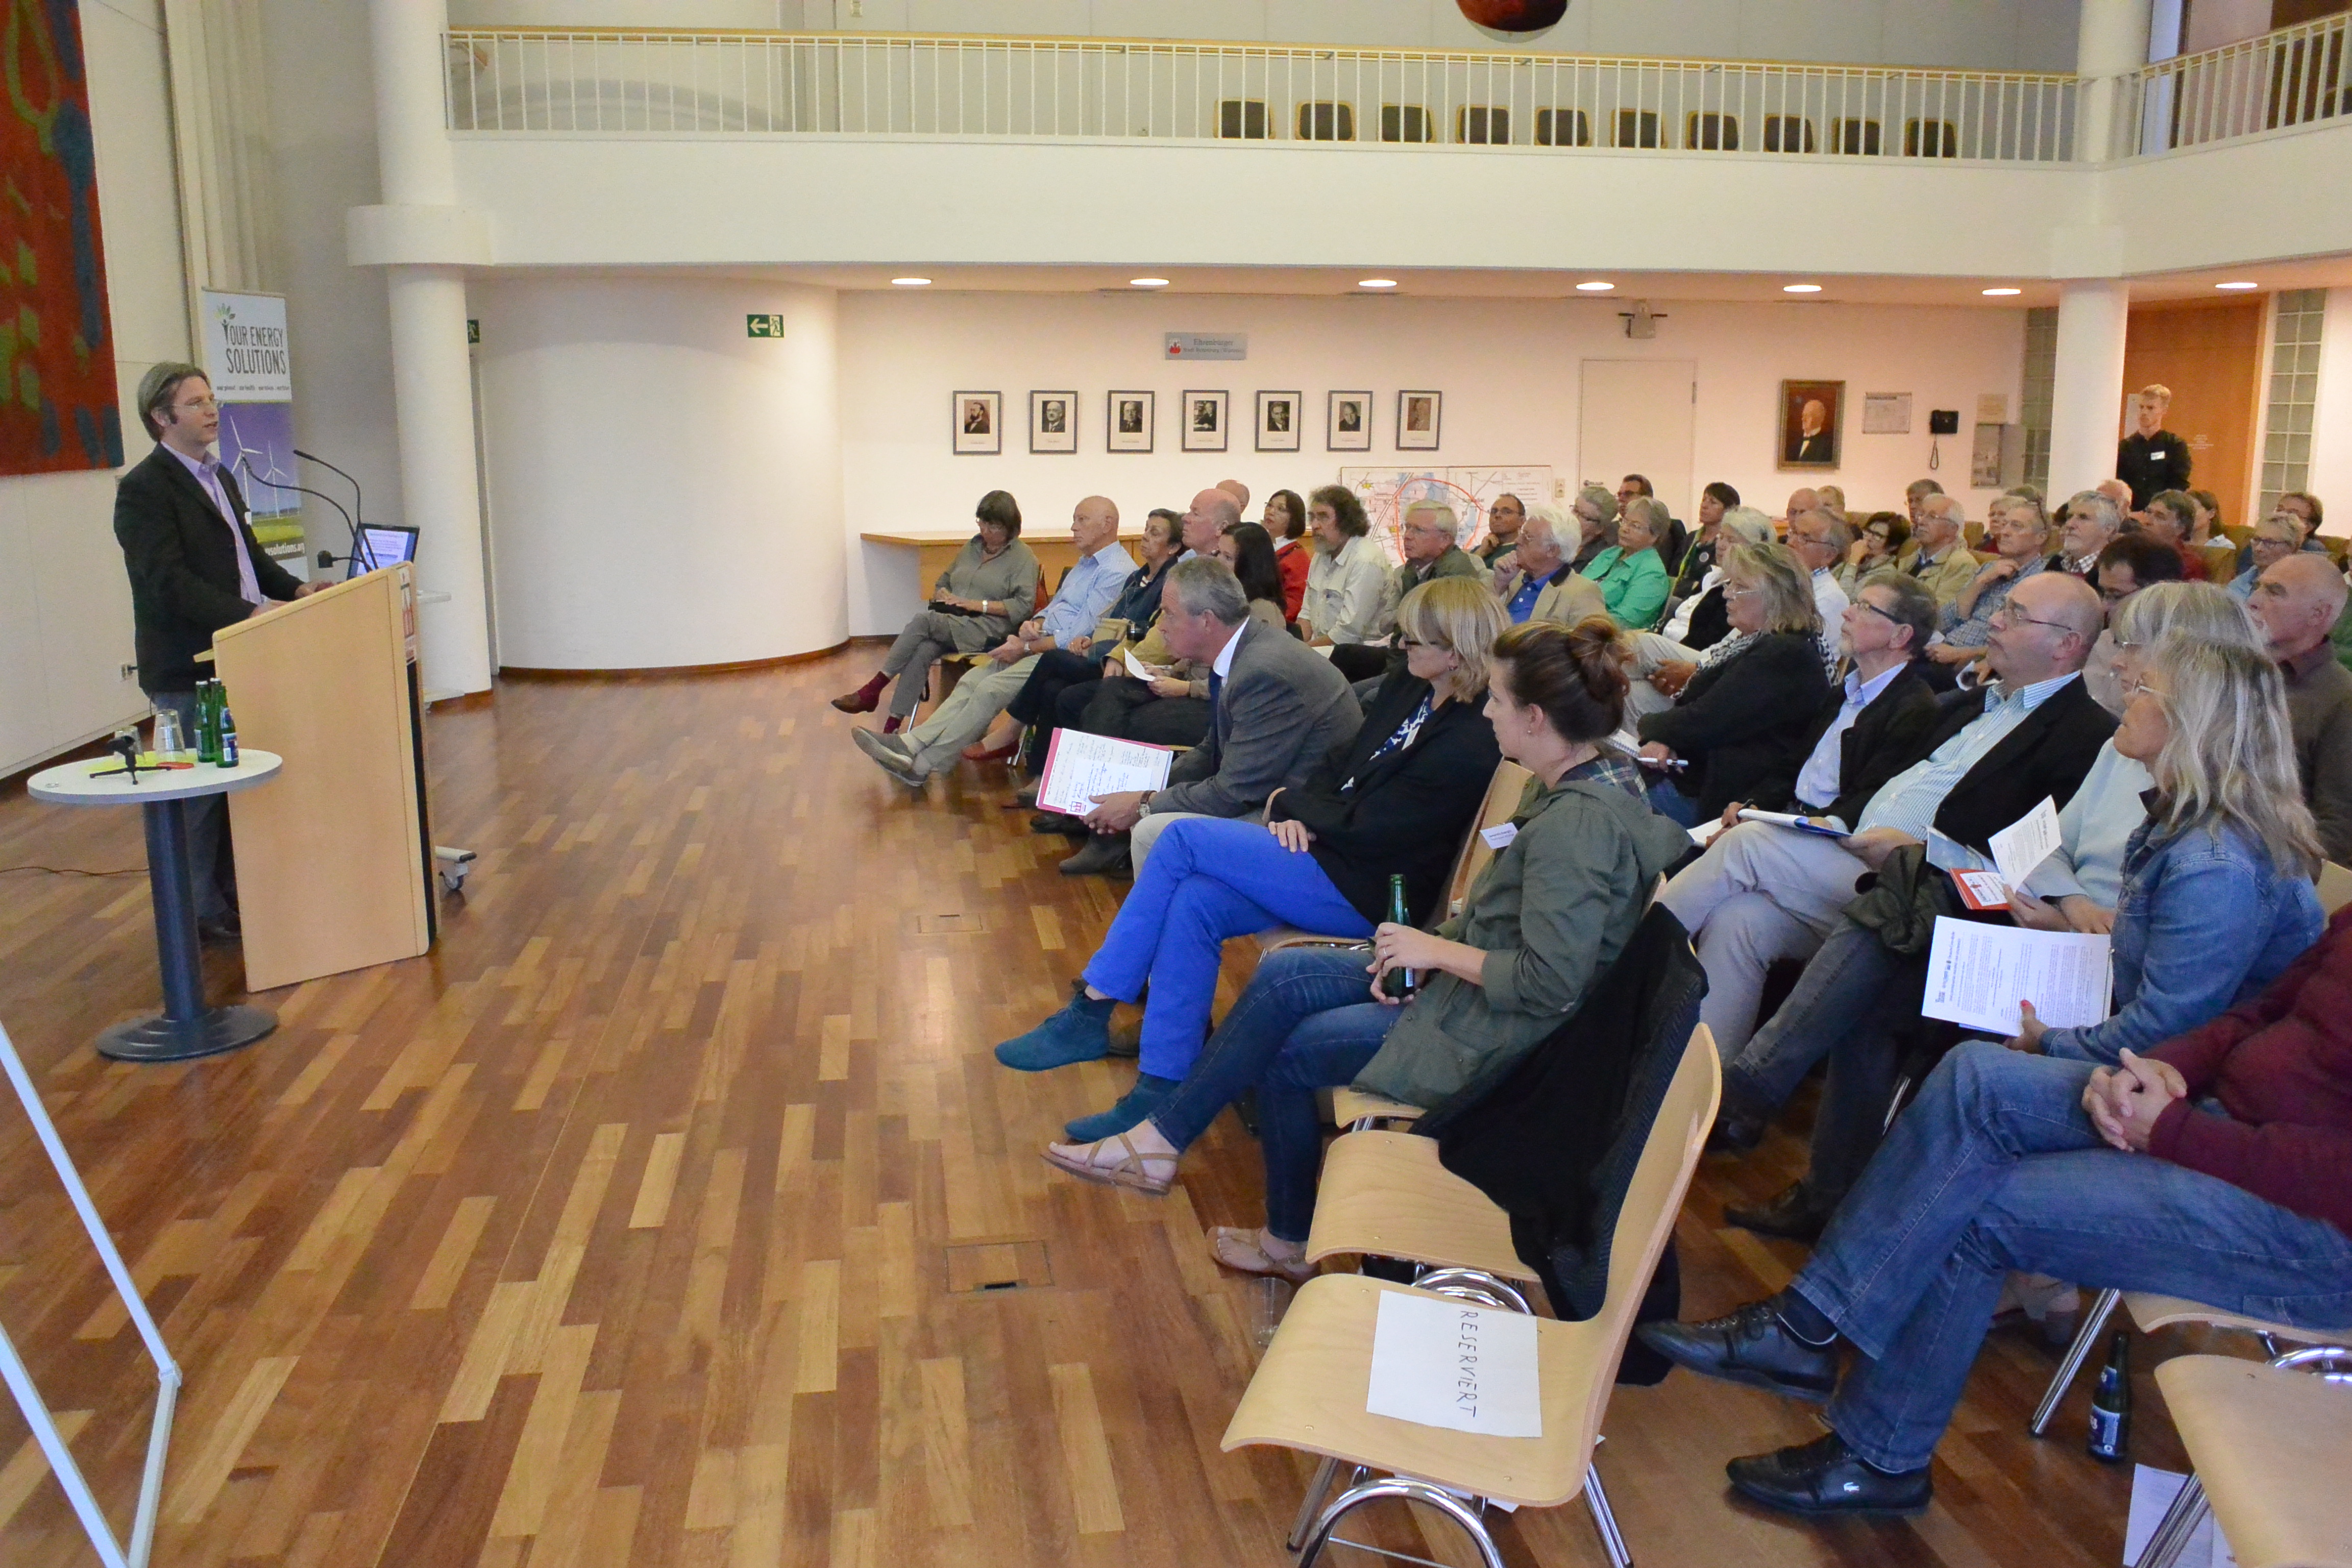
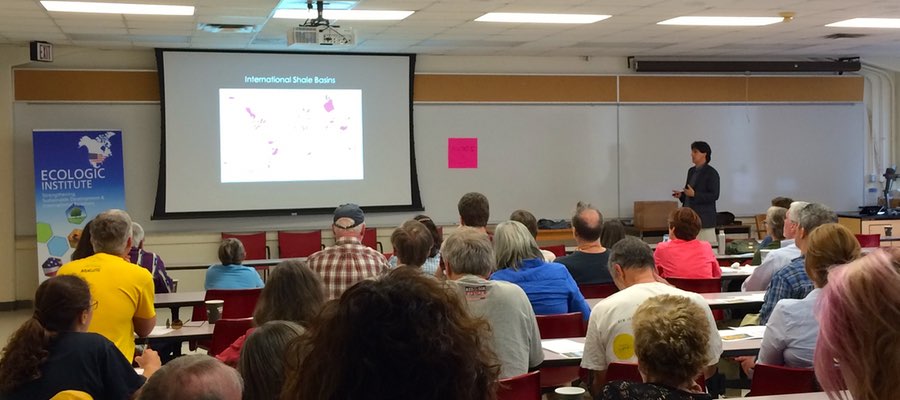
Max presenting during the Rotenburg Germany workshop, Sept 2015. Photo by Kyle Ferrar
Our next stop in Germany was Rotenburg. Lower Saxony also has a long lineage of drilling, with the first well drilled in 1953 and the majority of natural gas development dating back to the mid 1980’s. Currently, this is an area were unconventional oil and gas drilling (fracking) is being heavily proposed and lobbied.
This workshop was by far the most well attended event. A variety of groups and stakeholders, including the town’s mayor, were in attendance and extremely well informed about environmental and public health risks that drilling could pose. They’ve been dealing with a series of environmental health concerns for some time, including high mercury levels in drilling waste and cancer clusters of questionable origin. A systematic statistical analysis has even suggested that cases of Non-Hodgkin lymphoma are higher in an area heavy with oil and gas wells and development.
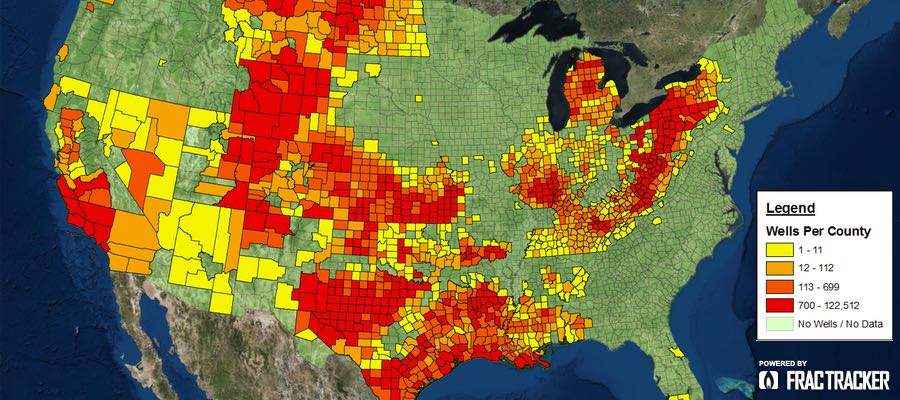
See maps below for more information about drilling in Germany and Europe at large.
Unconventional gas production, conventional gas drilling, fracking and test boring in Europe
Map by Gegen Gasbohren (Against Gas Drilling)
View Gegen Gasbohren’s map fullscreen
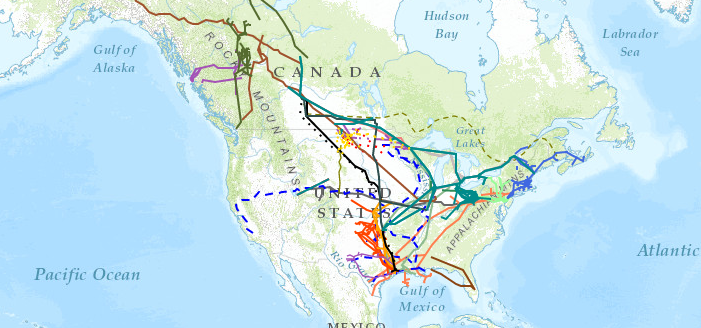
A dynamic map similar to the one above was created by us to show simply where unconventional drilling is occurring in the UK and Netherlands:
View FracTracker’s map fullscreen
Rotenburg Field Tour
The following morning we set out with a local advocate, Andreas Rathjens, to tour over eight different oil and gas drilling sites and facilities in and around Rotenburg. This area is vey rural and a major agriculture hub, hosting 162k people, 200k cows, and 600k pigs according to our guide.
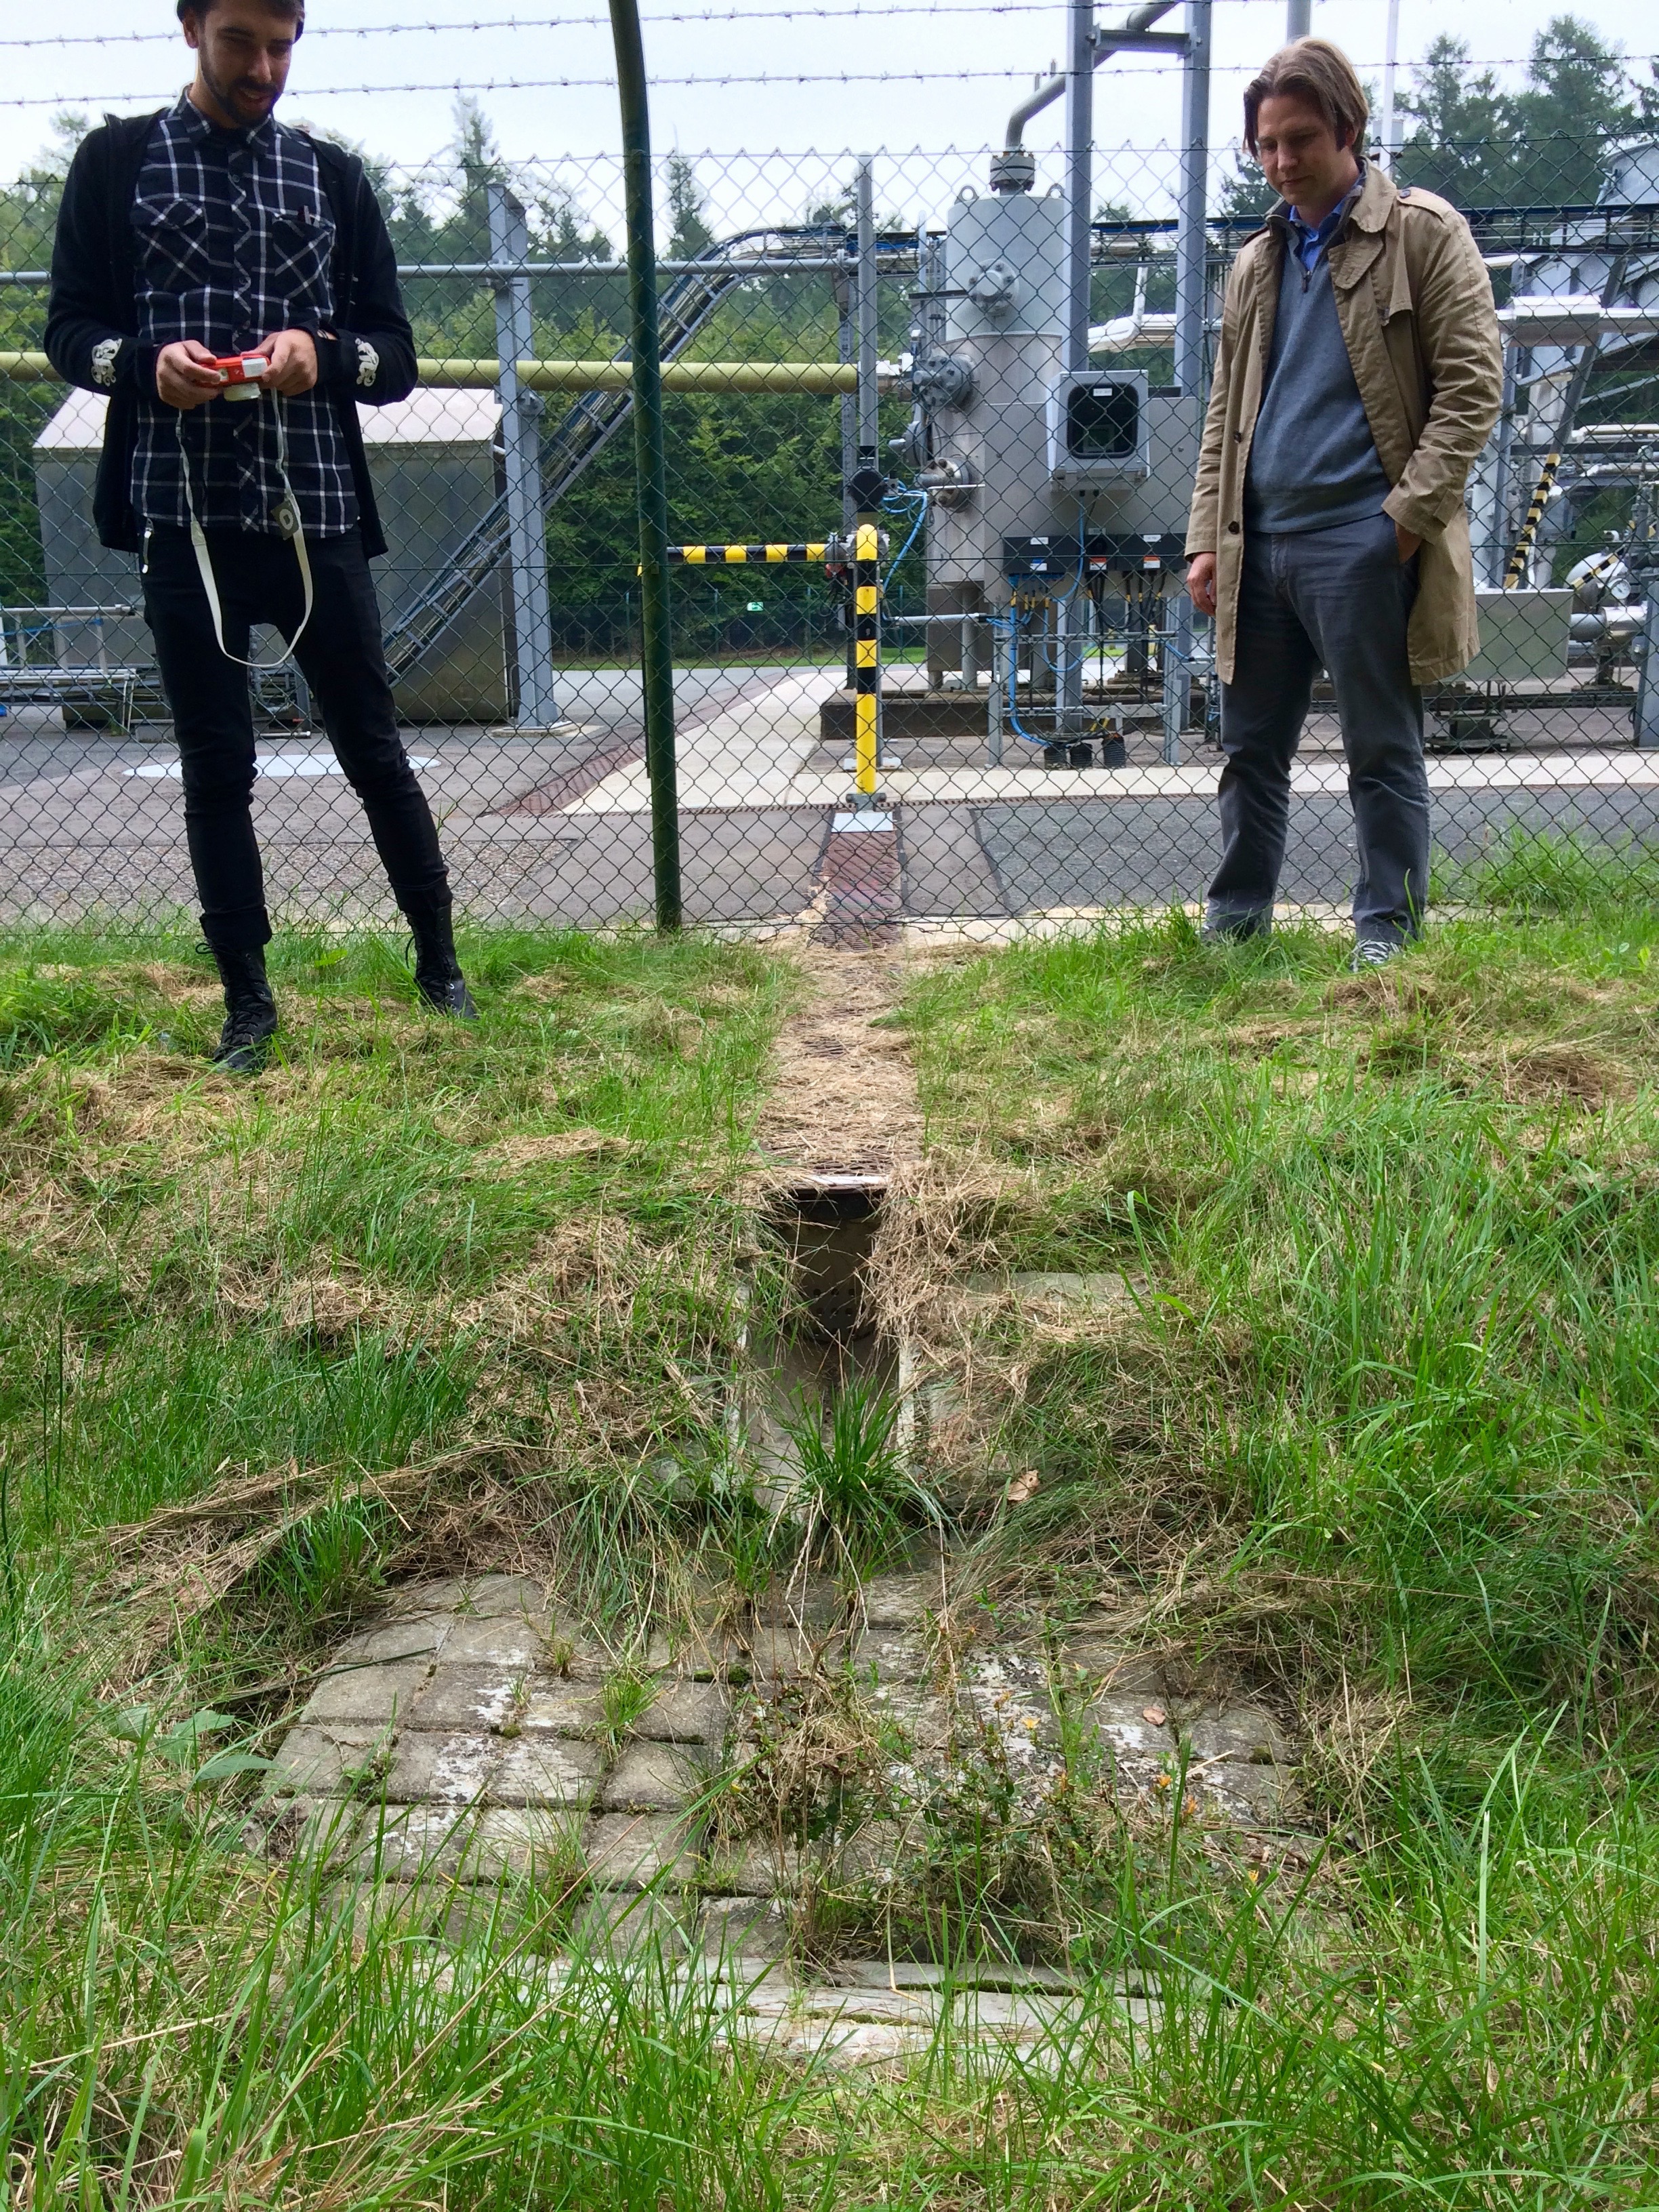
In recent years Germany has received very positive scores for its environmental policies and shift toward renewables. However, this tour highlighted some of the country’s lingering and poorly-regulated drilling history, which experienced a sharp increase in development here in the 1980’s. The pictures below will give you an idea of the issues that German residents are is still seeing from the country’s older oil and gas drilling operations. Click to enlarge the photos:
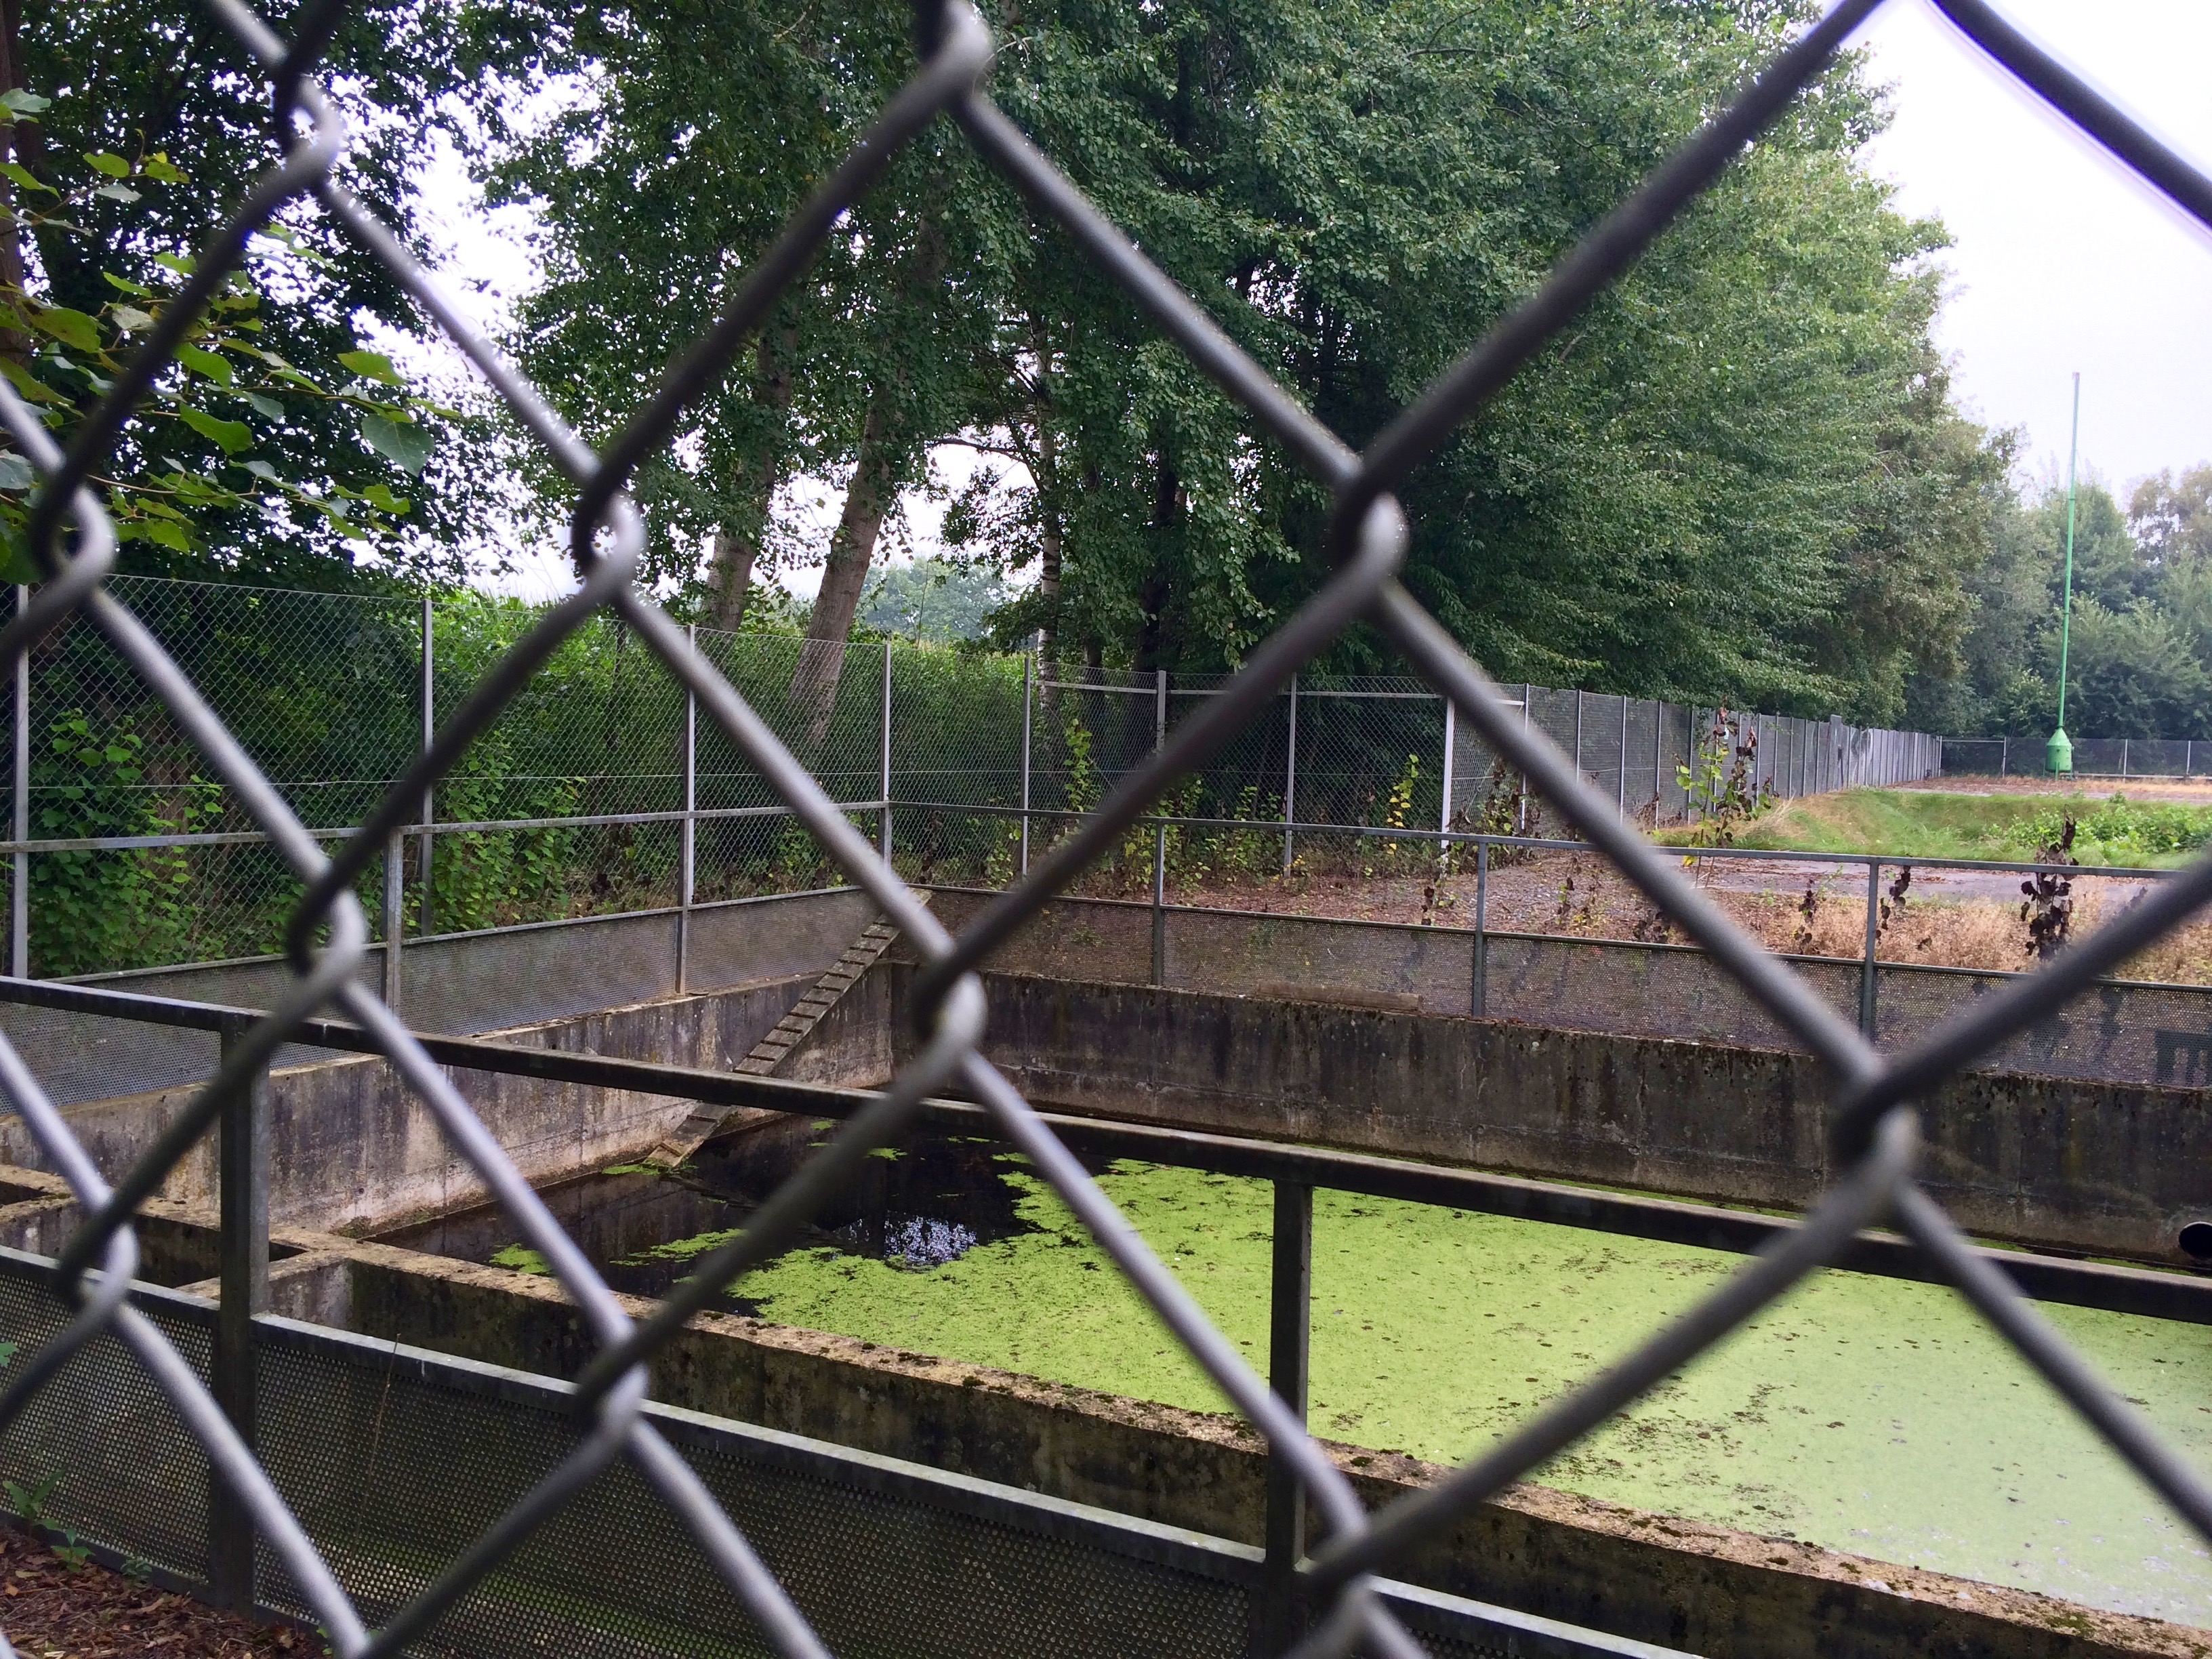
This pit is used to capture rainwater and runoff from the well pad. Since runoff from the pad will carry with it any contaminants spilled on the site, runoff must be quarantined for removal and proper disposal. Unfortunately, these tanks are rarely pumped and drained, and the runoff instead spills into local streams in small watersheds. Such is the case with this tank, with the spillway visible in the lower left corner of the photo.
This site was recently renovated to improve the drainage off of the wellpad. The drainage leads to an excavated waste pit used as an overflow catchment.[8] In these types of waste pits pollutants evaporate into the air and percolate into groundwater sources. The waste from drilling in this region is known for its high levels of mercury.
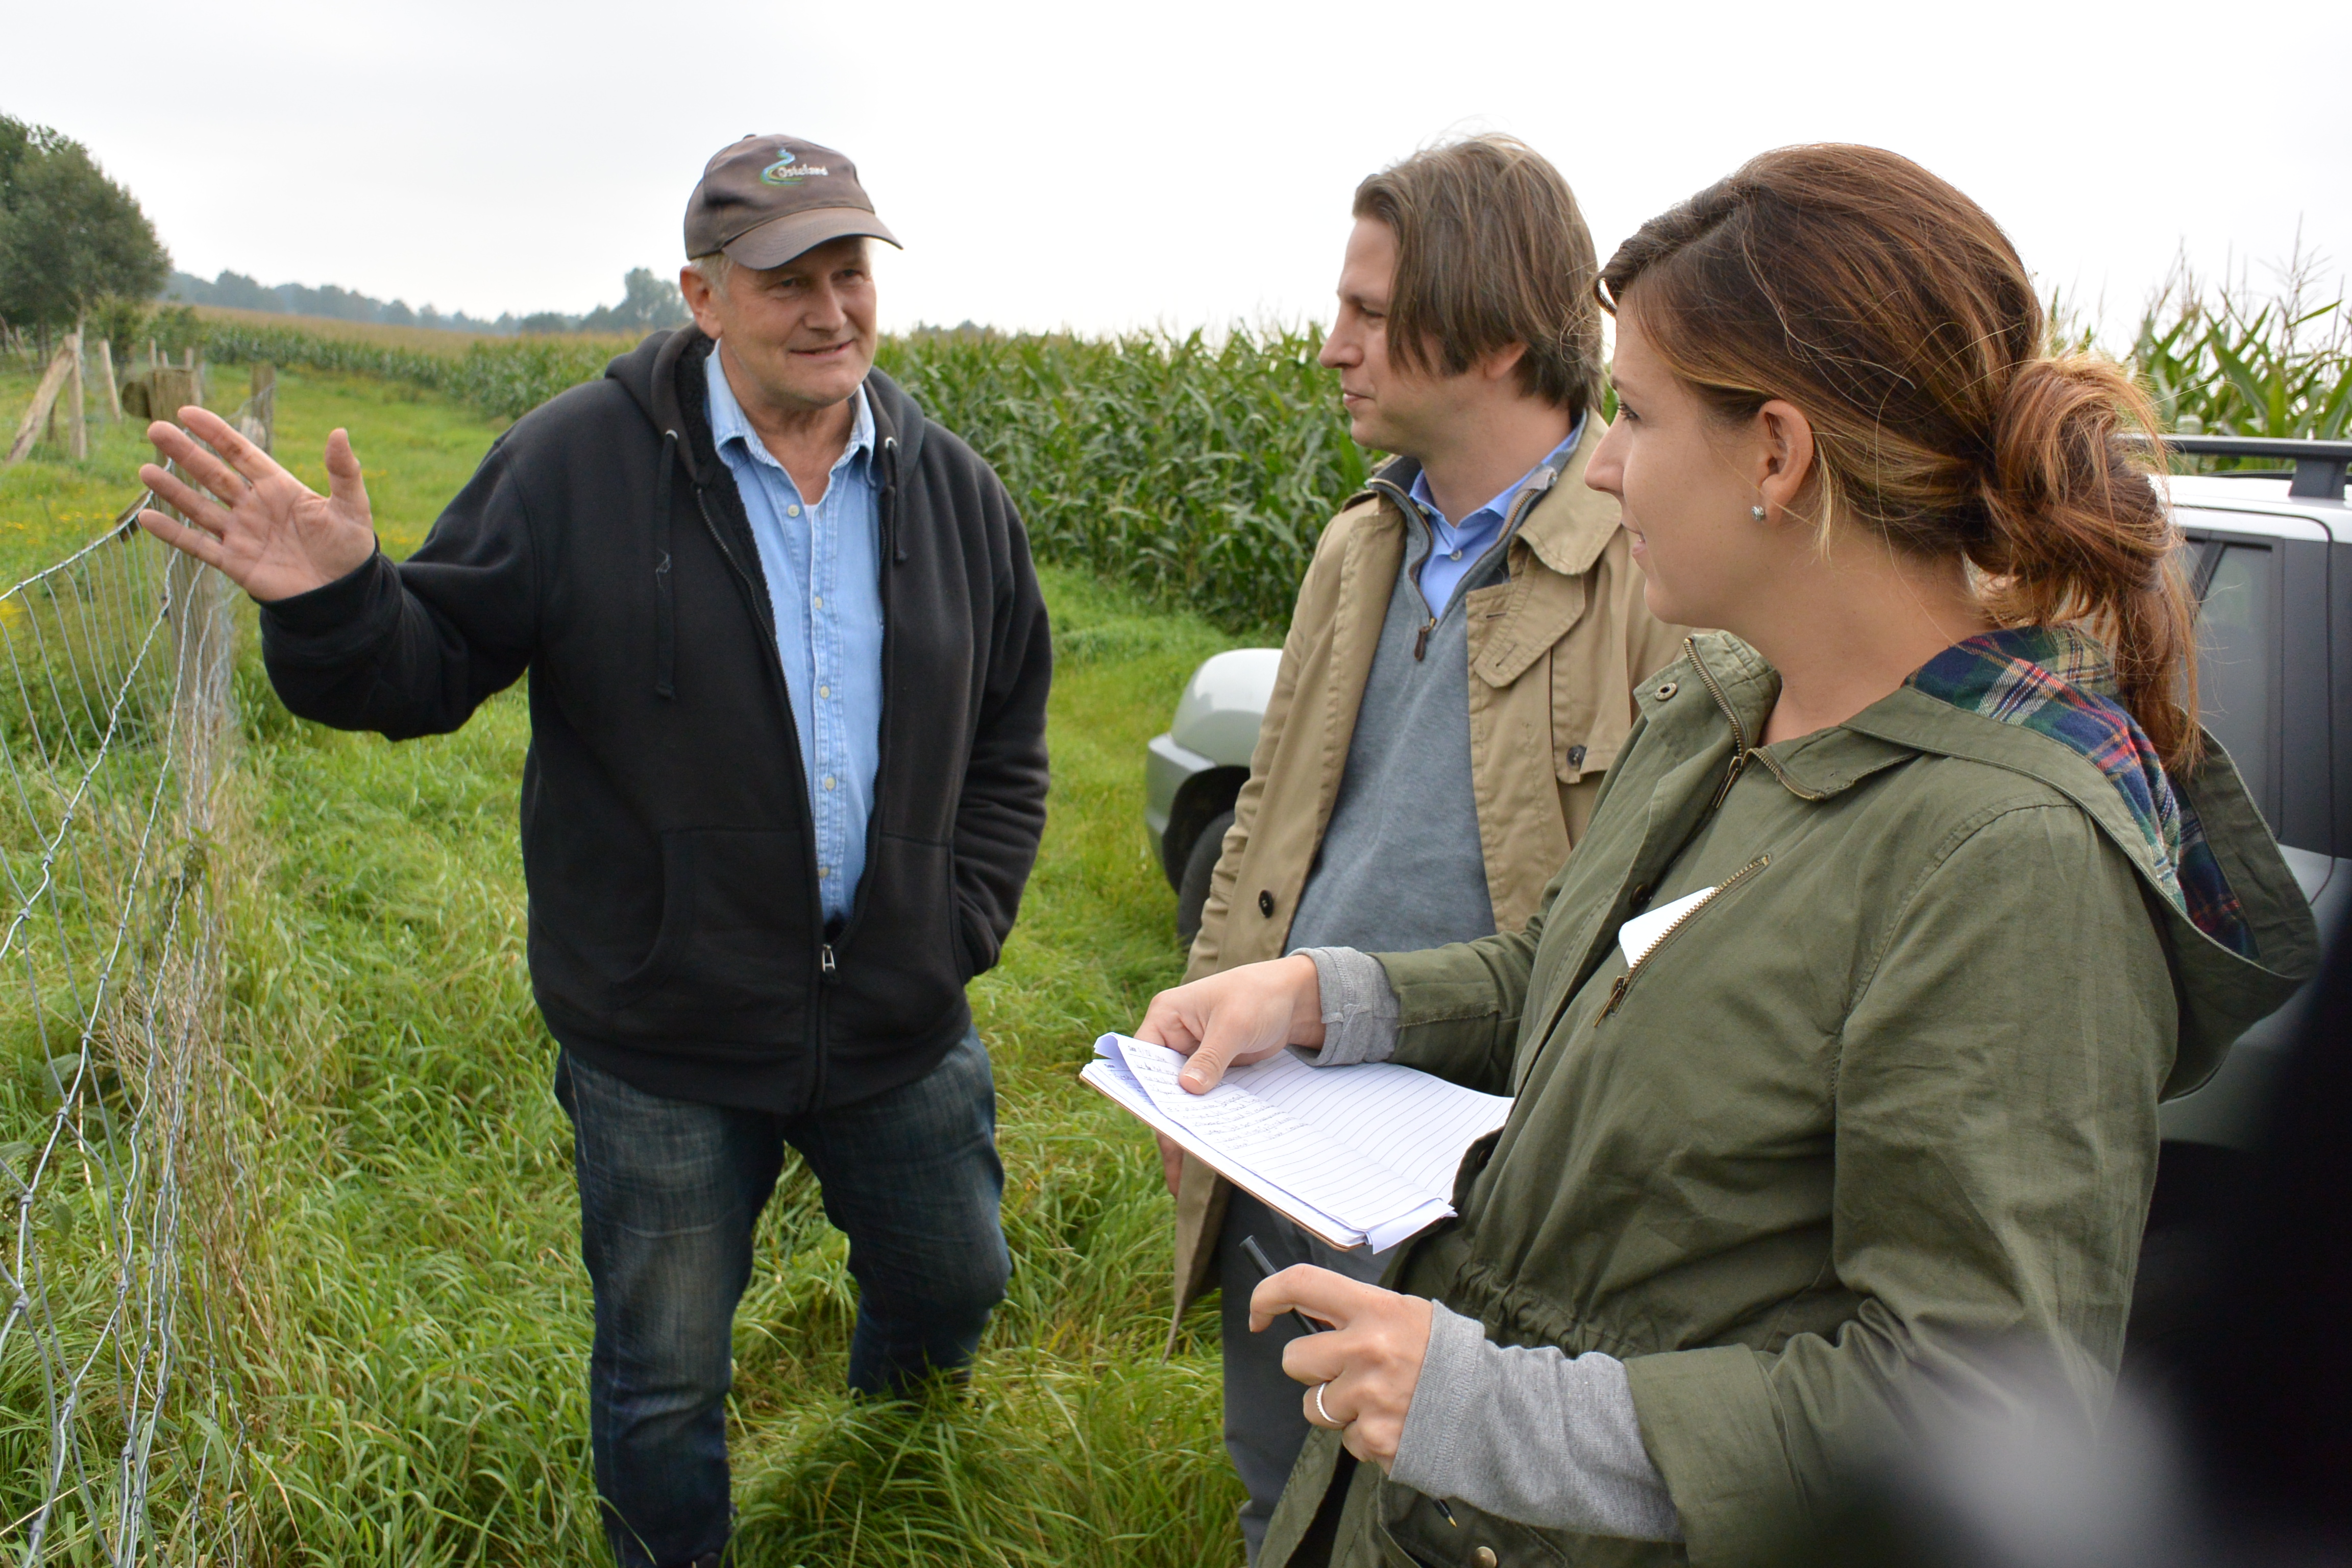
Andreas showing us the site where he says 80,000 metric tonnes of solid drilling waste was mixed with residential waste and then disposed of in a field on a hilltop. Residents have tested the site and found troubling levels of arsenic and radioactive elements, but to Andreas’ knowledge no governmental or company testing has been done to-date.
Andreas and community members all conveyed their support of domestic energy production but said they were disappointed in how the oil and gas industry has conducted itself historically in the region. They are very frustrated with how difficult it is to get their concerns heard, a sentiment echoed in many boomtowns across the US. One local politician even discussed the intentionally misleading statements made by the German state governments around environmental health issues. These residents are dedicated and driven despite the barriers, however. They are investigating and studying the problems directly at times, as well as searching for other technologies that can help improve their methods – such as the use of drones to measure air quality.
Badbergen, Lower Saxony, Germany Workshop
Fracking-freies Artland hosted our next workshop in Badbergen Germany. In addition to our presentation about drilling experiences in the US, these community gatekeepers led a presentation summarizing the work and struggles that have been occurring in their region due to both historic and modern drilling. The level of community engagement and activism here was quite impressive, mirroring that of NY State’s anti-drilling groups. These members help to inform the rest of the community about environmental and drilling issues, as Exxon is now considering fracking here again.[9]
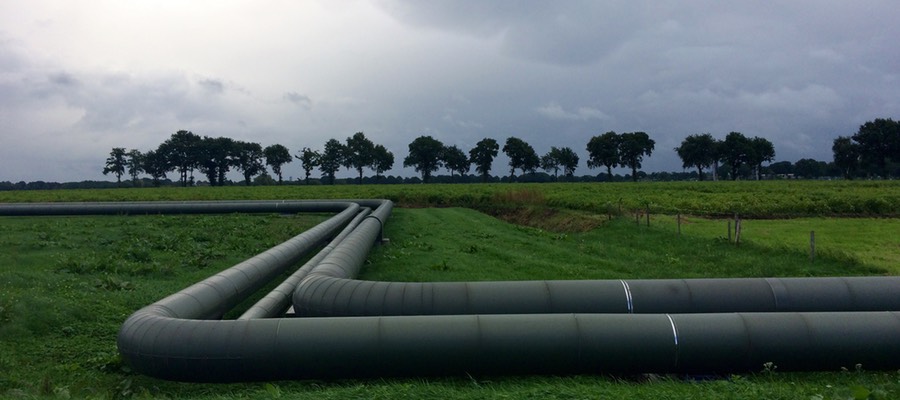
Schoonebeek Tour, Netherlands
Our final border crossing brought us to the Schoonebeek region in the Netherlands. While the Groningen gas field is by far the largest of the fields in this Western European country, Schoonebeek is the only active field being drilled unconventionally in the Netherlands.
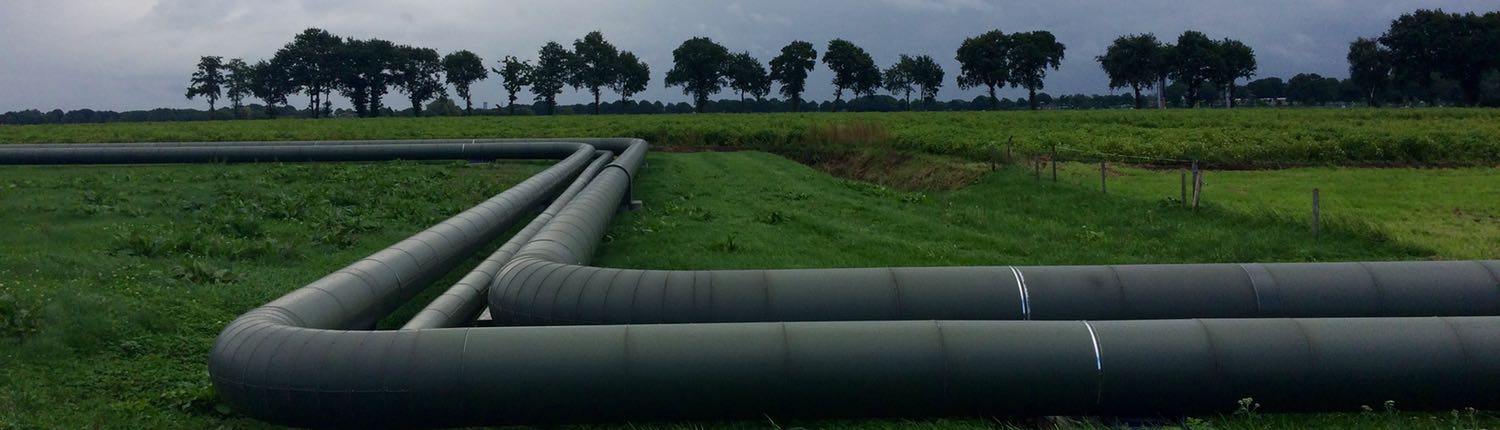
Interestingly, the entire field was recently shut down by NAM Shell/Exxon JV to fix this wastewater pipeline. It was discovered that the pipeline was leaking wastewater in nine places due to corrosion caused by the high sulfur content of the wastewater.
Upon starting our tour we were informed of the fact that the Dutch have an even higher extraction tax than the UK! The Netherlands retains a 50% State Profit Share for revenue and taxes the remaining production at a rate of 20% on the first $225,000 in revenue and “25% on the excess.” In comparison, the highest production tax rate on oil and gas drilling in the US is in Alaska at 35%. Most states have significantly lower severance taxes.[10]
Political support for higher taxes on the extractives industry may be explained by the fact that the state owns all subsurface mineral rights in these European countries. Regardless of other influences on perception, such high taxes disproves the notion here in the US that energy companies “won’t do business in a state [or country] with a newly-enacted punitive severance tax.” What do the states do with this extra revenue? The Netherlands and many Northern European countries have invested these monies for the rainy day when the oil and gas supply is depleted or extraction is no longer justifiable. The best examples are Norway’s $850 billion Government Pension Fund and Netherland’s $440 billion pension fund or $169,000 and $26,000 per capita, respectively.
Additional support for severance taxes is likely due to these countries’ history with oil and gas exploration. They are familiar with the boom-bust cycles that come with the initial expectations and long-term reality on the ground. When the music stops, Europeans are determined not to be the ones left standing.
About the Our Energy Solutions Project
This trip to Europe and our previous expeditions to Florida, North Carolina, Argentina, and Uruguay are part of a larger, collaborative project with Ecologic Institute US called Our Energy Solutions. OES is creating an informed global community of engaged citizens, organizations, businesses, governments, and stakeholders to develop ideas and solutions to keep our society moving forward while preserving our planet for the future. Learn more at: ourenergysolutions.org.
On a more personal note, our sincerest thanks goes out to the many groups and individuals that we met on our Europe tour, including those we did not directly mention in this article. We are forever indebted to all of the people with whom we met on these OES trips for sharing their time and knowledge with us.
Endnotes and References
- Dr. Short is currently advising local anti-fracking groups in the UK and county councils on the human rights implications of unconventional (extreme) energy extraction processes such as fracking.
- Dr. Short and collaborators were recently granted an opportunity to put fracking on trial at hearings to be held by The Permanent Peoples’ Tribunal (PPT) in the UK and the US.
- Much of the ammunition used by the anti- or undecided fracking community in the UK – and the EU writ large – is coming from proofs of concept in states like Pennsylvania, Ohio, New York, and North Dakota.
- Gosden, Emily. 8/13/15. Fracking: new powers for ministers to bypass local councils. The Telegraph. Accessed 10/25/15.
- Strachan, Peter. Russell, Alex. Gordon, Robert. 10/15/15. UK government’s delusional energy policy and implications for Scotland. OilVoice. Accessed 10/25/15.
- California, instead, imposes a statewide assessment fee.
- European Commission. 1/22/14. Fracking: minimum principles for the exploration and production of hydrocarbons using high-volume hydraulic fracturing. Eur-Lex. Accessed 10/26/15.
- A practice that is supposedly now being investigated for soil contamination issues.
- Exxon originally wrote in the local/regional paper that there was to be no unconventional shale drilling (fracking), but now the company is reconsidering.
- Please note that the cited article was last updated in 2012. Some tax rates have changed since the time that the article was published, but the table still adequately represents an estimation of production taxes by state.


 Both states are at risk from accelerated and more extreme hydrocarbon extraction, but both also bear significant potential for broad success with renewable energy. While only 0.1% of Florida’s current generating capacity comes from solar, it has some of the strongest incoming solar radiation in the country. North Carolina sports the best conditions for offshore wind energy on the east coast. The Tarheel State ranked 2nd in the nation for new installed solar capacity in 2014, and the same year, over 4,300 North Carolinians worked in the solar power industry. Already, 4,800 Floridians work in the solar industry.