Real Talk on Pipelines
This story map contains audio clips and quotes from local officials and residents on the impacts of oil & gas pipelines in their communities.
This story map contains audio clips and quotes from local officials and residents on the impacts of oil & gas pipelines in their communities.
A look at the petrochemical industry’s footprint in the Ohio River Watershed and how much toxic pollution is discharged into waterways.
Local stakeholders’ concerns about the environmental and health impacts of oil and gas in the Muskingum Watershed of Ohio have been minimized or excluded by the US Army Corps’ environmental assessment.
Ohio River Valley Groups react to a new safety warning issued by federal regulators to Shell regarding the troubled Falcon Pipeline
FracTracker’s aerial survey of unconventional oil & gas infrastructure and activities in northeast PA to southern OH and central WV
Insights on Ohio’s massive fracking waste gap, Class II injection well activity, and fracking waste related legislation
The Falcon Ethane Pipeline System is at the center of major investigations into possible noncompliance with construction and public safety requirements and failing to report drilling mud spills, according to documents obtained from the Pennsylvania Department of Environmental Protection (PA DEP) by FracTracker Alliance. These investigations, which are yet to be released, also uncovered instances of alleged data falsification in construction reports and Shell Pipeline Company firing employees in retaliation for speaking up about these issues.
3/17/21 Press release: https://www.fractracker.org/falcon-investigation-press-release-fractraccker-alliance/
Shell’s attempts to cut corners while constructing this 98-mile pipeline, likely motivated by the increasingly bleak economic prospects of this project, present serious public safety concerns for the thousands of residents along its route in Pennsylvania, West Virginia, and Ohio.
These allegations are serious enough to warrant immediate action. We’re calling on the Pipeline and Hazardous Materials Safety Administration (PHMSA) to thoroughly examine these allegations and suspend construction if not yet completed, or, in the case that construction is complete, operation of the Falcon Pipeline. Furthermore, we call on state environmental regulators to fully investigate construction incidents throughout the entire pipeline route, require Shell Pipeline to complete any necessary remediation, including funding independent drinking water testing, and take enforcement action to hold Shell accountable. Read our letters to these agencies here.
These investigations were featured in a March 17th article by Anya Litvak in the Pittsburgh Post-Gazette.
3/18/21 update:
Additional coverage of this story was published in a Times Online article by Daveen Ray Kurutz, a StateImpact Pennsylvania article by Reid Frazier, and an Observer-Reporter article by Rick Shrum.
According to documents obtained through a public records request, a whistleblower contacted PHMSA in 2019 with serious concerns about the Falcon, including that the pipeline may have been constructed with defective corrosion coating. PHMSA is a federal agency that regulates pipeline operation. The whistleblower also shared environmental threats occurring within the DEP’s jurisdiction, prompting the PA DEP and Pennsylvania Attorney General’s Office to get involved.
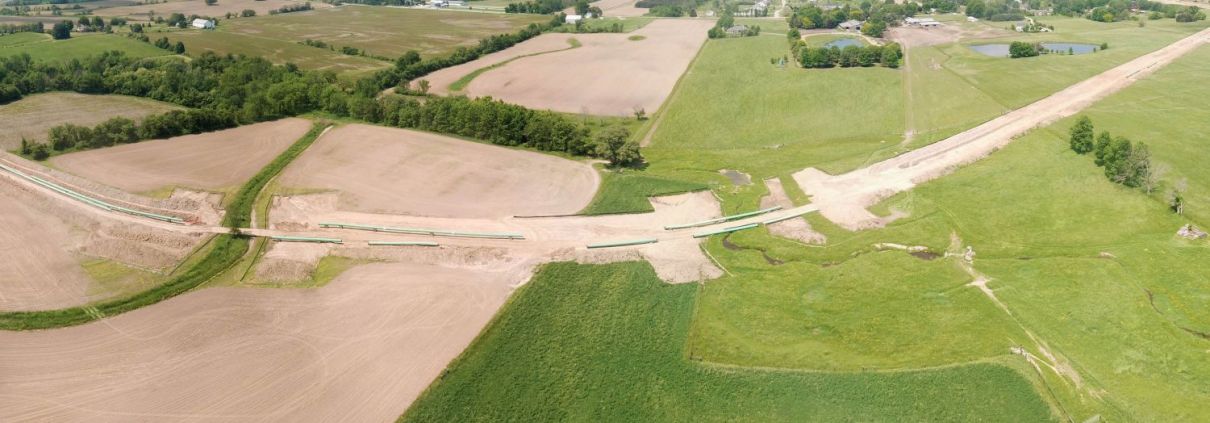
Many of the issues with the Falcon relate to a construction method used to install pipelines beneath sensitive areas like roads and rivers called horizontal directional drilling (HDD). Shell Pipeline contracted Ellingson Trenchless LLC to complete over 20 HDDs along the Falcon, including crossings beneath drinking water sources such as the Ohio River and its tributaries. FracTracker and DeSmog Blog previously reported on major drilling mud spills Shell caused while constructing HDDs and how public agencies have failed to regulate these incidents.
This map shows the Falcon Pipeline’s HDD crossings and spills of drilling fluid spills that occurred through 3/5/2020. To see the data sources, click on the information icon found in the upper right corner of the map header as well as under the map address bar.
View Map Full Sized | Updated 6/16/20
Correspondence between the PA DEP and PHMSA from February 26, 2020 reveal the gravity of the situation. While PHMSA conducted an inquiry into the whistleblower’s complaints in 2019 and concluded there were no deficiencies, PA DEP Secretary Patrick McDonnell wrote that his agency felt it was incomplete and urged PHMSA to conduct a more thorough investigation. Secretary McDonnell noted the PA DEP “has received what appears to be credible information that sections of Shell’s Falcon Pipeline project in western PA, developed for the transportation of ethane liquid, may have been constructed with defective corrosion coating protection,” and that “corroded pipes pose a possible threat of product release, landslide, or even explosions.”
FracTracker submitted a Freedom of Information Act request with PHMSA asking for documents pertaining to this inquiry, and was directed to the agency’s publicly available enforcement action webpage. The page shows that PHMSA opened a case into the Falcon on July 16, 2020, five months after Secretary McDonnell sent the letter. PHMSA sent Shell Pipeline Company a Notice of Amendment citing several inadequacies with the Falcon’s construction, including:
Shell responded with its amended procedures on July 27, 2020, and PHMSA closed the case on August 13, 2020.
Of note, PHMSA states it is basing this Notice on an inspection conducted between April 9th and 11th, 2019, when construction on the Falcon had only recently started. PHMSA has confirmed its investigation on the Falcon is ongoing, however we question the accuracy of self reported data given to PHMSA inspectors should be questioned
The PA DEP also brought the matter to the attention of the US Environmental Protection Agency.
The Falcon pipeline also crosses through Ohio and briefly, West Virginia. While we do not know how these states are involved in these investigations, our past analyses raise concerns about the Ohio Environmental Protection Agency’s (OEPA) ability to regulate the pipeline’s HDD crossings.
One of the focuses of the Pennsylvania DEP’s investigation is the failure to report drilling fluid spills that occur while constructing a HDD crossing. The PA DEP shut down all HDD operations in November, 2019 and forced Shell to use monitors to calculate spills, as was stated in permit applications.
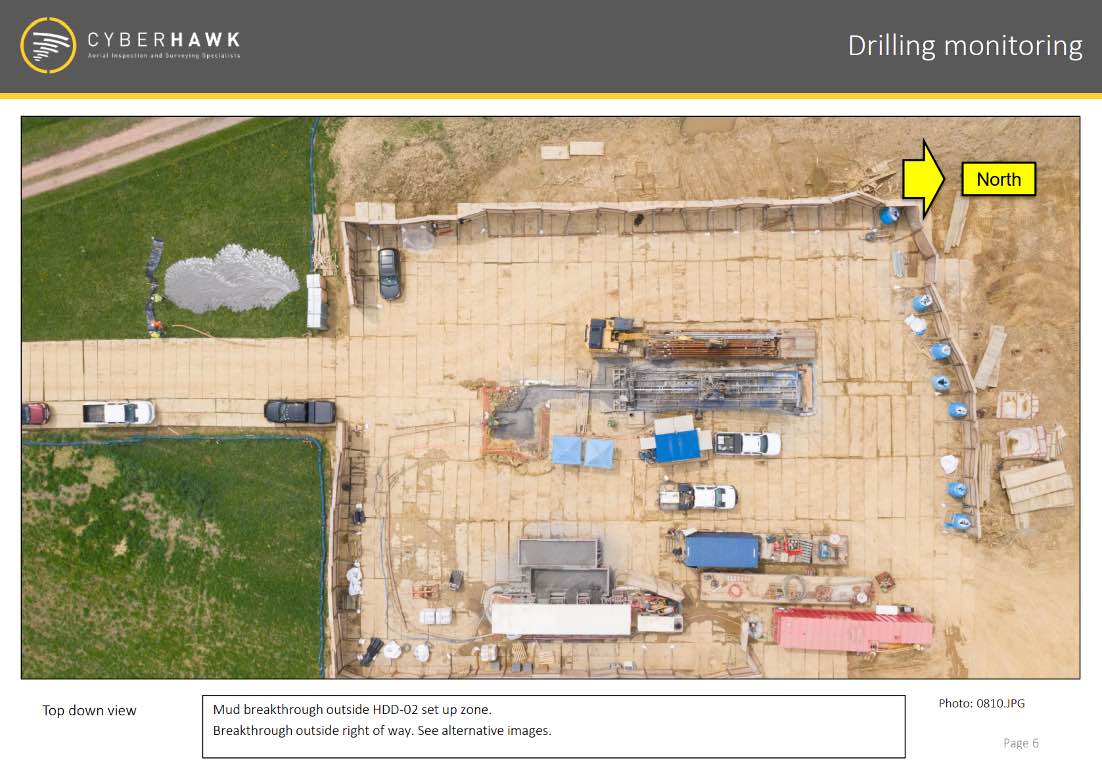
A horizontal directional drilling (HDD) construction site for the Falcon Pipeline in Southview, Washington County, Pennsylvania. You can see where the drilling mud has returned to the surface in the top left of the photo. Photo by Cyberhawk obtained by FracTracker Alliance through a right-to-know request with the Pennsylvania Department of Environmental Protection.
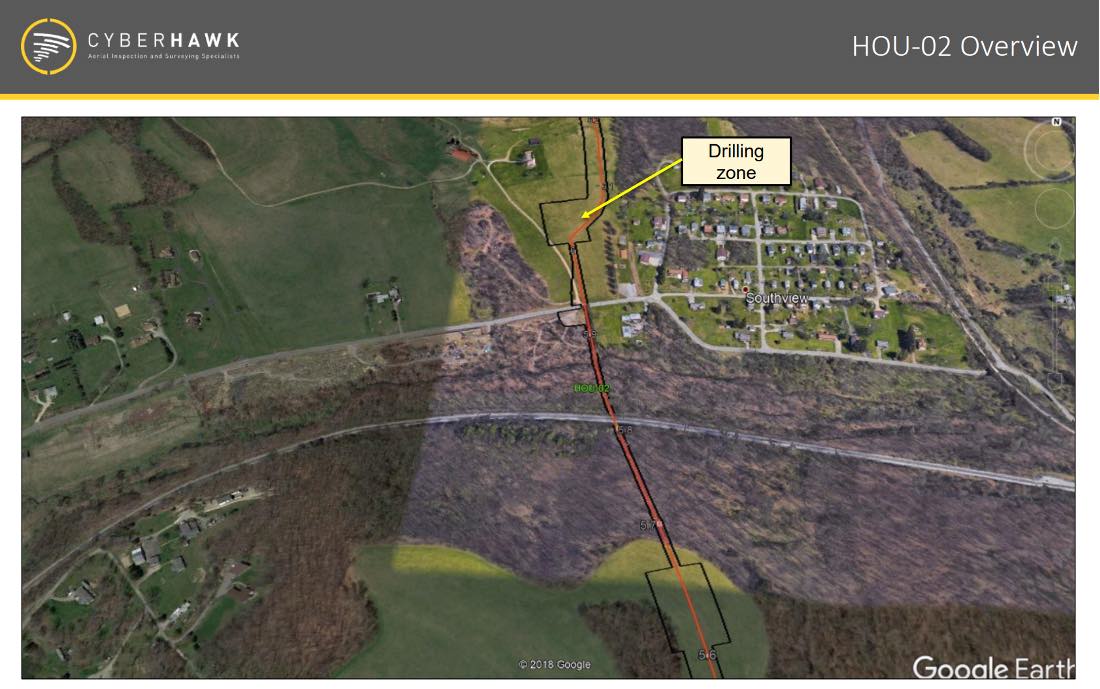
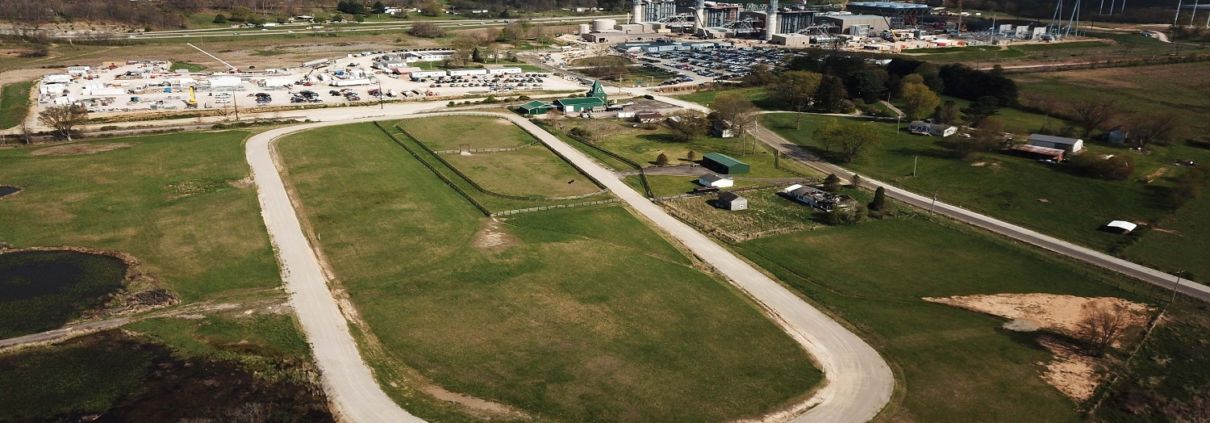
The Falcon Pipeline’s HDD locations are often close to neighborhoods, like the HOU-02 crossing in Southview, Washington County, Pennsylvania. Photo by Cyberhawk obtained by FracTracker Alliance through a right-to-know request with the Pennsylvania Department of Environmental Protection.
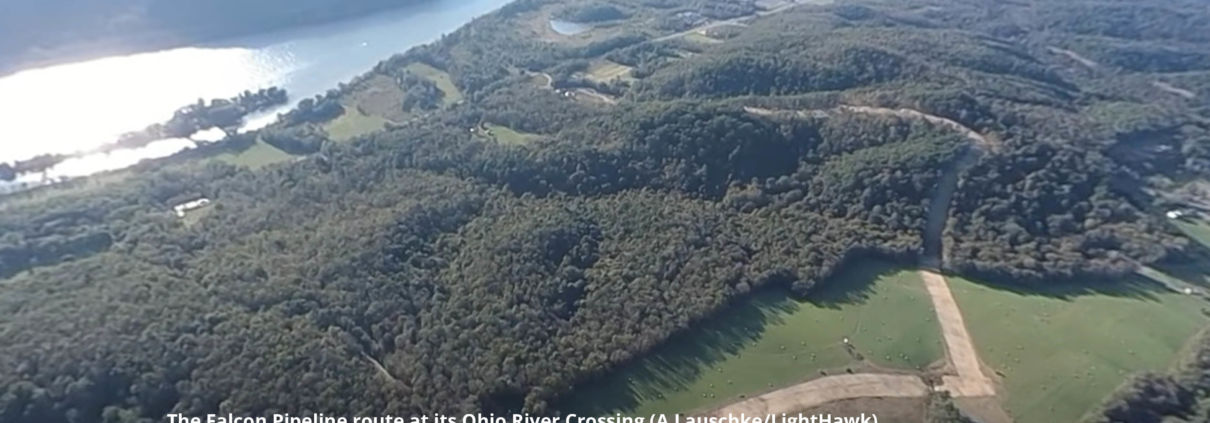
To our knowledge, the OEPA did not enforce this procedure, instead relying on workers to manually calculate and report spills. Shell’s failure to accurately self-report raises concerns about the safety of the Falcon’s HDD crossings in Ohio, including the crossing beneath the Ohio River, just upstream of drinking water intakes for Toronto and Steubenville, Ohio.
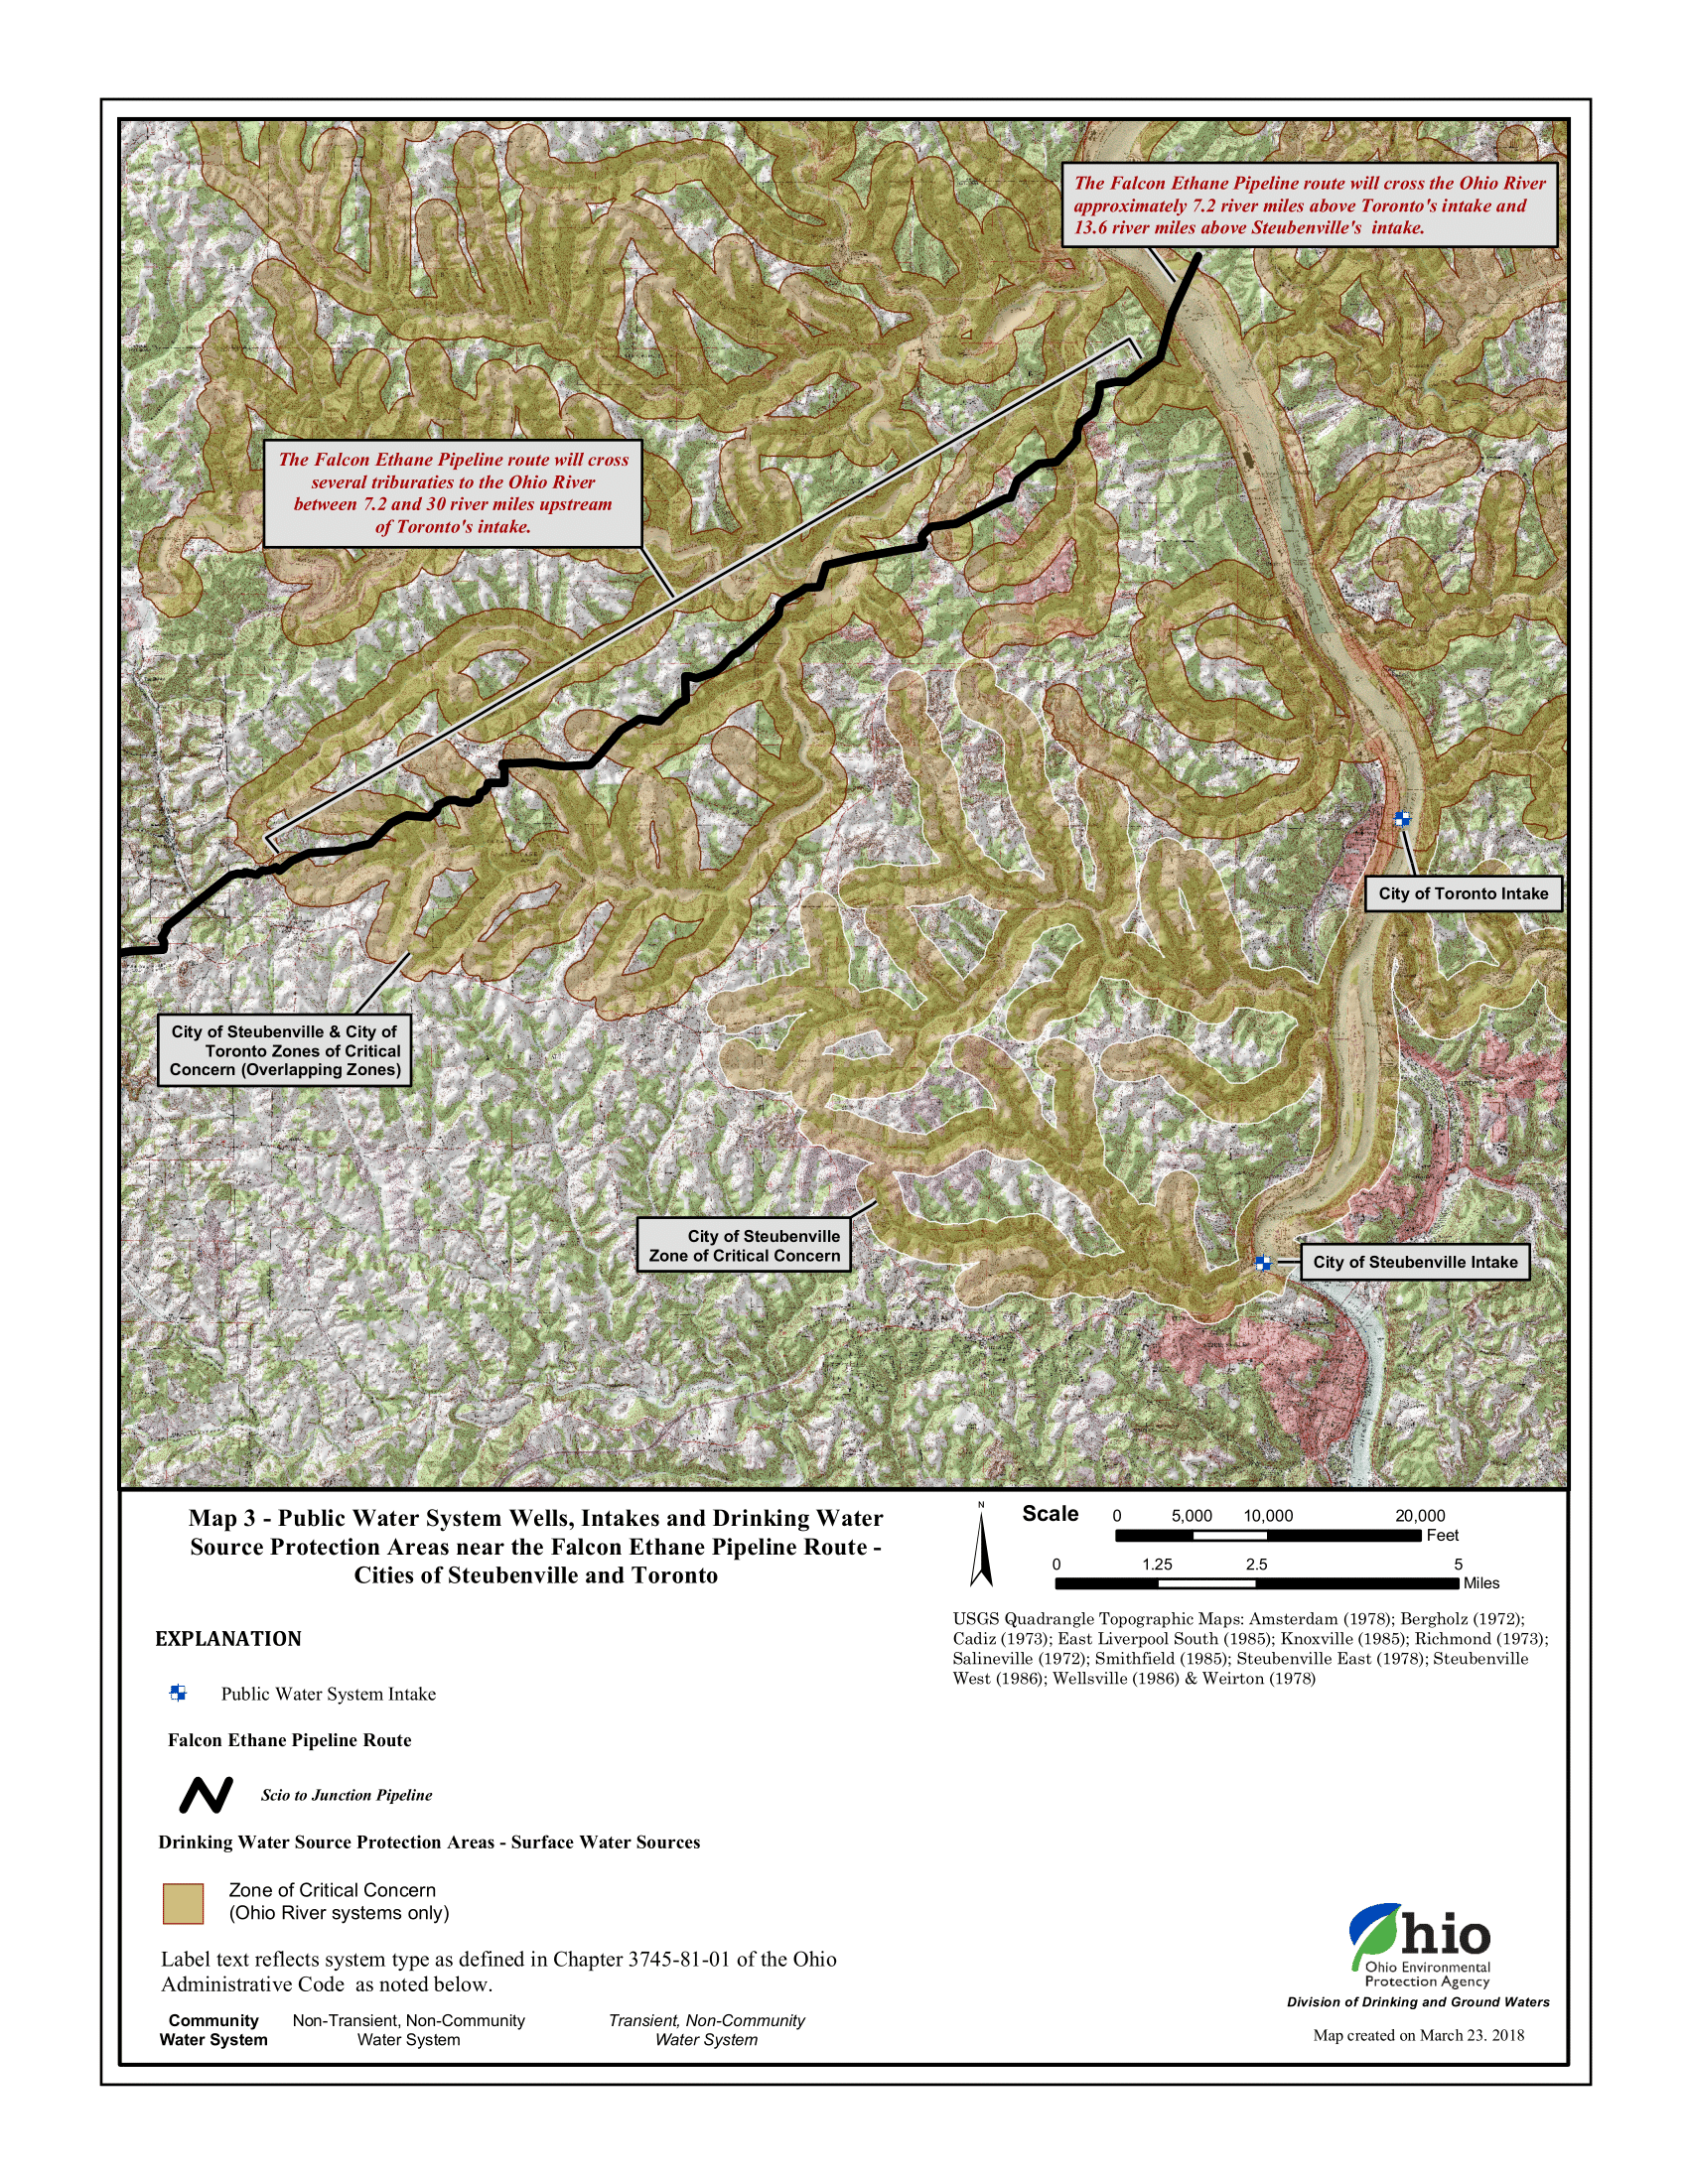
Public water system wells, intakes, and Drinking Water Source Protection Areas nears the Falcon Pipeline Route. Note, the pipeline route may have slightly changed since this map was produced. Source: Ohio EPA
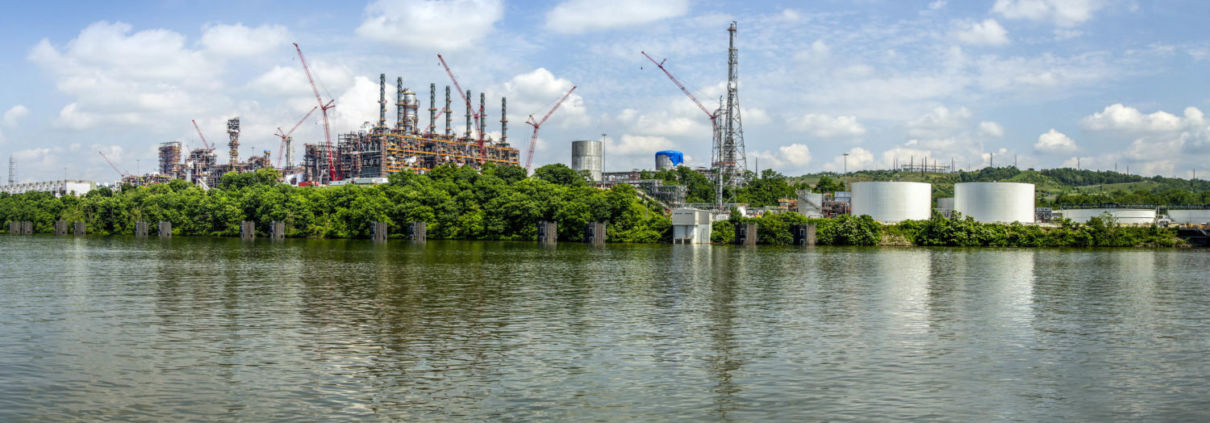
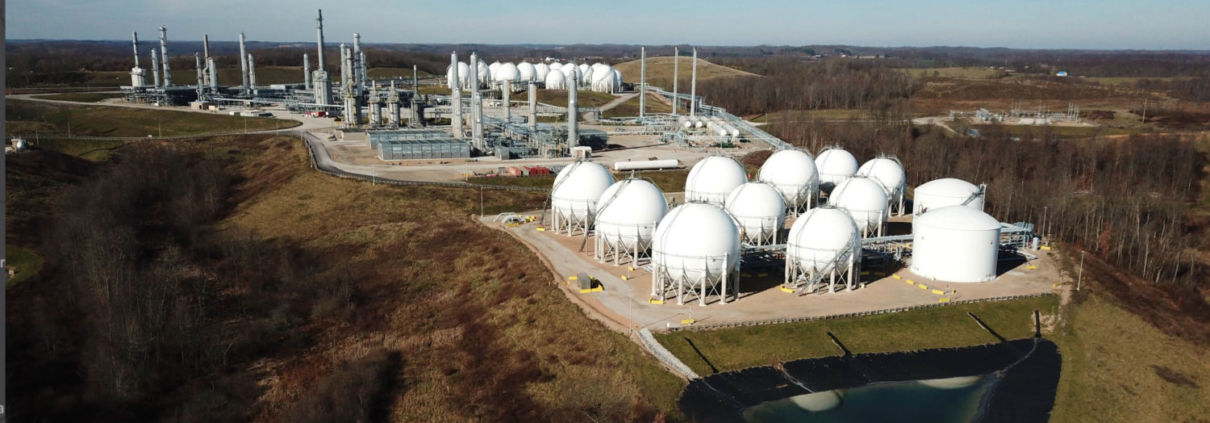
The Falcon is connected to one of Shell’s most high-profile projects: a $6 billion to $10 billion plastic manufacturing plant, commonly referred to as the Shell ethane cracker, in Beaver County, Pennsylvania. These massive projects represent the oil and gas industry’s far-fetched dream of a new age of manufacturing in the region that would revolve around converting fracked gas into plastic, much of which would be exported overseas.
Many in the Ohio River Valley have raised serious concerns over the public health implications of a petrochemical buildout. The United States’ current petrochemical hub is in the Gulf Coast, including a stretch of Louisiana known colloquially as “Cancer Alley” because of the high risk of cancer from industrial pollution.
Construction of the ethane cracker and the Falcon pipeline have forged forward during the COVID-19 pandemic. In another example of the culture of fear at the worksite, several workers expressed concern that speaking publicly about unsafe working conditions that made social distancing impossible would cost them their jobs. Yet the state has allowed work to continue on at the plant, going so far as to grant Shell the approval to continue work without the waiver most businesses had to obtain. As of December 2020, over 274 Shell workers had contracted the coronavirus.
While the oil and gas industry had initially planned several ethane crackers for the region, all companies except for Shell have pulled out or put their plans on hold, likely due to the industry’s weak financial outlook.
A June 2020 report by the Institute for Energy Economics and Financial Analysis (IEEFA), stated that:
Royal Dutch Shell owes a more complete explanation to shareholders and the people of Pennsylvania of how it is managing risk. Shell remains optimistic regarding the prospects for its Pennsylvania Petrochemical Complex in Beaver County, Penn. The complex, which is expected to open in 2021 or 2022, is part of a larger planned buildout of plastics capacity in the Ohio River Valley and the U.S. IEEFA concludes that the current risk profile indicates the complex will open to market conditions that are more challenging than when the project was planned. The complex is likely to be less profitable than expected and face an extended period of financial distress.
Many of Pennsylvania’s elected officials have gone to great lengths to support this project. The Corbett administration enticed Shell to build this plastic factory in Pennsylvania by offering Shell a tax break for each barrel of fracked gas it buys from companies in the state and converts to plastic (valued at $66 million each year). The state declared the construction site a Keystone Opportunity Zone, giving Shell a 15-year exemption from state and local taxes. In exchange, Shell had to provide at least 2,500 temporary construction jobs and invest $1 billion in the state, giving the company an incredible amount of power to decide where resources are allocated in Pennsylvania.
Would the state have asked Shell for more than 2,500 construction jobs if it knew these jobs could be taken away when workers spoke out against life-threatening conditions? Will the politicians who have hailed oil and gas as the only job creator in the region care when workers are forced to hide their identity when communicating with public agencies?
The PA DEP appears to have played a key role in calling for this investigation, yet the agency itself was recently at the center of a different investigation led by Pennsylvania Attorney General Josh Shapiro. The resulting Investigating Grand Jury Report revealed systematic failure by the PA DEP and the state’s Department of Health to regulate the unconventional oil and gas industry. One of the failures was that the Department seldom referred environmental crimes to the Attorney General’s Office, which must occur before the Office has the authority to prosecute.
The Office of Attorney General is involved in this investigation, which the PA DEP is referring to as noncriminal.
The Grand Jury Report also cited concerns about “the revolving door” that shuffled PA DEP employees into higher-paying jobs in the oil and gas industry. The report cited examples of PA DEP employees skirting regulations to perform special favors for companies they wished to be hired by. The watchdog research organization Little Sis listed 47 fracking regulators in Pennsylvania that have moved back and forth between the energy industry, including Shell’s Government Relations Advisor, John Hines.
The Falcon Pipeline sits empty as people across the nation are amping up pressure on President Biden to pursue bold action in pursuit of environmental justice and a just transition to clean energy. Following Biden’s cancellation of the Keystone XL pipeline, Indigenous leaders are calling for him to shut down other projects including Enbridge Line 3 and the Dakota Access Pipeline.
Over a hundred groups representing millions of people have signed on to the Build Back Fossil Free campaign, imploring Biden to create new jobs through climate mobilization. Americans are also pushing Biden to be a Plastic Free President and take immediate action to address plastic pollution by suspending and denying permits for new projects like the Shell ethane cracker that convert fracked gas into plastic.
If brought online, the Falcon pipeline and Shell ethane cracker will lock in decades of more fracking, greenhouse gasses, dangerous pollution, and single-use plastic production.
Just as concerning, Shell will need to tighten its parasitic grip on the state’s economic and legislative landscape to keep this plant running. Current economic and political conditions are not favorable for the Shell ethane cracker: financial analysts report that its profits will be significantly less than originally presented. If the plant is brought online, Shell’s lobbyists and public relations firms will be using every tactic to create conditions that support Shell’s bottom line, not the well-being of residents in the Ohio River Valley. Politicians will be encouraged to pass more preemptive laws to block bans on plastic bags and straws to keep up demand for the ethane cracker’s product. Lobbyists will continue pushing for legislation that imposes harsh fines and felony charges on people who protest oil and gas infrastructure, while oil and gas companies continue to fund police foundations. Shell will ensure that Pennsylvania keeps extracting fossil fuels to feed its ethane cracker.
The Falcon pipeline is at odds with global demands to address plastic and climate crises. As these new documents reveal, it also poses immediate threats to residents along its route. While we’re eager for more information from state and federal agencies to understand the details of this investigation, it’s clear that there is no safe way forward with the Falcon Pipeline.
Royal Dutch Shell has been exerting control over people through the extraction of their natural resources ever since it began drilling for oil in Dutch and British colonies in the 19th Century. What will it take to end its reign?
Health & Safety | Legislation & Politics | Petrochemicals & Plastics | Pipelines
A new collaboration between FracTracker Alliance and Algalita is aiming to help middle school and high school students understand the connection between plastics and fracking — and the wide ranging implications for climate change, environmental injustice, and human health.
Most young people today understand that plastics are problematic. But, there is still often a disconnect between the symptom of plastics in our oceans, and the root causes of the problem. Algalita’s mission is to empower a new generation of critical thinkers to shift the broken and unjust systems that are causing the plastic pollution crisis. Algalita’s strategy is creating educational experiences directly with the movement’s diverse leaders, and this new project with FracTracker is a perfect example.
Specifically, Algalita and FracTracker have been working together to add new lessons to Algalita’s brand-new online, gamified, action platform: Wayfinder Society. Through this program, students can guide their own exploration of the complexities of the plastics issue, and can take action at their own pace and scale, by completing lessons and action-items (called Waymarks) based on difficulty, topic, and type of impact.
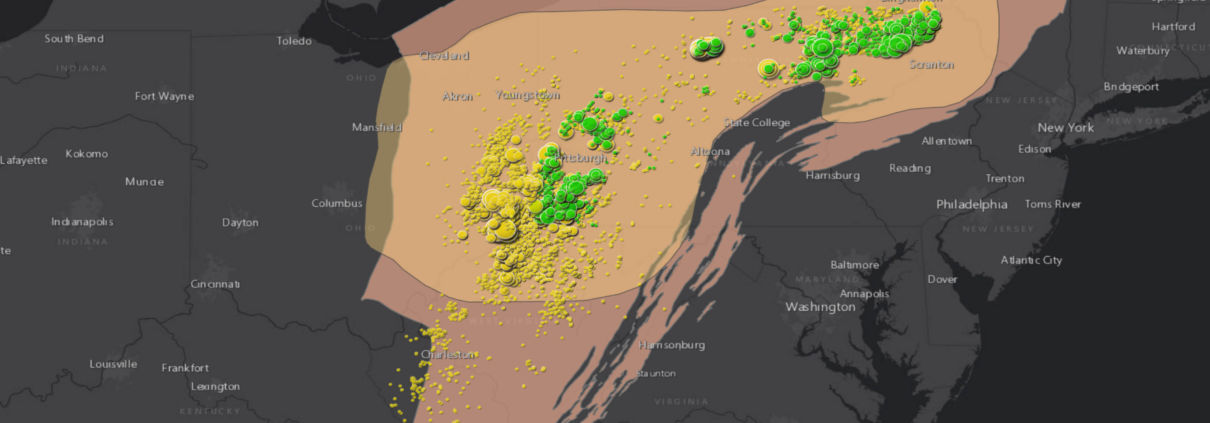
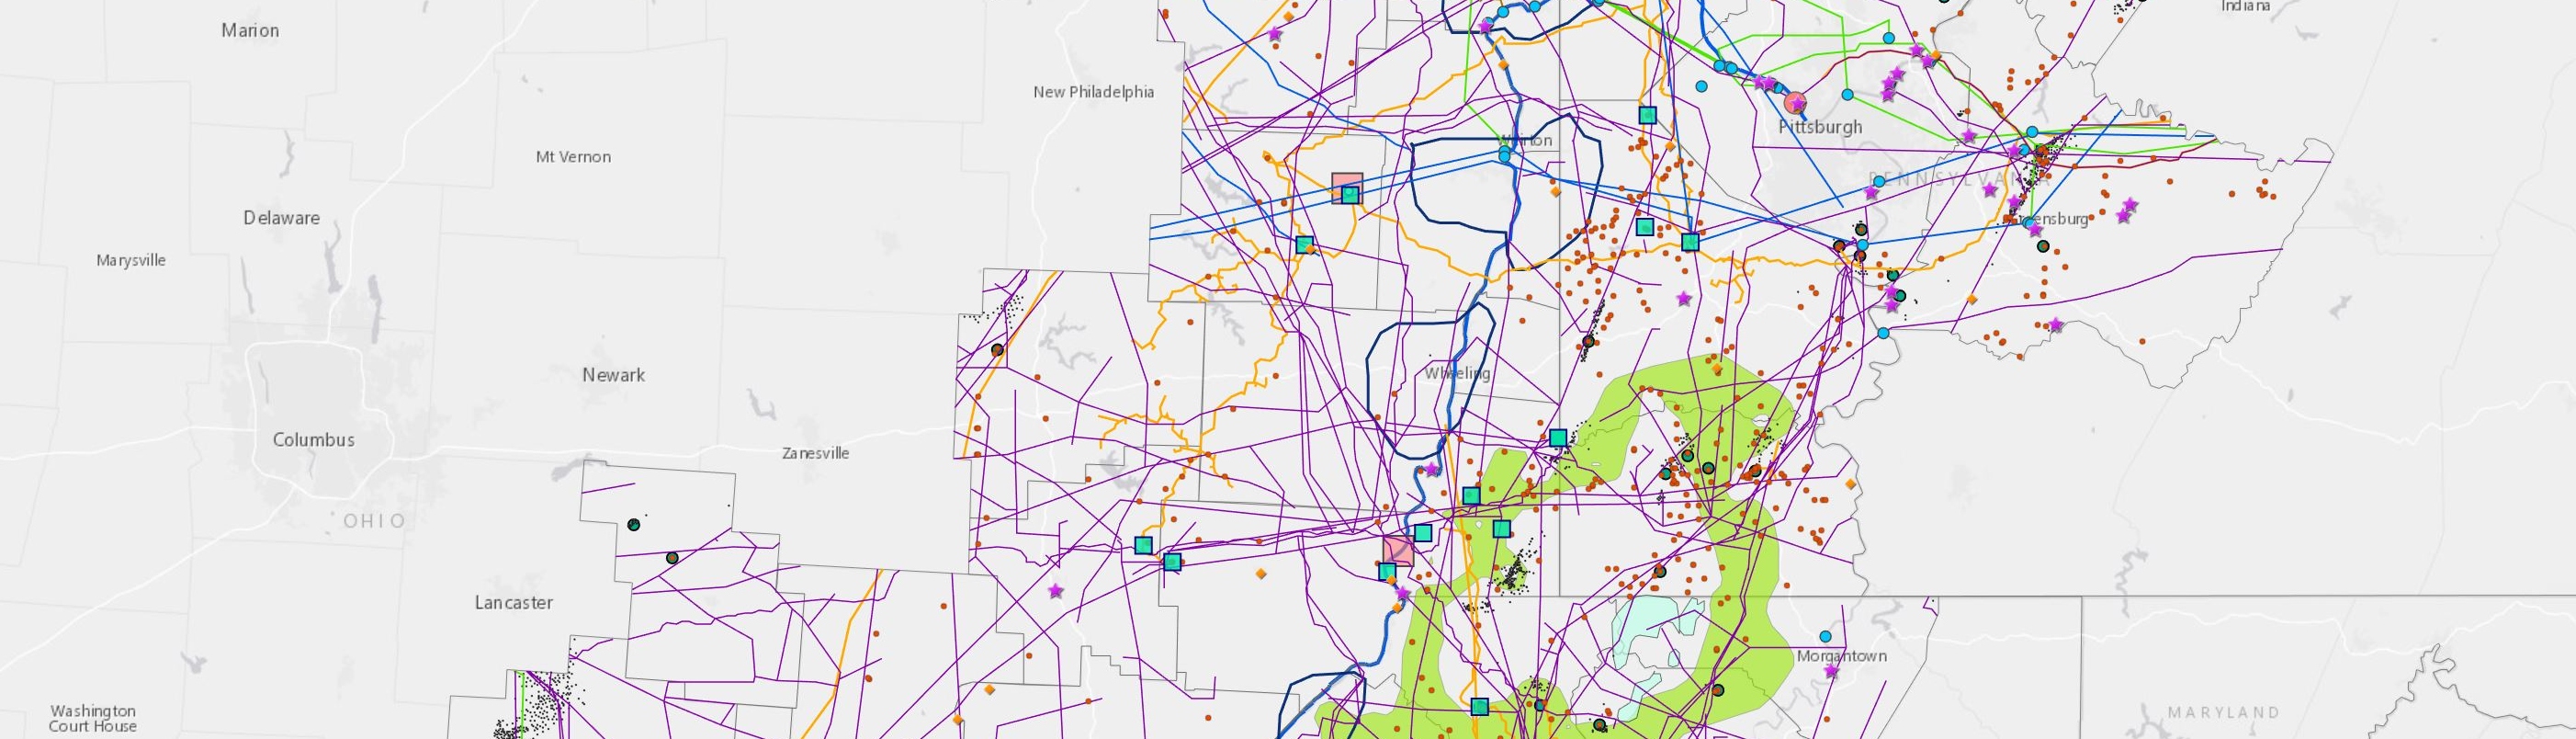
The first of two FracTracker Waymarks outlines the connection between fracking and plastic production. Students explore a map showing the full plastics production process from fracking pads, to pipelines, to ethane crackers, and packaging factories.
In a second Waymark that builds off of the first, students explore the massive petrochemical buildout on the Gulf Coast and in the Ohio River Valley. The map allows students to analyze the greenhouse gas emissions predicted for this buildout using the data point pop-up boxes. They can also examine the effects of climate change on communities amongst the buildout by viewing the coastal flood zone areas in Texas and Louisiana. Beyond that, students can investigate how facilities are impacting their peers in schools close to massive ethane cracker facilities. Finally, students are introduced to the movement’s #PlasticFreePresident Campaign, giving them a direct action to apply their new knowledge.
This StoryMap was created by FracTracker for Wayfinder Society, a program by Algalita. Learn more at Algalita.org. Place your cursor over the image and scroll down to advance the StoryMap and explore a series of maps charting the fracking-for-plastic system. Click on the icon in the bottom left to view the legend. Scroll to the end of the StoryMap to learn more and access the data sources.
View Full Sized Map | Updated 11/20
Algalita is excited about this partnership for so many reasons. For one, GIS is a critical skill for young people to learn. These two Waymarks pose an accessible and non-intimidating introduction to ArcGIS by using simple maps and StoryMaps like the one above. The maps let students get comfortable with GIS concepts and capabilities like layers, data attribute tables, measuring tools, and filters. Allowing students to explore how plastics are produced through a geographical lens provides a unique visual and interactive experience for them. The goal is for students to be able to connect petrochem buildout, with the plastics, climate and justice issues that they are focusing on — often separately. Our aim is that by putting this part of the story in context of real physical space they will more easily make those connections. We hope these lessons spark some students’ interest in mapping, geography, and GIS, providing a new generation of changemakers with GIS in their toolbox.
On top of that, we are stoked to be building this partnership with FracTracker because the success of our collective movement depends on strong, clear communication and synergies between the nodes of the movement’s network. The FracTracker Waymarks give our Wayfinders direct access to real-time data, visualizations, and expert insights that they can then use to level-up their actions and stories around their activism. And, they connect the dots not just for students, but also for educators and movement partners like us at Algalita — we are all for this powerful lever for change!
Check out Wayfinder Society here. Access the FracTracker Waymarks here and here — but you’ll need to be logged in. If you’re a student, get started by creating a profile, and then start earning Cairns (points)! If you’re an educator, parent or mentor, and interested in exploring the site, email us here for the guest login.
By Anika Ballent, Education Director, Algalita
Algalita empowers a new generation of critical thinkers who will shift the broken and unjust systems that are causing the plastic pollution crisis. We do this by offering educational experiences created directly with the movement’s diverse leaders.
Anika has been working in the movement against plastic pollution for ten years, studying microplastics in benthic and freshwater environments. She brings together her science background and creativity to educate young changemakers through hands-on experiences in schools, Algalita’s International Youth Summit, and online programs.
Data Sources:
Fracked Wells: Pennsylvania Department of Environmental Protection
ATEX Pipeline: EIA
Railroad: Selection from ArcGIS online
Process information: Houston Chronicle
Falcon Pipeline: Shell/AECOM and FracTracker Alliance
Mariner East 2 Pipeline: PA DEP
Greenhouse gas emission increases: Environmental Integrity Project. (2020, November 30). Emission Increase Database. Retrieved from https://environmentalintegrity.org/oil-gas-infrastructure-emissions.
All other data points were mapped by FracTracker Alliance referencing various online sources. While this map is based on actual infrastructure, it is intended as a model of the fracking-for-plastic lifecycle and certain steps may vary in real life.
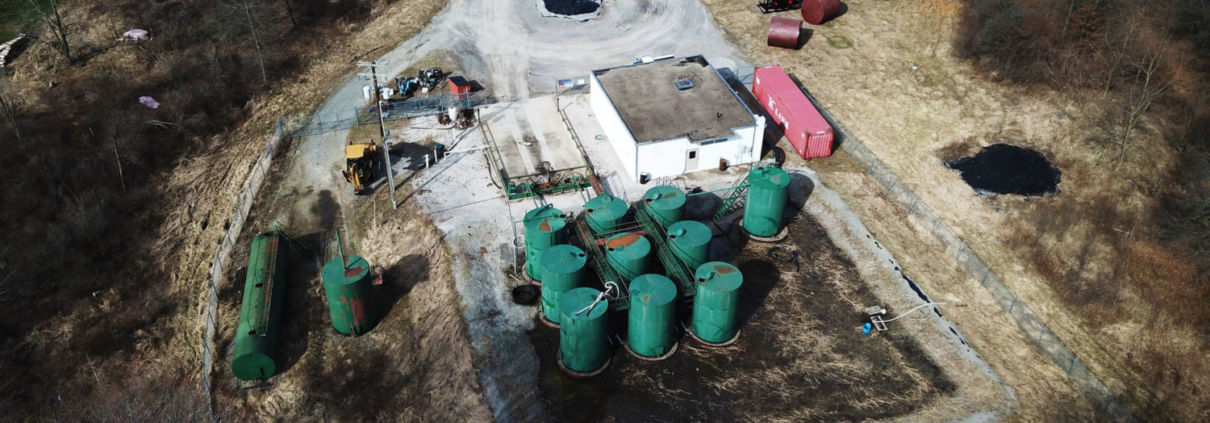
Fracking produces more than just oil and gas — billions of gallons of highly toxic waste are also created in the process. Regulatory loopholes have led to limited oversight into how this waste is tracked and treated, putting public health and safety at risk.
The maps below explore issues related to fracking waste from the Marcellus and Utica Shale regions of Pennsylvania, Ohio, New York, and West Virginia.
This mapping platform is an evolving tool based on available data — yet the opaqueness of the fracking industry limits our ability to map and analyze the full scope of the problem of fracking waste in the Appalachian Basin.
Unfortunately, even after sifting through thousands of data points, we’re left with many outstanding questions — what are the chemical components of the waste created? Where is it all sent? Where are its byproducts sent? What facilities are being planned and proposed? How much illegal dumping occurs?
The production of fracking waste in the Appalachian Basin will continue to create environmental and public health threats for decades after the industry leaves the region. Wells can continue to generate wastewater for years and contaminated equipment sent to landfills will leach toxins into the environment. Furthermore, with the industry’s history of failing to restore land after it has been used for oil and gas operations, we can expect abandoned fracking sites to become an increasing source of pollution in the Appalachian Basin in the coming decades. It’s imperative that the public have access to accurate and detailed data on fracking waste to protect the health of workers and residents.
By Erica Jackson, Community Outreach & Communications Specialist, FracTracker Alliance
The virtual story map is live!
In this special one-day fundraiser event, two intrepid FracTracker teams will build and share a live virtual map as we travel throughout the Ohio River Valley Region documenting oil, gas, and its effects on our health, climate, and environment.
We’ll share our findings to build awareness about the plight of this region—and so many other places victimized by this rogue industry. Plus, viewers will gain a firsthand understanding of how FracTracker turns data into real-world impact.
Proceeds will benefit the ongoing work of FracTracker to decarbonize our economy and promote environmental justice.
Whether you are able to contribute financially at this time or not, we hope you’ll join us on this virtual journey. You’ll see regular video updates along the way as we share our progress, and watch as a story map is updated throughout the day.
Join our team of explorers in spirit and pledge your support! We’re excited to share this journey with you.
![]()
216 Franklin St, Suite 400, Johnstown, PA 15901
Phone: +1 (717) 303-0403 | info@fractracker.org
FracTracker Alliance is a 501(c)3 non-profit: Tax identification number: 80-0844297