Trends in Proposed State Legislation to Weaken Environmental Regulations
As the oil and gas industry feels pressure from former allies and see lending windows from their most loyal banking partners begin to dry up, they will be forced to cut costs elsewhere, and cut corners everywhere. This will come in the form of more industry-friendly regulations on the federal level under the current administration, as well as less stringent oversight at the state level. These trends are explicit manifestations of their desperation and influence.
The state-level laws the oil and gas industries are advocating for can easily fly under the radar. Most people just don’t have the bandwidth to educate themselves on the quiet development of these bills, nor to advocate against them. Much of the public’s attention is understandably focused on the COVID-19 pandemic, mass unemployment, and racial inequality. And, much of the critical attention around oil and gas legislation has correctly focused on the critical infrastructure legislation and related policy proposals we focused on in Part I of this series.
Below, we outline current attempts to weaken environmental regulations in Ohio, North Dakota, and Michigan. It is important to note that this is not an all-inclusive outline, but rather the bills we are aware of through our network of frontline and nonprofit contacts.
Ohio’s House Bill 545
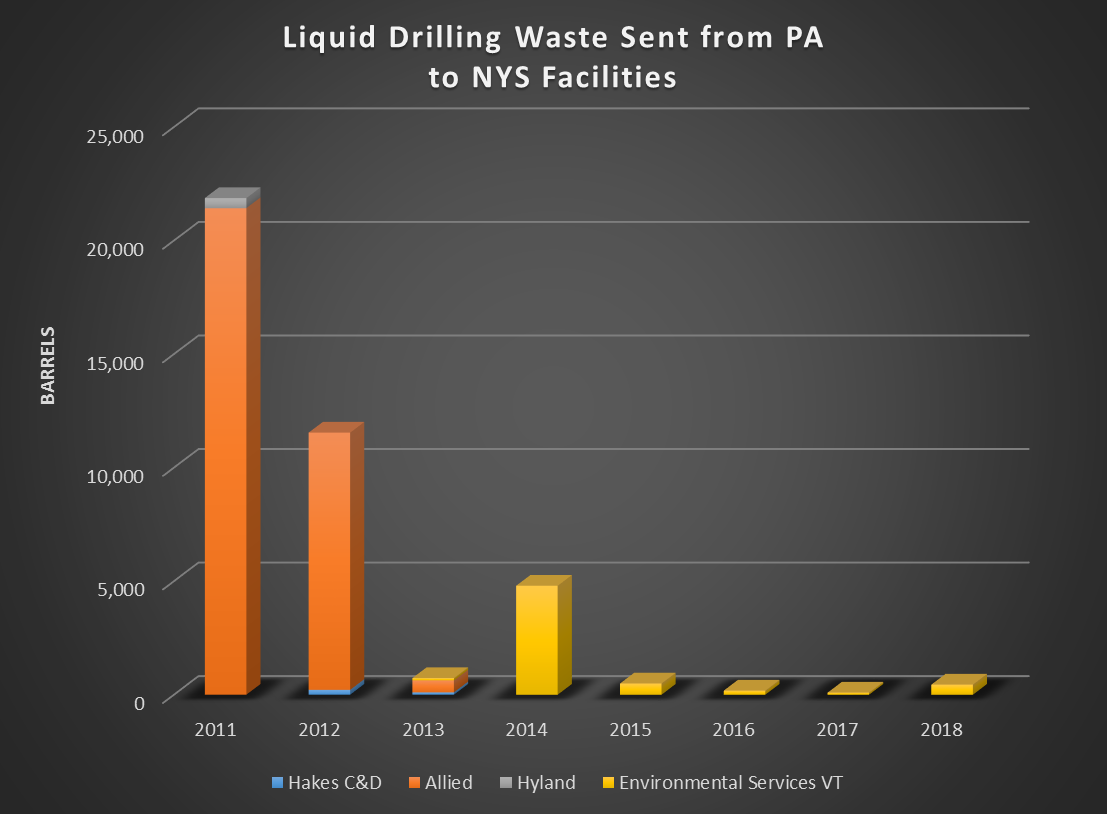
A bill that would be hazardous to the health of all Ohioans, HB 545, intended to “Establish conditions for sale of brine as a commodity,” was introduced by first-term State Representative Adam Holmes, and second-termer Craig Riedel of Western Ohio. This bill would charge the Ohio Department of Natural Resources’ (ODNR) Division of Oil and Gas Resources Management with establishing “conditions and requirements for the sale of brine from oil or gas operations as a commodity, and to exempt that commodity from requirements otherwise applicable to brine.” What could possibly go wrong? The dangers of potentially highly radioactive fracking waste have been known for years, and were recently detailed in great reporting by Justin Nobel for Rolling Stone. Countless others have spent years crying out against radioactive fracking waste being produced, transported, and disposed of all across the Appalachian regions of Ohio, Pennsylvania, and West Virginia.
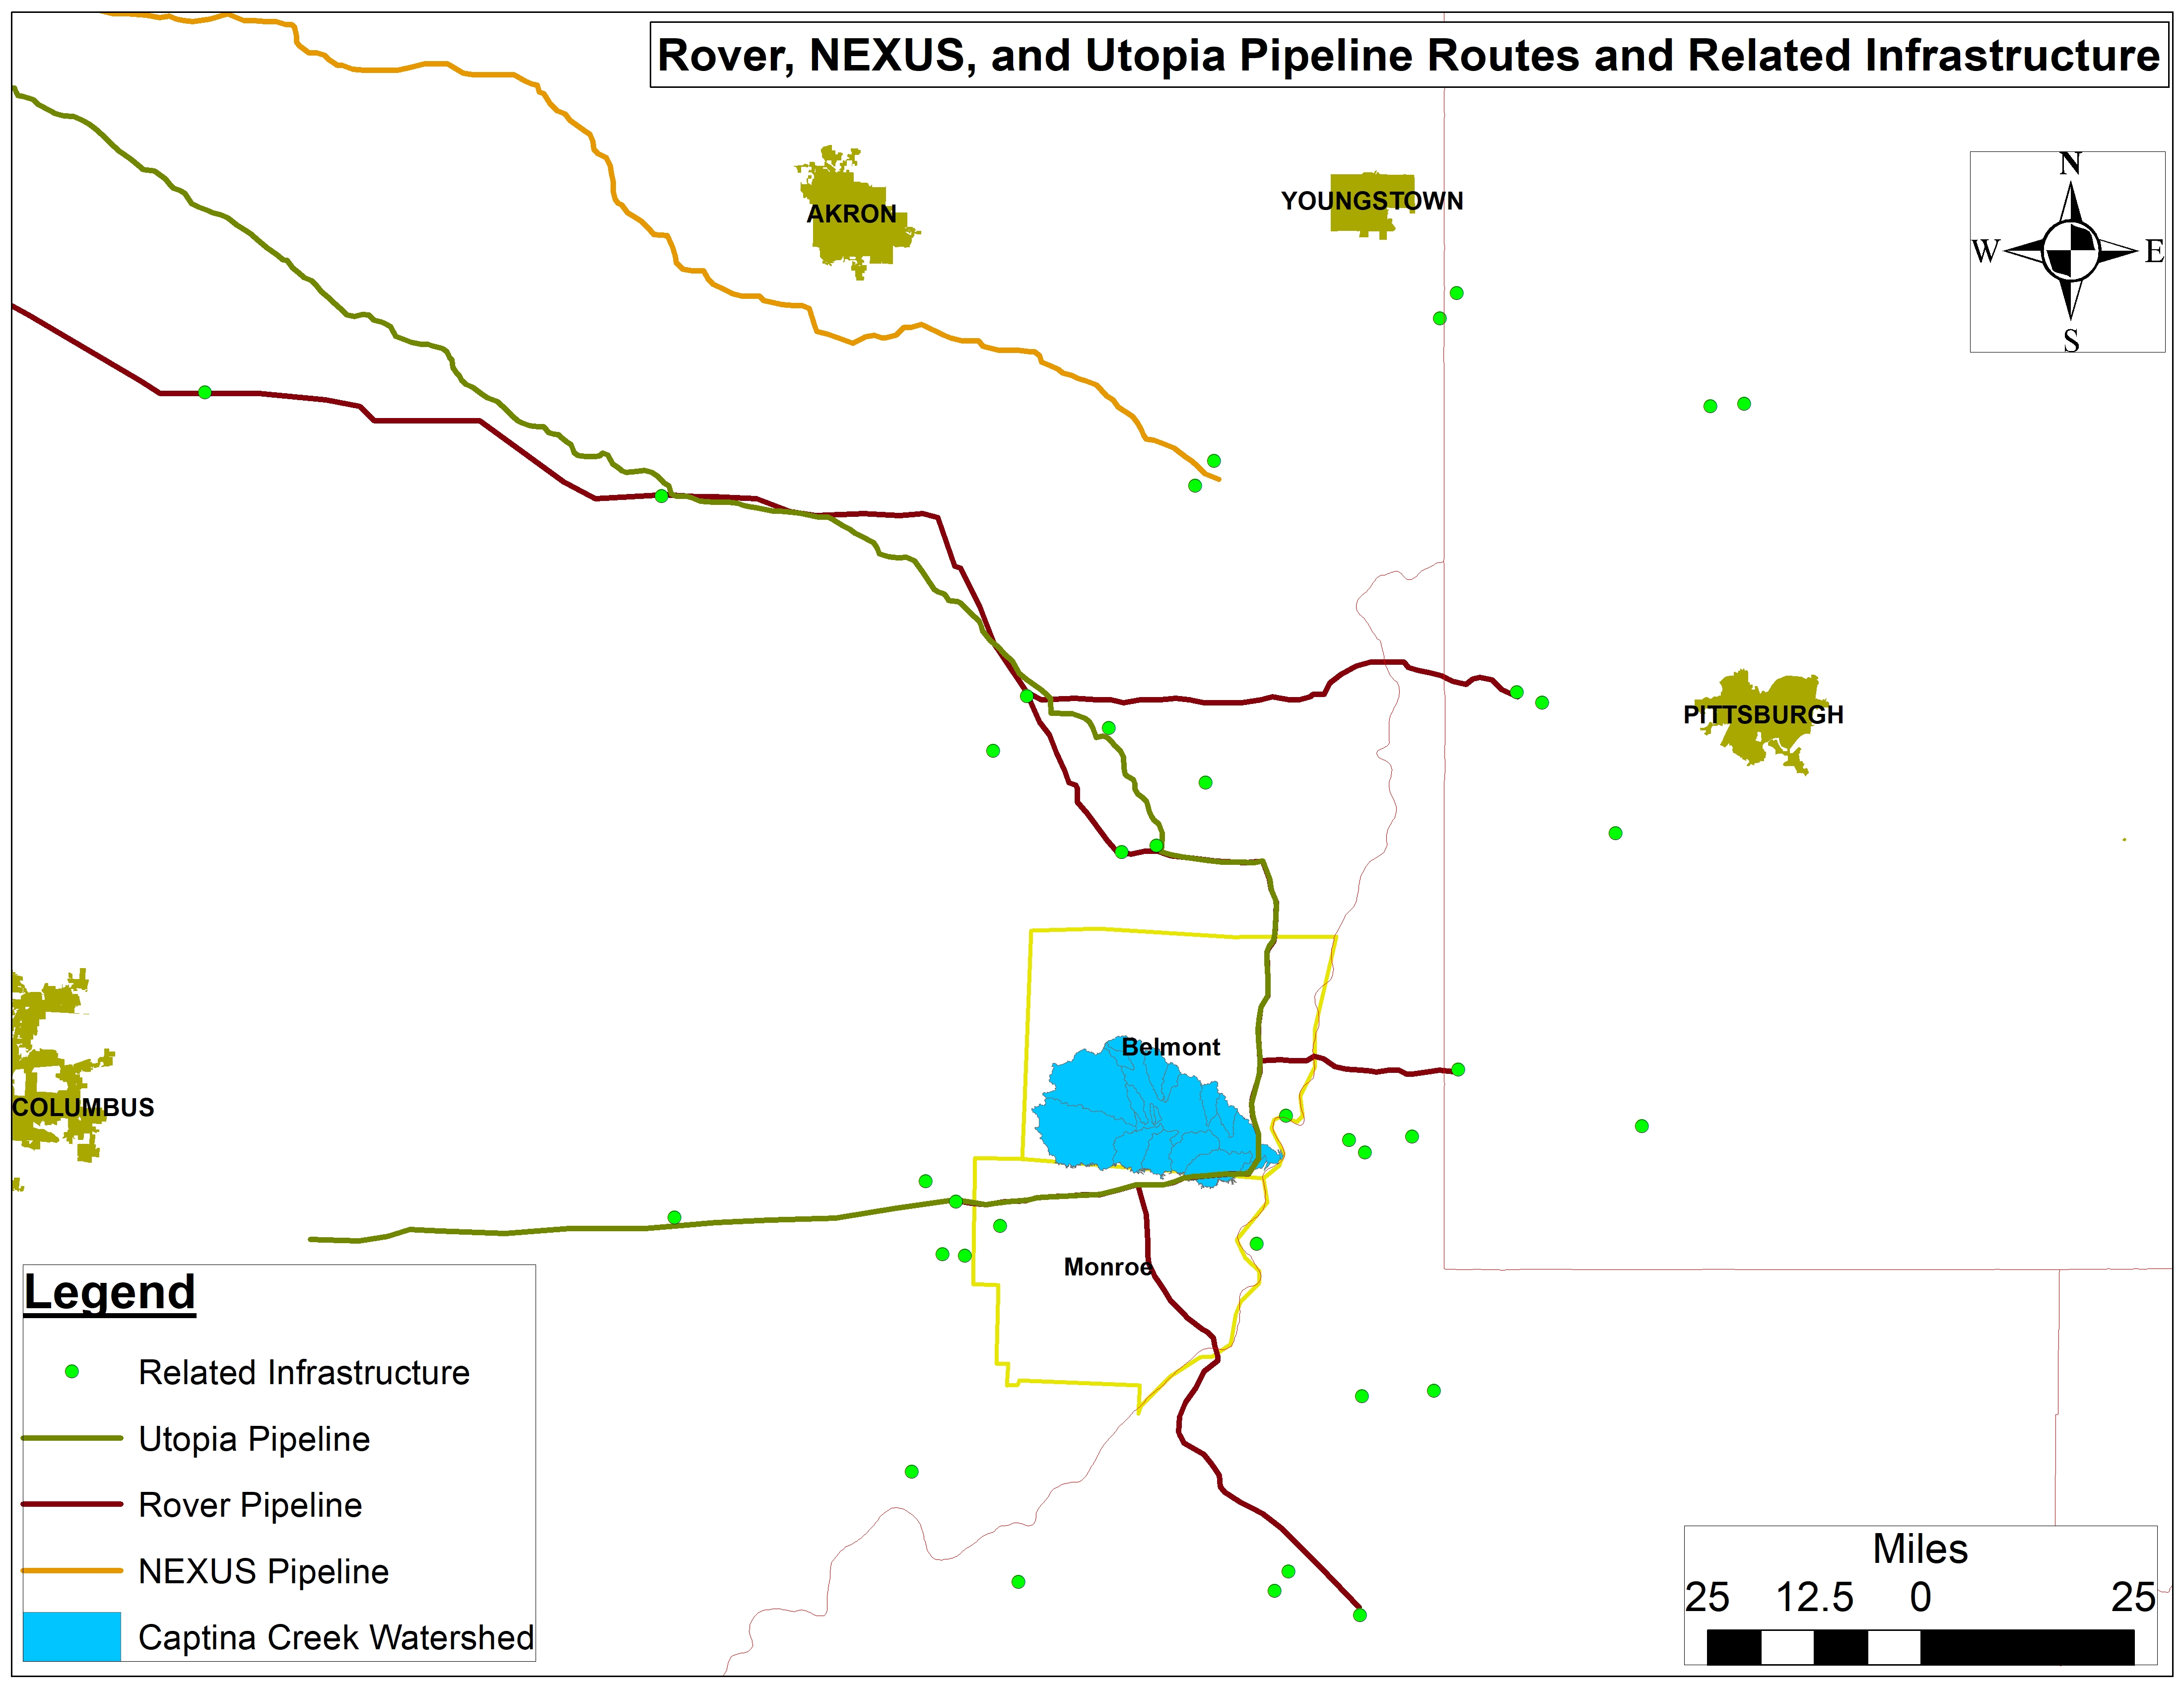
So, quite a bit could – and likely would – go horribly wrong if we allow ODNR to put lipstick on this fracking waste pig, as it were. The worst part about this is that Representative Holmes knows, (or at least should know), better, given that he lives in Nashport, roughly two miles south of a very active Class II Salt Water Disposal Well, and just a couple more miles from nearly a dozen more injection wells (Figure 1).
Figure 1. Existing and Pending Ohio Class II Salt Water Disposal Injection Wells and Proposed Fracking Waste Docks.
In Ohio, it isn’t just about legislation. As part of the Division of Oil & Gas Resources Management’s ongoing Five Year Rule Review, a change was made to the Ohio Administrative Code (OAC) that went into effect last October. This change permits a saltwater disposal well owner to submit “on or before the fifteenth day of February of each calendar year … a statement of the volume of brine injected in the well for the immediately preceding calendar year.”
This change from quarterly to annual reporting will have profound implications for what little monitoring citizens are permitted. Clearly, the state has little interest or money to conduct monitoring.
An example of how great the lag could be, and how annual data will essentially be useless for any real-time concerns and/or incidents, the current year’s brine volume data will not be available until February 2021, and even then, the operator will have chances to revise the data. FracTracker has been compiling this data quarterly for years, and we will continue to make data that does exist publicly available.
One has to ask who prompted the demand for this change, and who exactly is on The Oil & Gas Division’s review committee. From the vantage point of most Ohioans concerned about this issue, this reporting change is going in the opposite direction of where a state with primacy over its Class II Wells should be going. When the US EPA has primacy over a state’s wells, as it does in Pennsylvania and Virginia, disposal volumes and pressures are reported annually, but the data are at least broken out monthly. (Note: More on Class II Well primacy and the language that allows states to maintain primacy will come in a future piece.)
As Buckeye Environmental Network Executive Director Teresa Mills and matriarch of the Ohio environmental watchdog community told me, “We have less and less and less information. While Pennsylvania’s website has its problems, it is 150% better than what citizens have access to in Ohio.”
Michigan’s Senate Bill 0431
Michigan’s Senate Bill 0431, introduced by Senate Democrat Adam Hollier in August 2019, was quickly reassigned to the Transportation and Infrastructure Committee in Lansing, after being originally introduced in the Natural Resources Committee. This is just the next step in taking away local control from communities. The language of the bill on Line ten states unapologetically that:
“A local unit of government shall not, by ordinance or otherwise, prevent, prohibit, or deny a permit, approval, or other authorization for the extraction, by mining, of natural resources from any property, by a person with property, possessory, or contractual rights to do so … if … The natural resources are valuable …[and] Very serious consequences would not result from the extraction of the natural resources … For purposes of this section, a consequence is very serious if it substantially exceeds the ordinary impacts of customary mining operations, and poses an actual and unnecessary risk to public health, safety, or welfare that cannot be avoided or ameliorated through the imposition of reasonable controls or conditions on the mining operations.”
If you ask residents of towns like Ludington and South Rockwood, Michigan, what it is like to live next to silica sand mines, they’ll tell you they have very little faith in the recently rebranded Michigan Department of Environment, Great Lakes, and Energy (DEGLE), formerly the Department of Environmental Quality (DEQ). This is the same DEQ that was responsible for the Flint water crisis, in which several of its employees plead no contest to misdemeanors related to their actions during the crisis.
When I called Senator Hollier’s office and asked what the motivation for this bill was, his staffer told me that in their eyes, if a mine proposal were to meet or exceed the rigorous requirements of DEGLE, then they felt it was important that no further hurdles be placed in the proposal’s way moving forward.
Another concern of Michiganders that I have spoken to about this bill, and silica sand mining in general, is this stipulation regarding bonding and reclamation:
“The amount of financial assurance shall be the product of $1,500.00 multiplied by the number of acres disturbed by mining operations, but not yet reclaimed, excluding roadways, plant sites, and open water areas that will remain after completion of reclamation … Reclaiming slopes of the banks of the excavation not exceeding one (1) foot vertical to three (3) feet horizontal, measured from the nearest setback line into any area disturbed by mining operations.”
Most folks believe: A) A bond of $1,500 is way too low, considering all the long-term damage from surface mining; B) The carving out for roadways, plant sites, and open water areas leaves a tremendous amount of any mine’s remaining footprint devoid of any chance of reclamation, and ensures potential environmental and human health hazards in perpetuity, and; C) The one foot rise over three feet run threshold leaves a vast amount of any mine’s footprint extremely unstable.
The general sentiment among Michigan nonprofit organizations is summed up by a note I received from Michigan Environmental Council (MEC) President & CEO Conan Smith, stating:
“I believe this bill is part of an intrigue that we’ve been monitoring as two very rich political donors fight over a proposed gravel mine [in] Metamora Township … one who owns the proposed mine, one who neighbors it and is opposed.
We are, as you might imagine, opposed to this bill. The exemption of local control and [the] presumption that an extractive operation is so necessary as to preempt other local concerns and priorities is in itself sufficiently egregious for us. However, this legislation would also leave the extractive industry almost entirely free of citing regulation, as there is no detailed process at the state level either.
The philosophical challenge we face here, as in many cases, is the tension between private property rights and public health, safety, and welfare. With this bill, the sponsors want a presumption that any activity on private land is reasonable, unless it results in a ‘very serious consequence,’ (a term which has basis in current law that this bill also erases). The new definition of seriousness would essentially be something that is not a normal part of the extractive action. Thus, for example, hundreds of trucks rolling down a dirt road might not be a very serious consequence because that’s just part of normal operations …”
In a sign of how quickly support for legislation shifts, and how elected officials will use crises like COVID-19 to push what Naomi Klein calls “Shock Doctrine,”[1] policy designed to facilitate a frictionless transition to “disaster capitalism,” MEC’s Policy Director Sean Hammond told us on May 21st of this year that, “Without the environmental community or local governments changing their positions, I see it very unlikely that this will move anywhere.” But just nine days later, MEC’s President and CEO emailed a group of those concerned about this bill, saying: “Bad news, friends. We learned yesterday that this bill has sudden new life and may be getting a hearing soon … We could certainly use help to dissuade lawmakers from taking this up.”
But much of the above has come from those at the policy level, living a healthy distance from Michigan’s mines. For the perspective of someone who actually lives next to a mine, I turned to a close friend and hero of mine, Doug Wood, and his wife Dawn, residents of South Rockwood in Monroe County, just a couple miles southwest of Detroit (Figures 3 and 4). Doug and Dawn sent me the following text regarding SB 0431:
“Ever since frac sand mining came to my community, the mine has expanded and accelerated, crushing silica 12 hours a day, right next to homes. It has been a constant battle to get the local government and the quarry to install air monitoring. Now the AGGREGATE industry is pushing to pass this law, Senate Bill 0431, which takes away all the local community’s controls, including [the control of] fugitive dust. I feel that if this law passes, it will be the end of a healthy, livable community.”
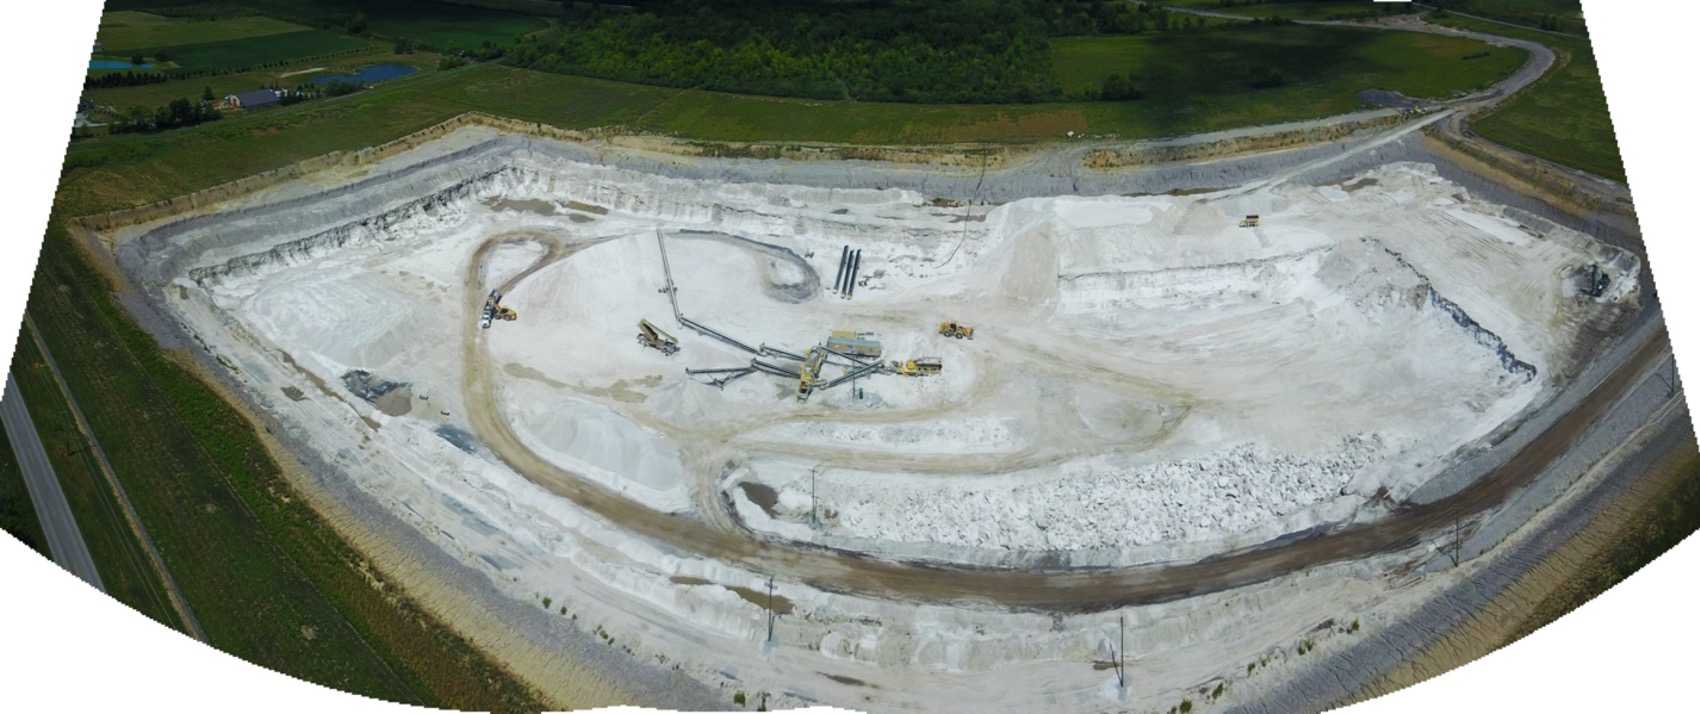
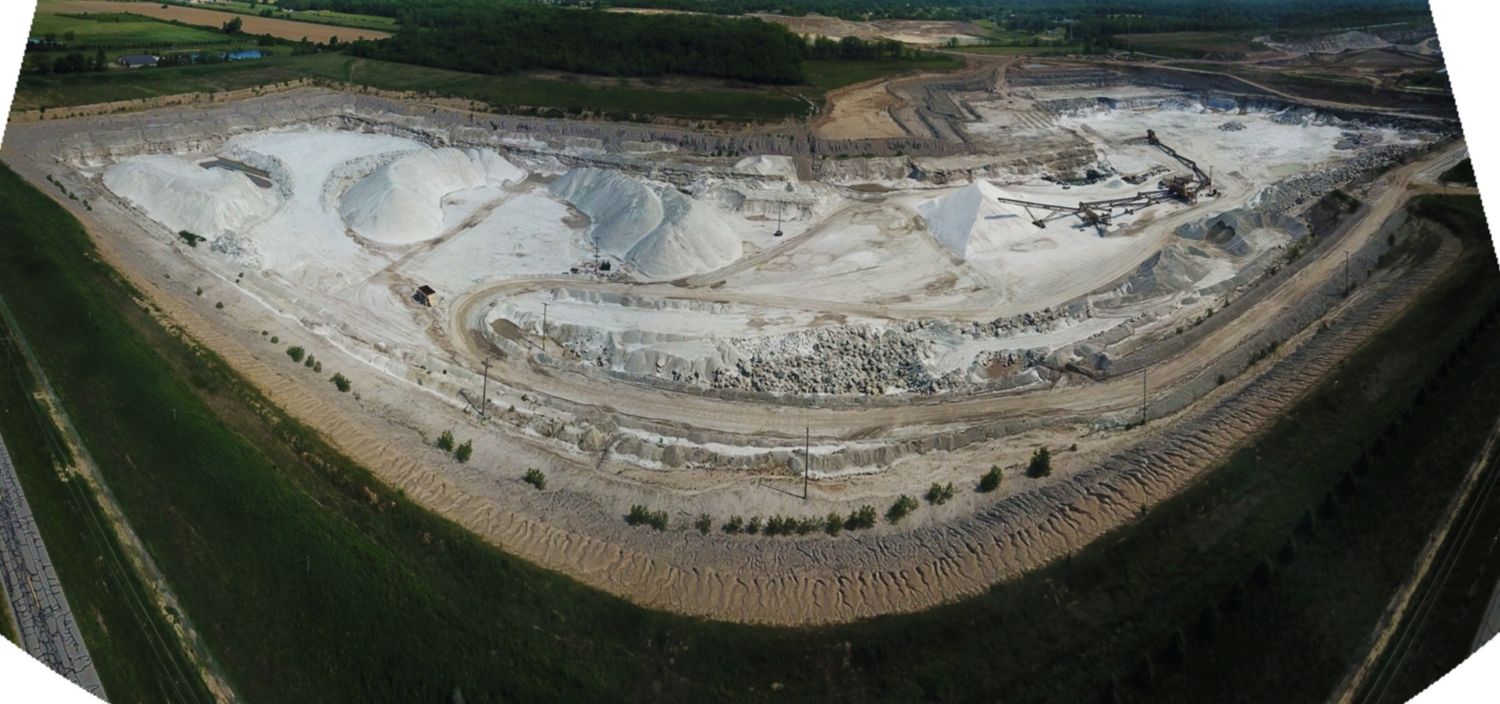
Figure 2. Current and Potential Silica Mining Activity, South Rockwood, Michigan, with Dawn and Doug Wood’s property in the southwest corner of the Light Green US Silica and Sylvanian Minerals Potential Polygon.

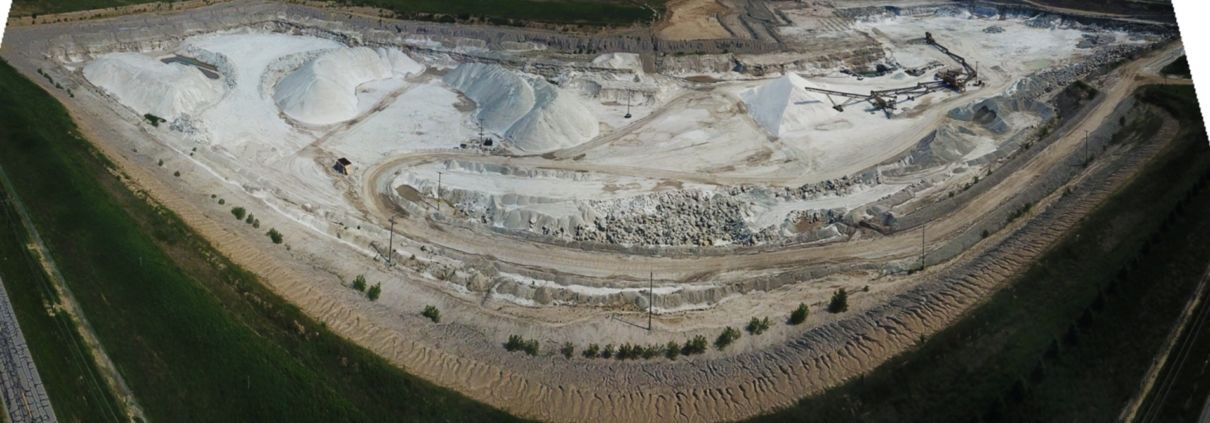
Figure 3. The Sylvanian Minerals/US Silica frac sand mine in South Rockwood, Michigan, in August 2017 (top) and June 2020 (bottom), with the Wood’s house to the left/west.
North Dakota’s Senate Bill 2344
North Dakota’s Senate Bill 2344 was first introduced to the Energy and Natural Resources Committee on January 21st of this year by Senators Jessica Unruh (R), Dwight Cook (R), and Donald Schaible (R). The North American oil and gas industry knows it has a massive waste issue that it can’t seem to get its collective head around, and in North Dakota, it has countered this structural uncertainty by claiming that landowners do not own the “subsurface pore space” beneath their property, and that this pore space entitles an operator to inject waste into such voids, without compensating landowners.
As Dakota Resource Council Executive Director Scott Skokos told me, “What I’ve heard from attorneys is that this is a taking. Prior to the law change, the porous ground beneath you was part of your property rights, but now it is the government’s … The reason is that it is a taking without compensation! At the legislative hearings, I’ve never seen so many ranchers and mineral owners at the legislature. They thought that because they are a privileged class they would be listened to, and they weren’t. When they got railroaded, they said, ‘What? The government doesn’t work for me?’” Many that are following this bill and associated legal efforts to challenge it think it has a good chance to make it all the way to the US Supreme Court, because it renders the state’s Oil and Gas Production Damage Compensation Act toothless.
Skokos went on to tell me that in “a prior world, where landowners actually had agency over their property in North Dakota, the state’s Century Code clearly stated in Section 38-11.1-04 that landowners were entitled to damages equivalent to ‘lost land value’ and/or ‘lost use of and access to the surface owner’s land.’”
In Mosser v. Denbury Resources, Inc.[2] in 2017, “Use of Pore Space,” and by association, SB 2344, began to percolate as a topic actually up for debate. The Mosser family did not contest the right of Denbury to dispose of fracking waste within their unitized area. This is only because they were hoping to get fair market value for waste disposal, if they would eventually have to incur the costs of damage to their property.
They alleged “claims for nuisance, for trespass and for damages under the Oil and Gas Production Damage Compensation Act.” Judge Charles Miller ruled in favor of the Mossers and stated clearly that surface owners did in fact own pore space; surface owners are entitled to the above damages resulting from pore space use; the surface owner does not have to demonstrate they are using the pore space; and most importantly, compensation per barrel that others are paying for fracking waste disposal may be used by landowners to determine damages.
This ruling was not to the industry’s liking, and they were determined to have the last word, so they worked with the aforementioned Republican Senators to write SB 2344, which contains tons of language regarding the use of pore space for natural gas and CO2 storage, as well as for Enhanced Oil Recovery (EOR) purposes. Senator Jessica Unruh, when not working on behalf of the good people of North Dakota’s District 33, is the Environmental Manager at Coyote Creek Mining Company. Also, it is important to note that Donald Schaible is the sole sponsor of HB 1426, mentioned earlier, that increased penalties for riot offenses.
The most jaw-dropping component of SB 2344 is that it would add a new definition to the state’s Century Code for the term “land,” to be defined as the solid material of earth – regardless of ingredients – but excluding pore space! Yes, those little voids in the rock beneath North Dakotans homes, or maybe up to and including cracks in the soil during dry summers, would not be classified as land, and ipso facto would not entitle landowners to damages if such voids were to be filled in with, say, radioactive fracking waste!
One can only hope that the “get off my land,” fiercely independent, and at times, Libertarian facade North Dakotans like to display will roar when this bill gets traction. I mean after all, isn’t the motto of Tea Party enthusiasts and Second Amendment zealots “Don’t Tread on Me?”
This is Part II of a two-part series on concerning legislation related to the oil, gas, and petrochemical industries. Part I focuses on repressive “critical infrastructure” bills intending to criminalize environmental protestors. Such legislation has already been passed in 11 states.
By Ted Auch, PhD, Great Lakes Program Coordinator
[1] Ms. Klein’s website describes the “Shock Doctrine” as the following: “It is a story about violence and shock perpetrated on people, on countries, on economies … [The Shock Doctrine] explodes the myth that the global free market triumphed democratically, and that unfettered capitalism goes hand-in-hand with democracy. Instead … it has consistently relied on violence and shock, and reveals the puppet strings behind the critical events of the last four decades.”
[2] For a helpful summary of what Mosser v. Denbury Resources, Inc. means to North Dakota landowners and the legal world more broadly, the reader can refer to pages eight to 11 of the University of North Dakota School of Law’s April 2019 “Energy Law Symposium”.


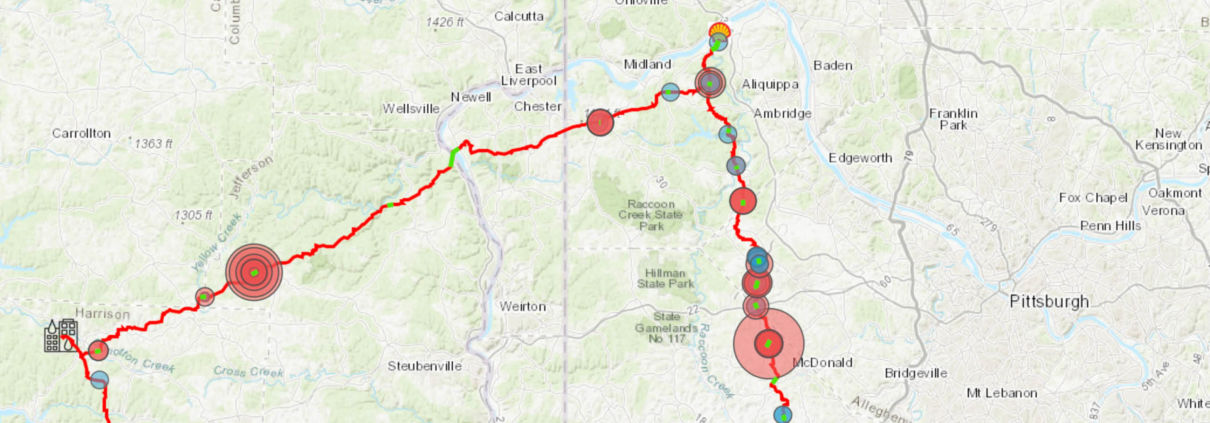


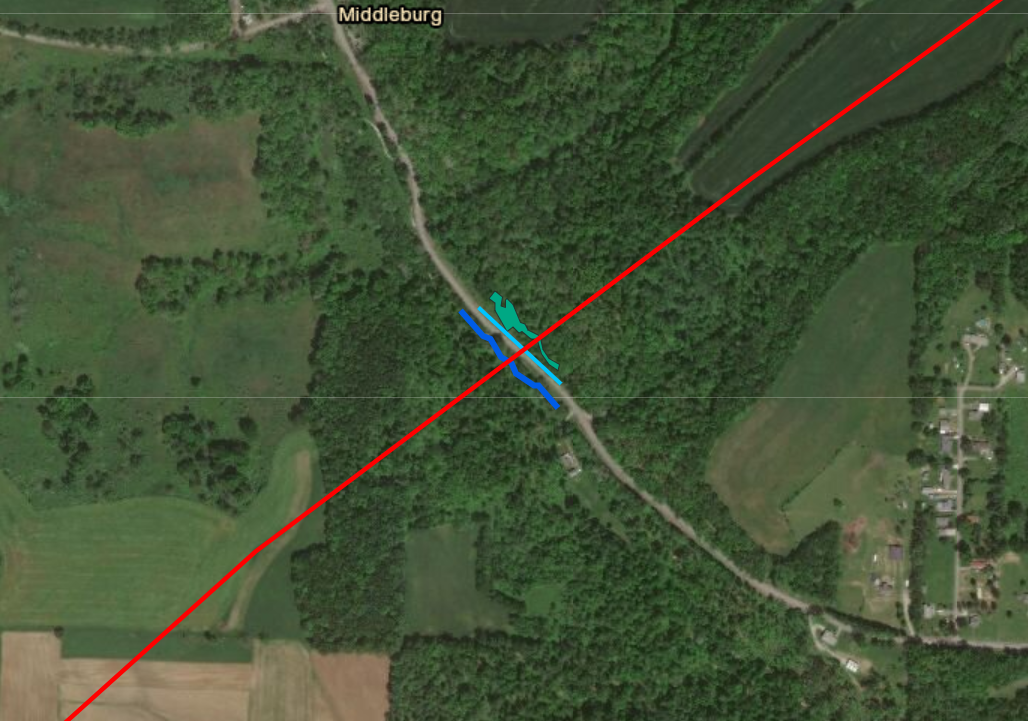
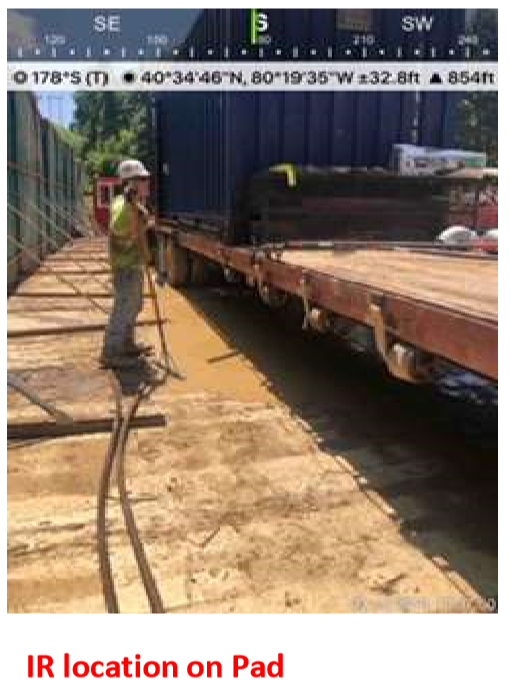


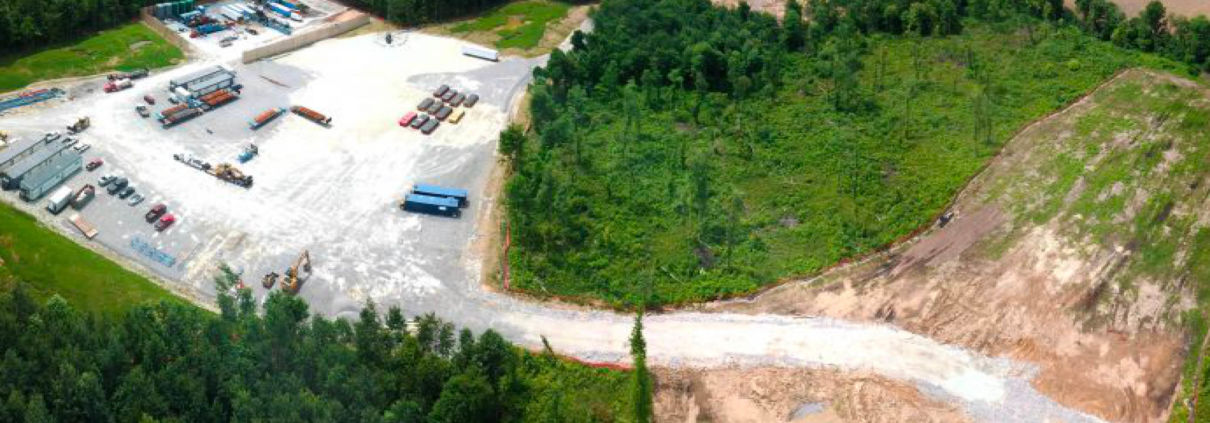


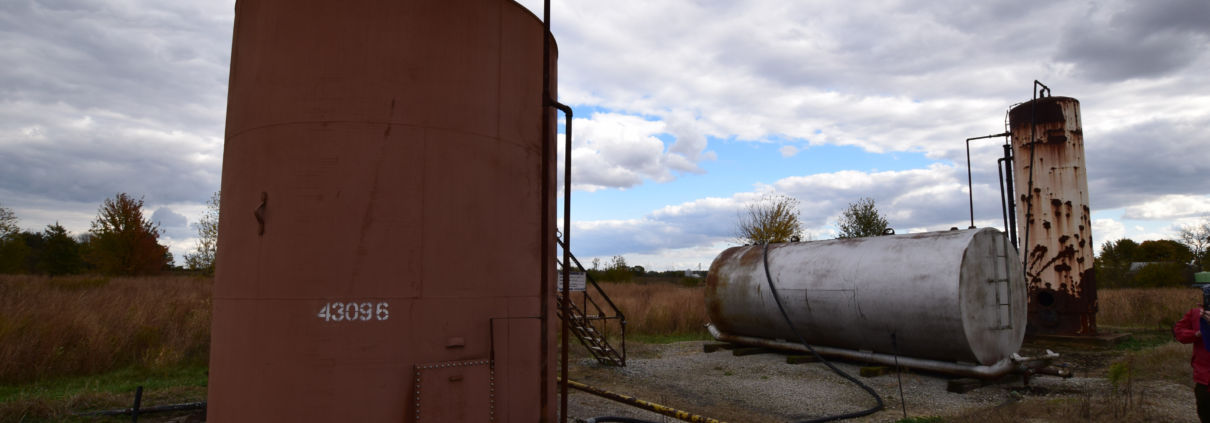
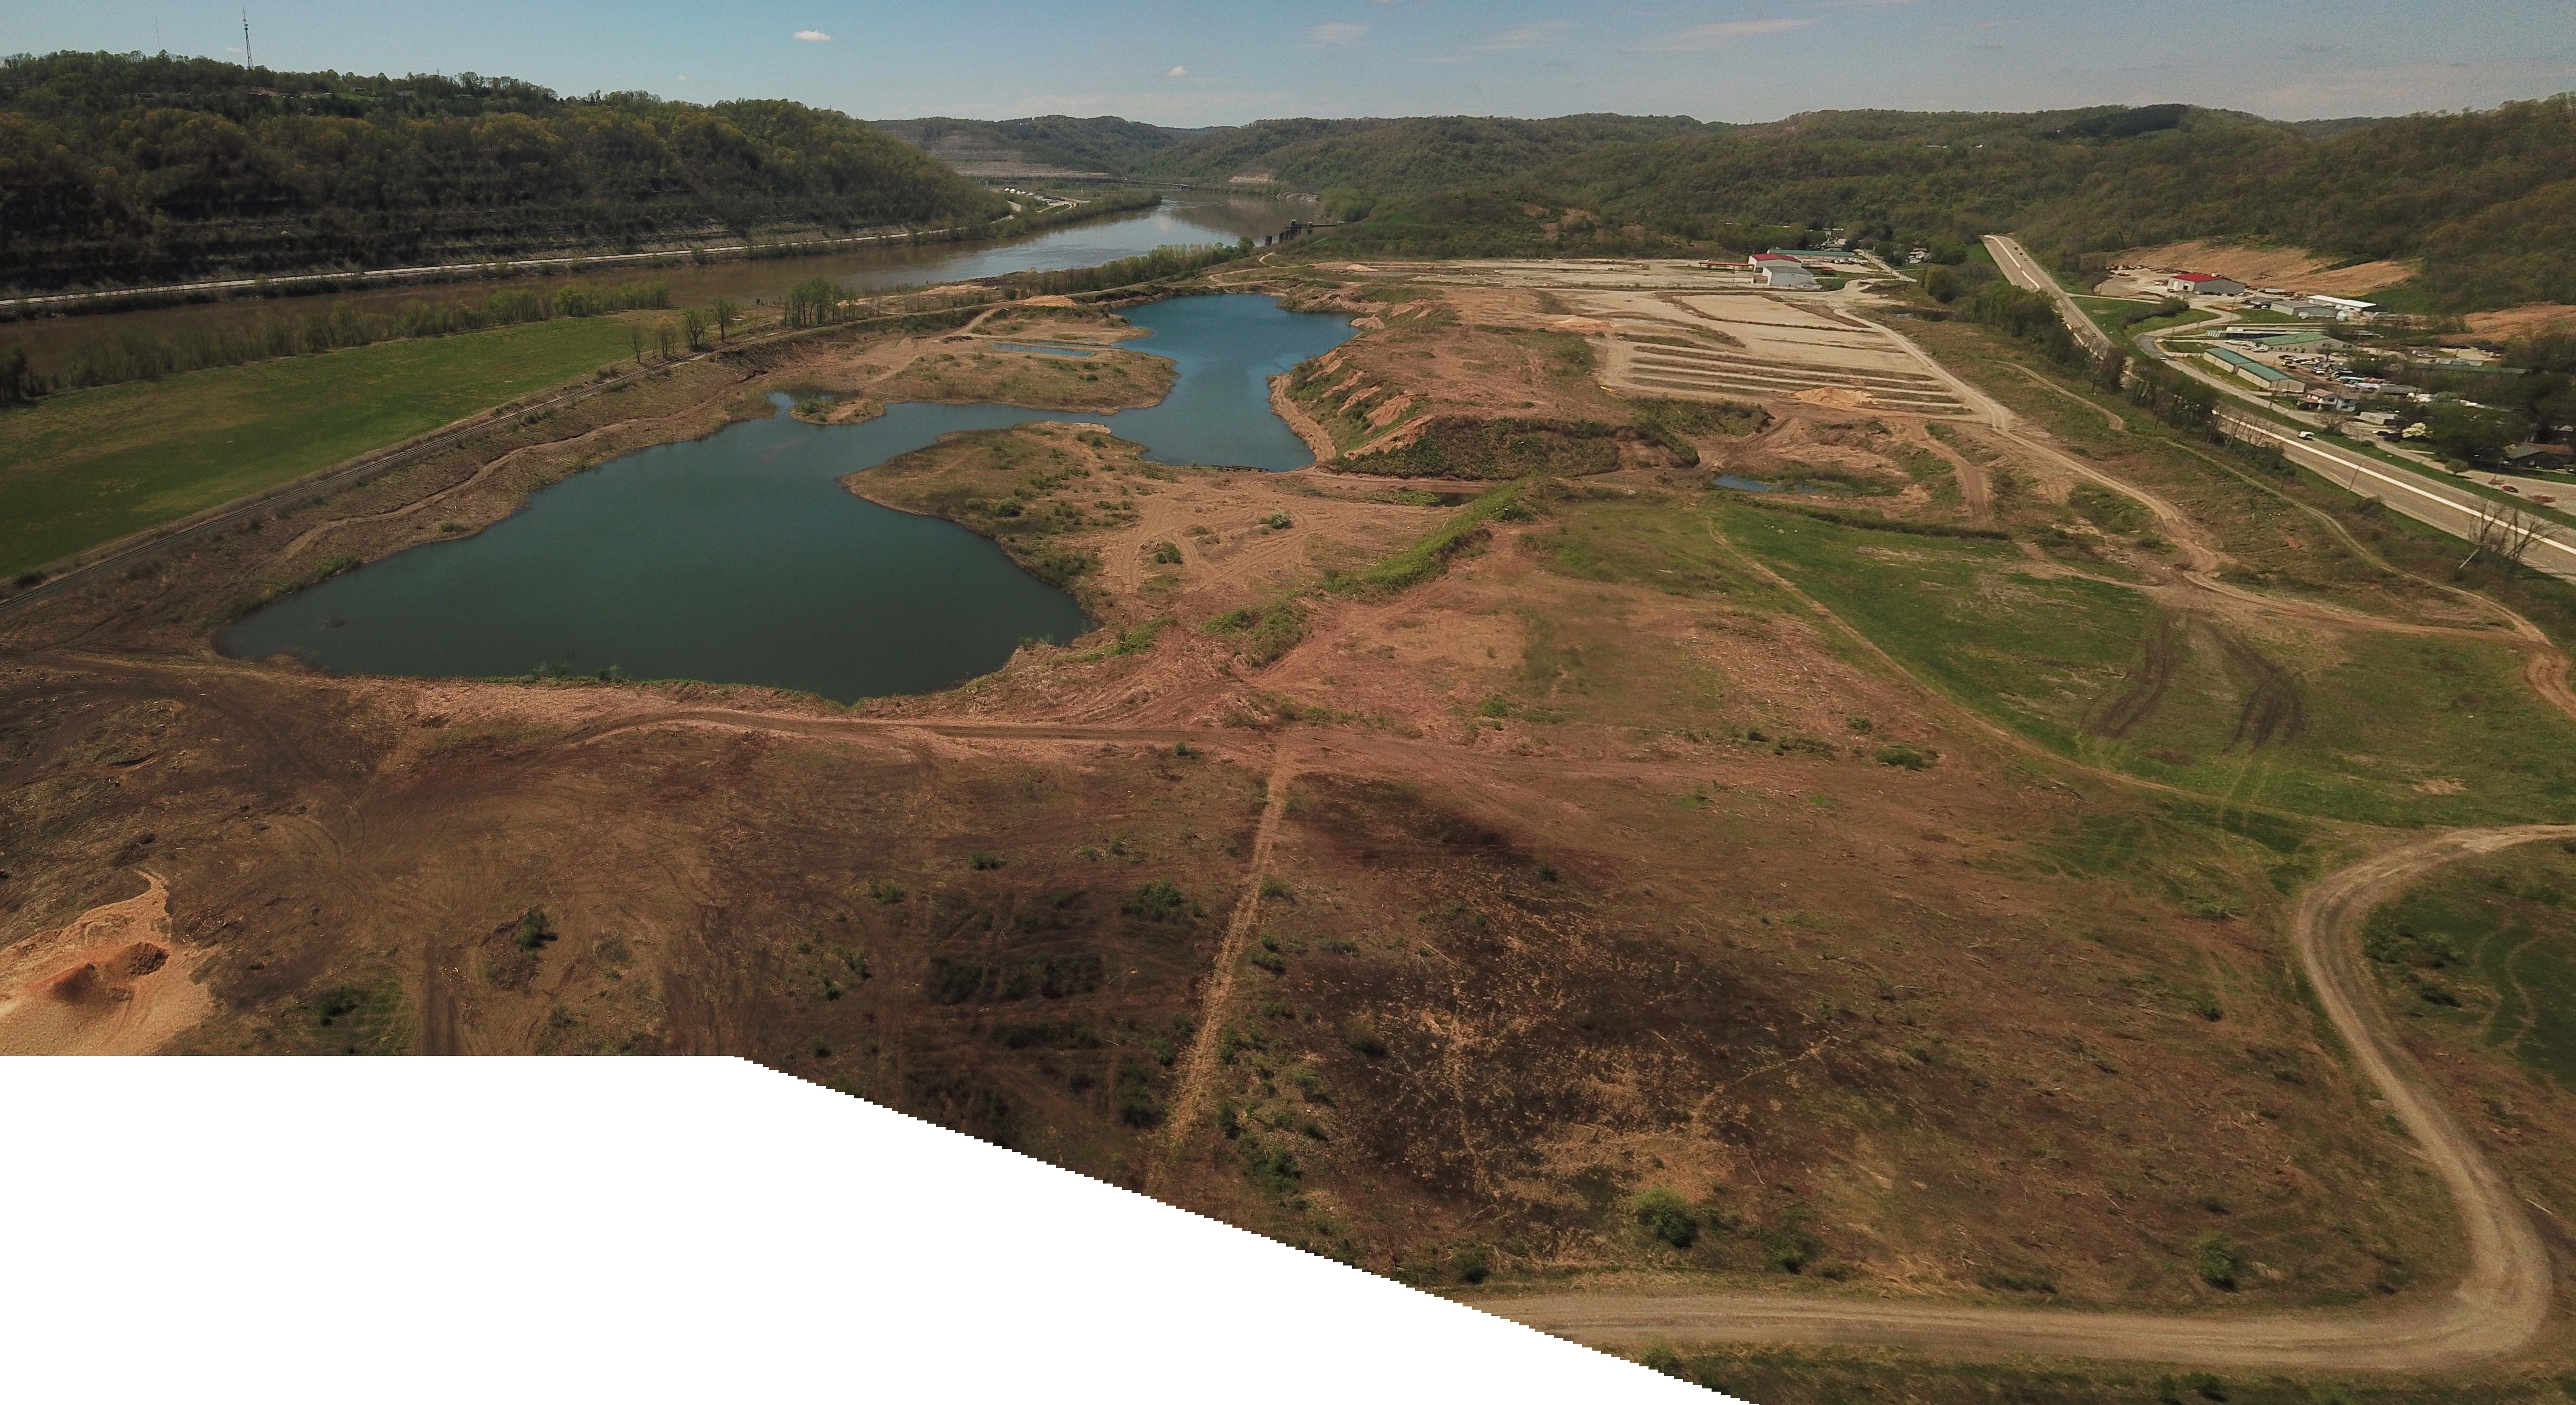
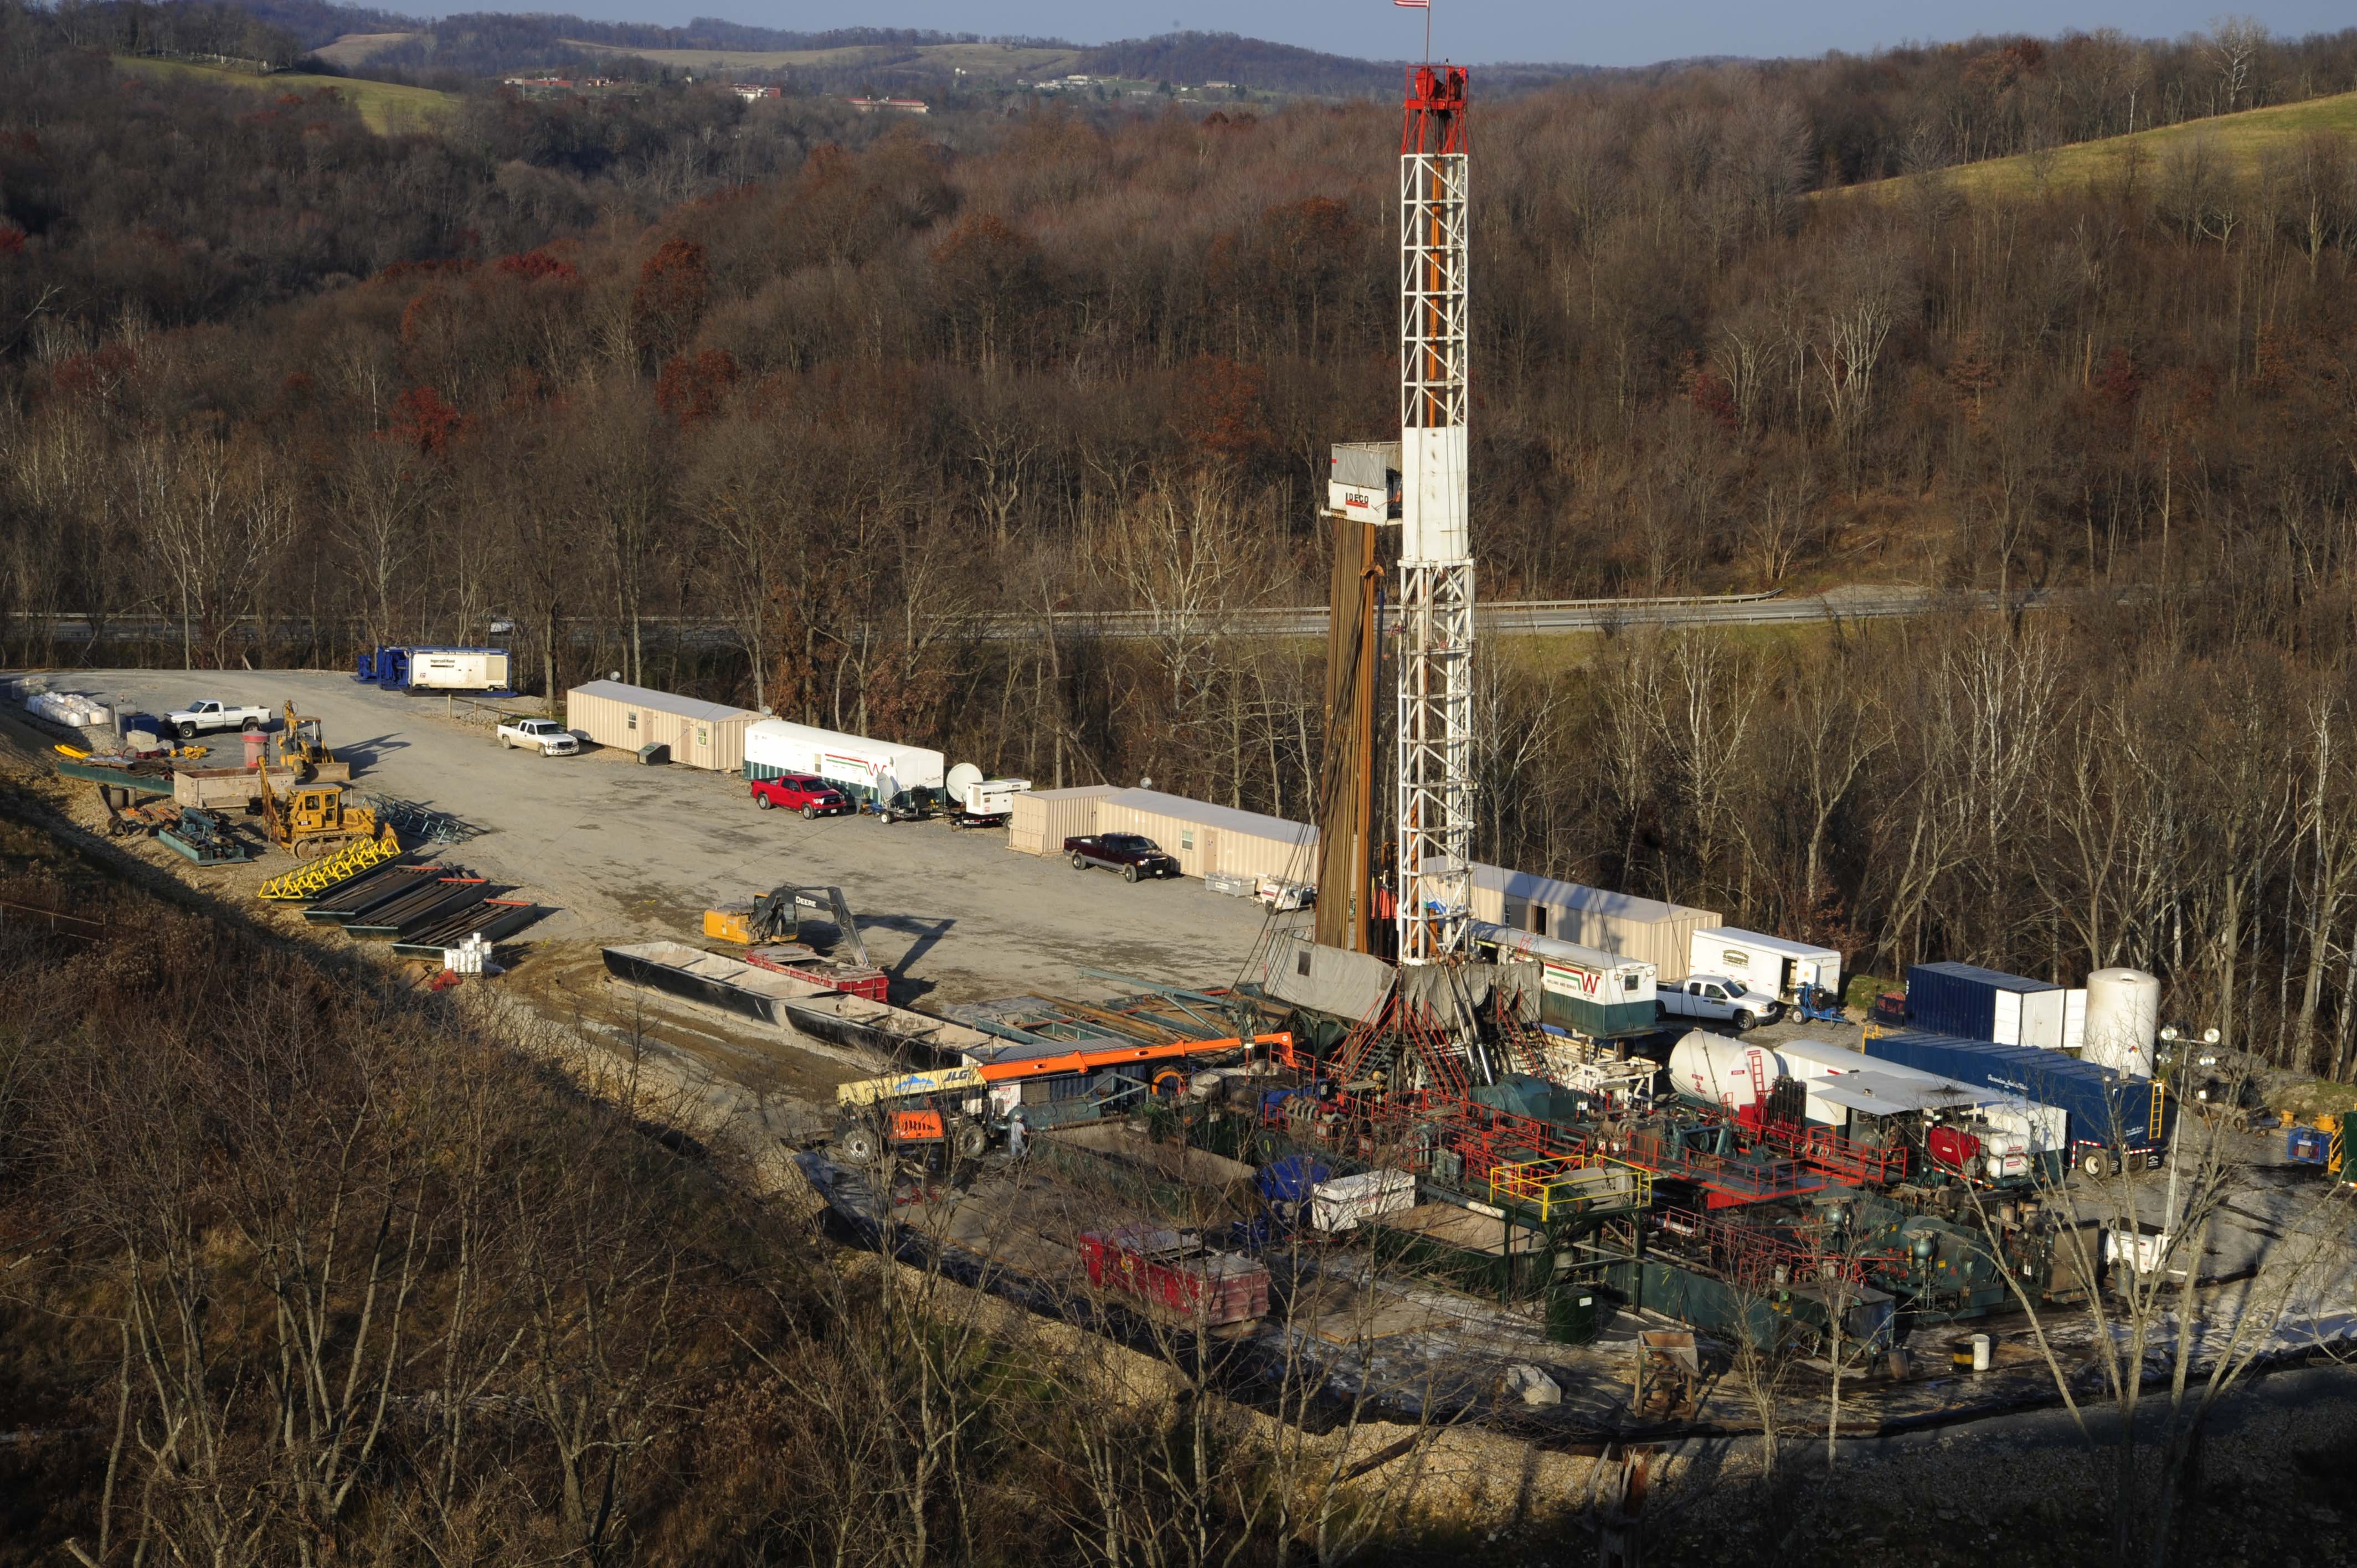
 Photo by Ted Auch, FracTracker Alliance
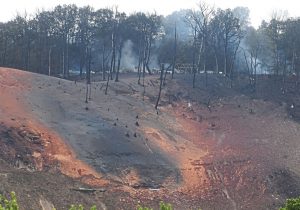