
Appalachian Ohio: Where Coal Mining, Fracking, and National Politics Converge
The head of Murray Energy Corporation, Robert Murray, is very close to the highest office in the land. Such an association demands a close look at the landscape from which this corporation and its founder arouse.
Belmont County, Ohio’s most famous tycoon Robert Murray has established a close relationship with the Trump administration. This connection dates back to his $300,000 contribution to Trump’s inauguration. The intimacy of this relationship has been given new weight recently when it was revealed that a hug between Mr. Murray and the Department of Energy’s Secretary Rick Perry preceded a meeting where Mr. Murray presented the administration with a memo outlining a 16-point plan for removing some of the burdensome regulations put in place by Mr. Murray’s least favorite person former President Barack Obama.
Among the few consistent themes from this most inconsistent of presidents has been a fondness for coal and steel, where brawny men do essential work and are threatened not by shifting economics, but by greenies and weenies who want to shut them down. Mr Trump and Mr Murray both want environmental rules rolled back—Mr Murray because it would be good for his bottom line, and Mr Trump because a second consistent aim of his presidency is to reverse anything done by Barack Obama. It is doubtful whether policy shifts alone could revive coal mining, but the attempt to do so says much about how vested interests operate in this administration… Mr Trump played a hard-nosed businessman on TV, but Mr Murray is the real thing. – The Economist, 2018
Not only has Mr. Murray succeeded in capturing the hearts and minds of the Trump administration, he has demanded that his $300,000 contribution get his longtime Oklahoman lawyer, and former aide to the senate’s chief climate skeptic James M. Inhofe of Oklahoma, the #2 spot behind Scott Pruitt at the EPA. Mr. Murray is so powerful that he managed to get Perry & Co. to fire the photographer that took the photo of the tender moment between Messrs. Perry and Murray.
Awkwardness aside, these situations could reasonably lead one to conclude that Perry and Pruitt are competing for Murray’s favor in the event they choose to run for higher office and need a patron with deep pockets. Mr. Murray would be in a real pickle if they both chose to run for the highest office in the land, with two fawning candidates potentially offering to one-up the other in terms of incentives and/or regulatory carve outs for Mr. Murray’s beloved King Coal.
Belmont County
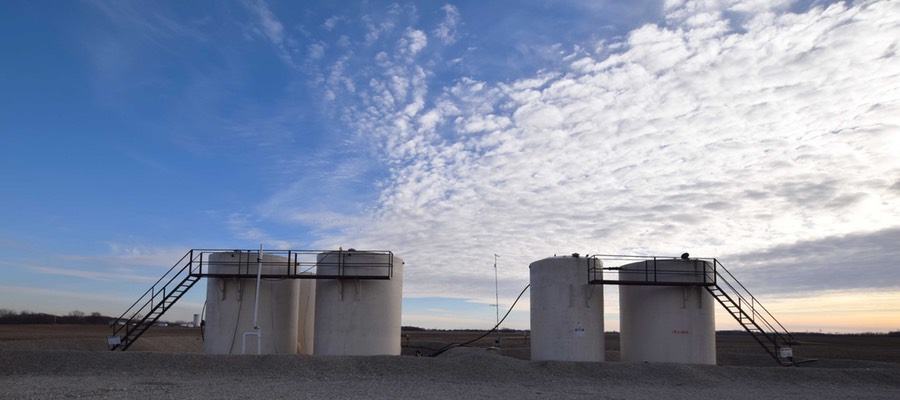
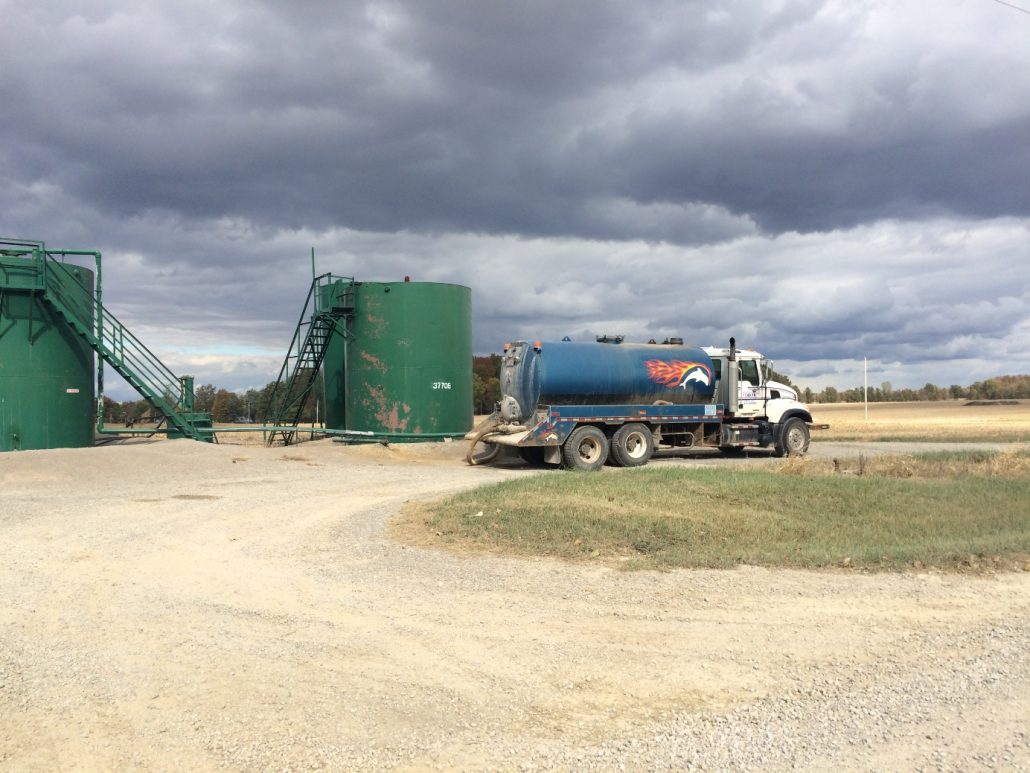
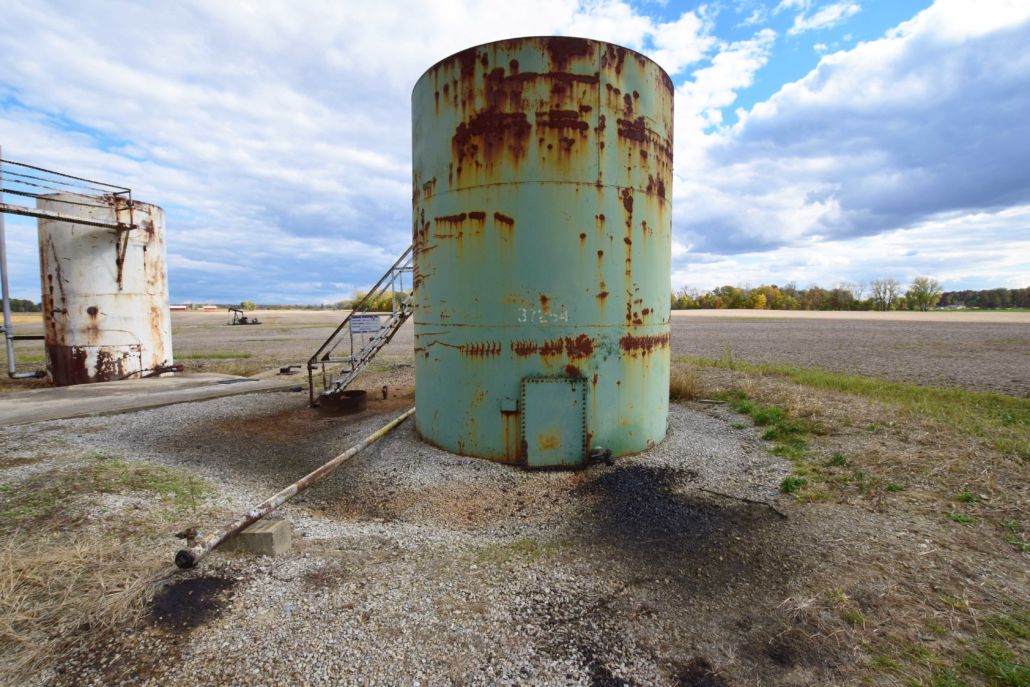
Once the heart of Ohio Coal Country, Belmont Co. is now a major player on the hydraulic fracturing landscape, as well.
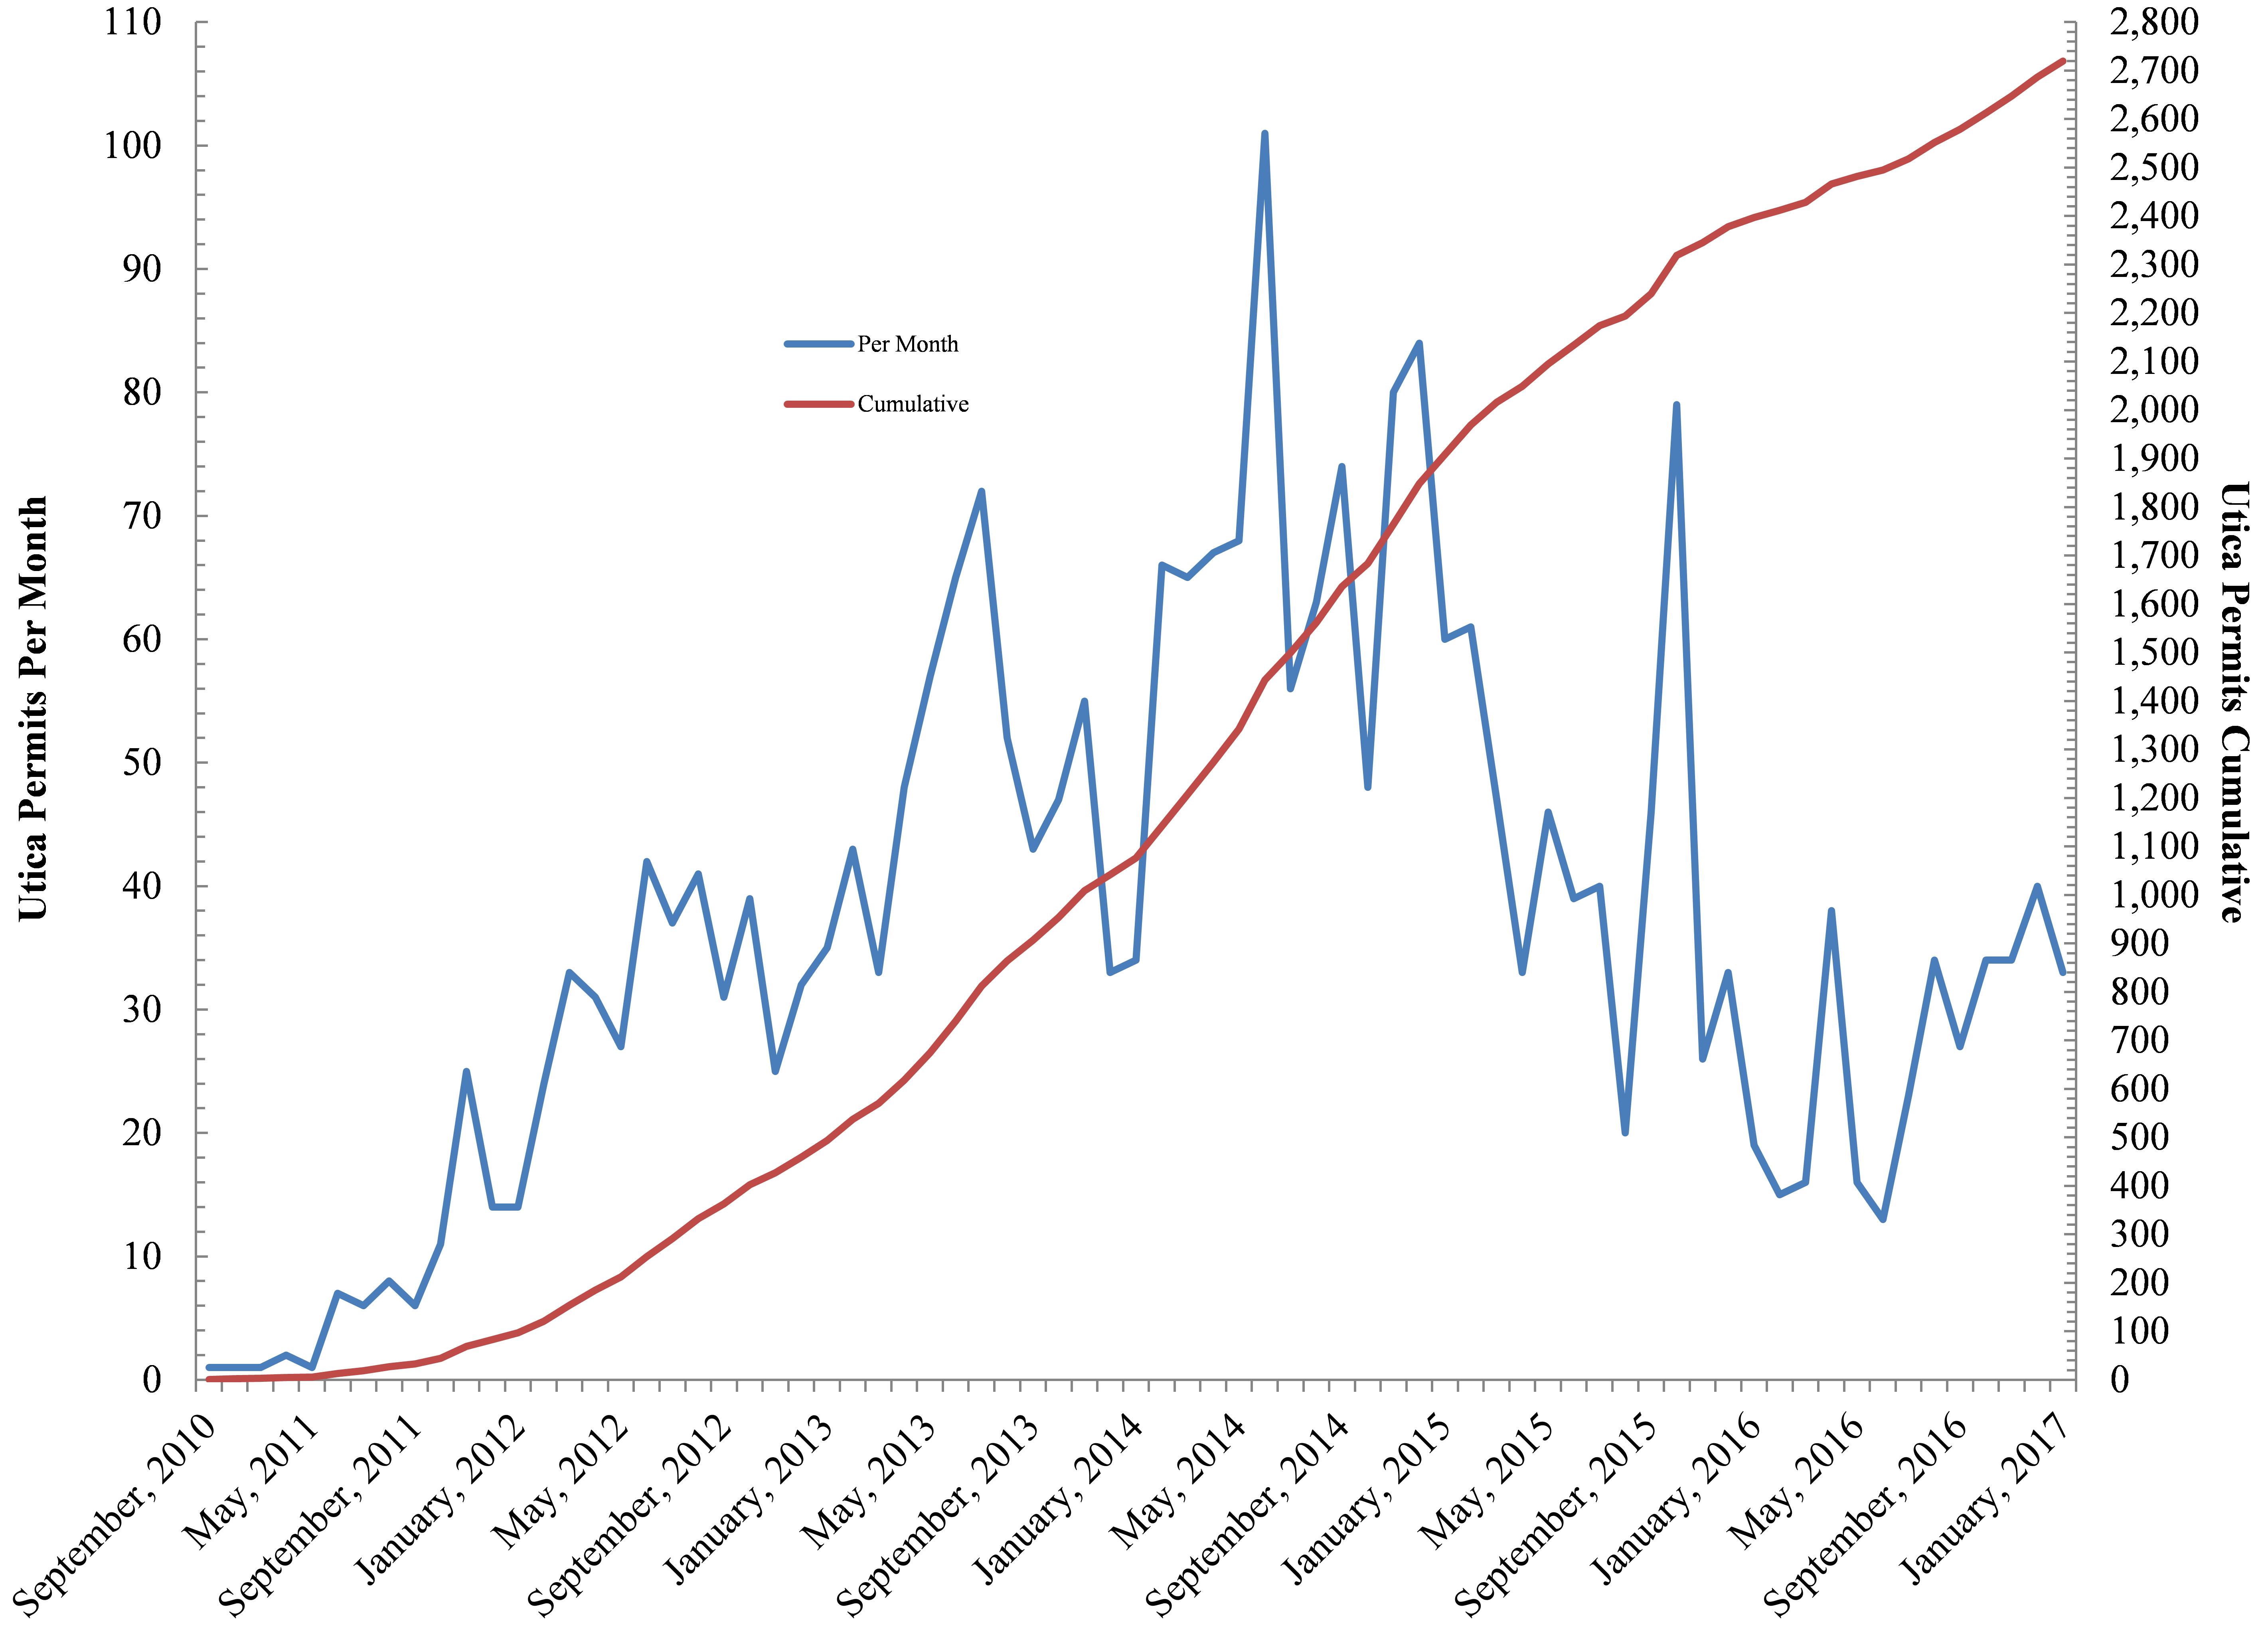
Given the growing influence of Mr. Murray and the coal industry writ large we thought it was time to do a deep dive into how Mr. Murray’s Appalachian Ohio home county of Belmont and surrounding counties have been altered by coal mining. We were also interested in how the coal industry has come to interact with the hydraulic fracturing industry, which has drilled 542 Utica wells in Belmont County alone since March 2012. These wells amount to 20% of all fracked wells in Ohio as of January 2018. The rate at which Utica wells are being permitted in Belmont County is actually increasing by about 1.5 to 2 permits per month or 5.5 to 7.8 times the statewide average (Figure 1).
Belmont County also happens to be the “all-time leader in coal production in Ohio” having produced 825 million tons since 1816 (ODNR, 2005). All of this means that the Ohio county that produces the most coal is also now The Buckeye State’s most actively drilled county.
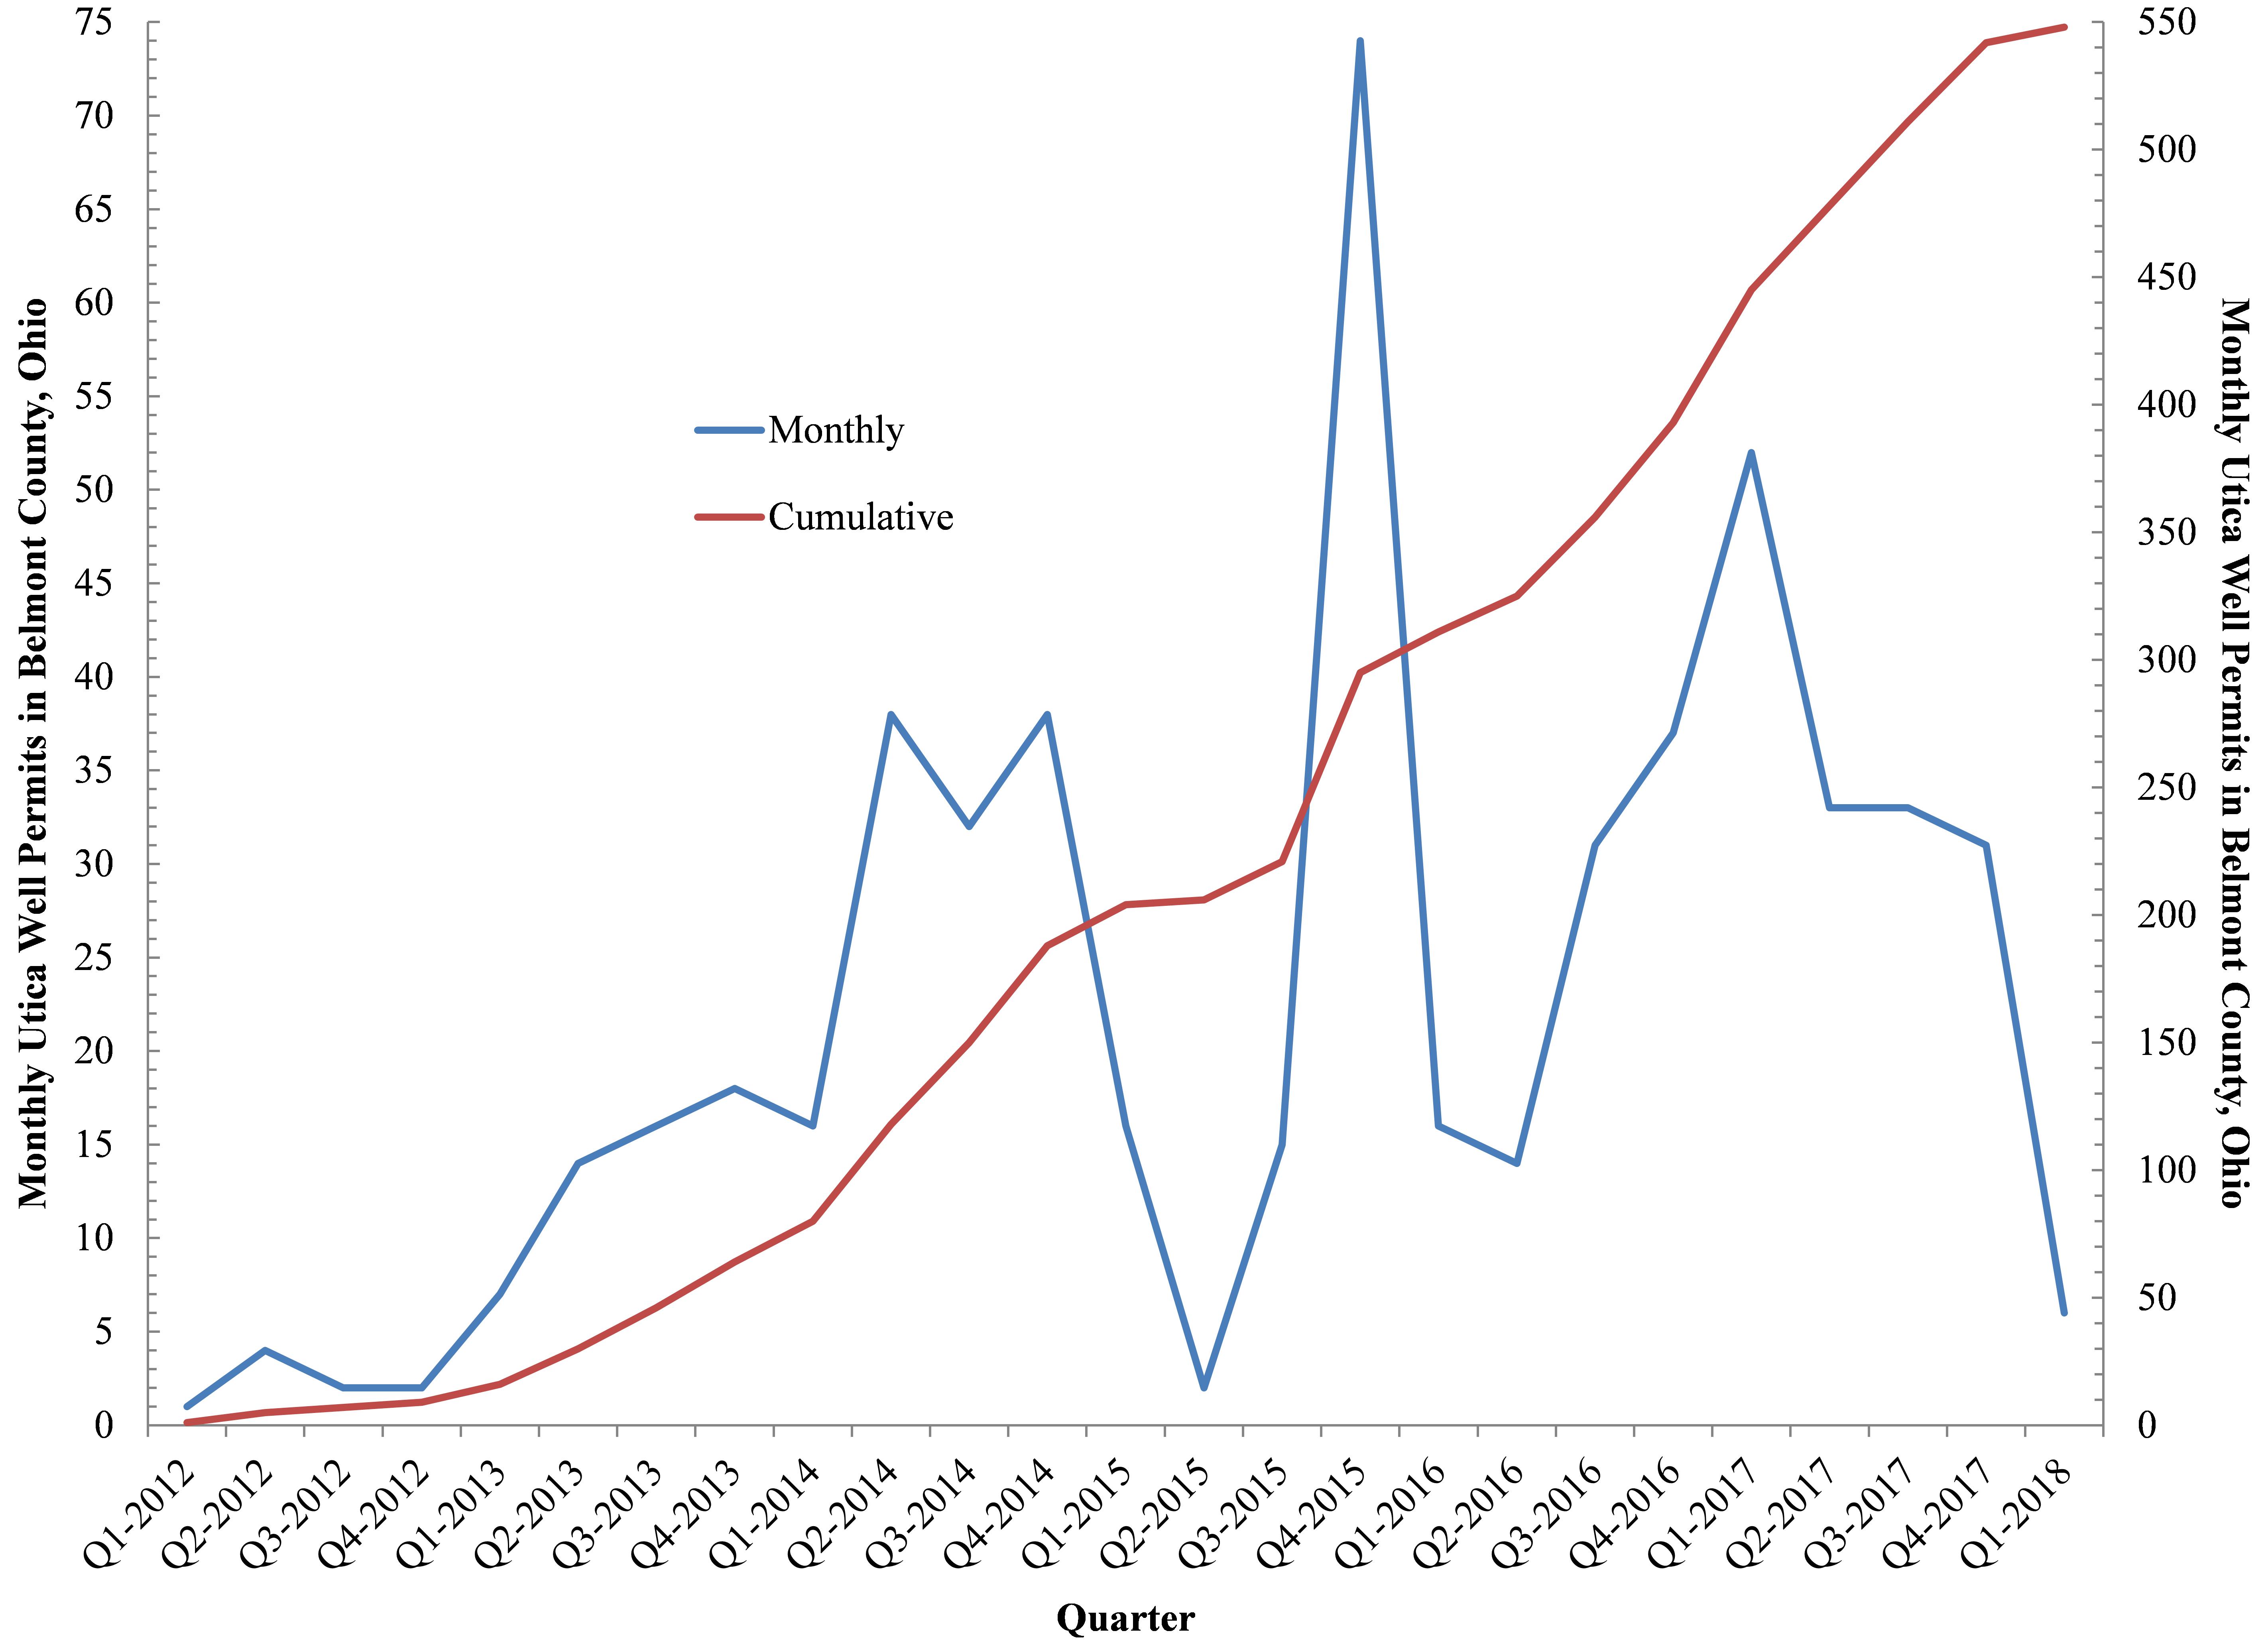
Figure 1. Monthly and cumulative hydraulically fractured wells in Belmont County, Ohio between Q1-2012 and Q1-2018
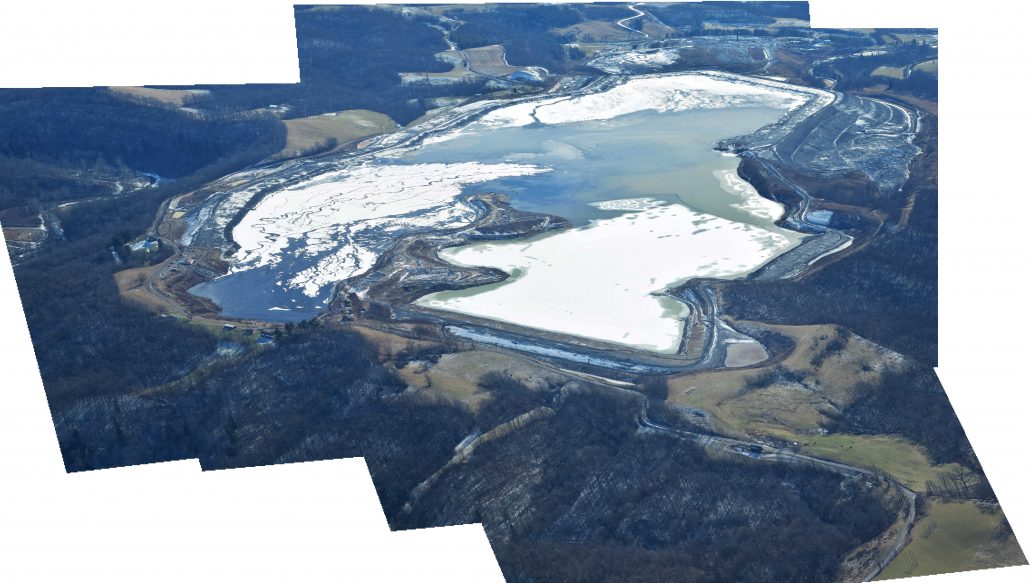
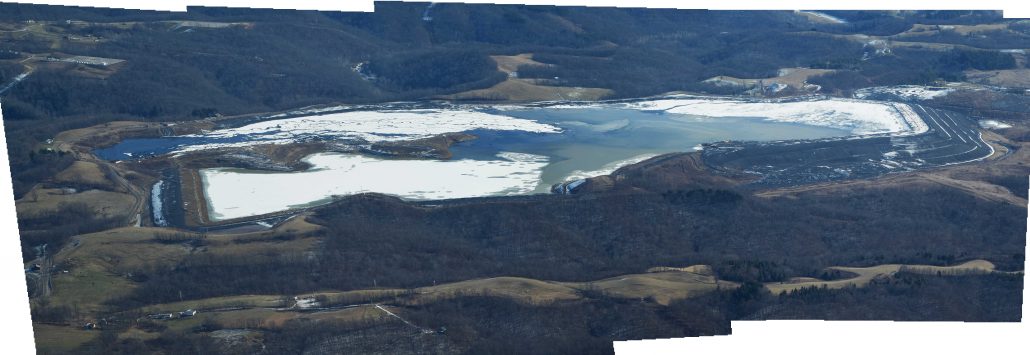
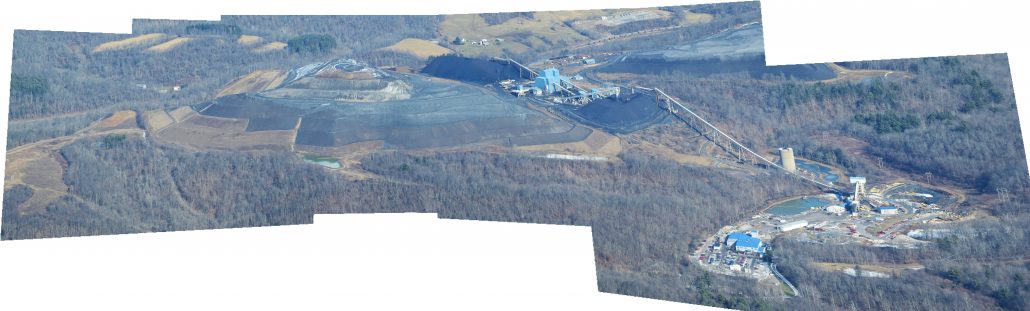
Photos of coal mining operations in Belmont County, OH. Flyovers courtesy of SouthWings:
An End to Coal
However, the days of coal’s dominance – and easily mineable coal – in Ohio appear to be coming to an end.
Per mine, Ohio’s mines produce about 30% of the national average and 43% of the state averages (Figure 2). Ohio’s mines only produce about 10% of what the mega Western mines produce on a per-mine basis, and much less than states like New Mexico and Texas, as well.
Even with automation, the barriers to a return of coal in Appalachia are formidable given that most of the easily recoverable coal has already been mined. Additionally, the landscape is more formidable and not as conducive to the large strip-mine and dragline operations of the Powder River Basin, which produce roughly 8.5 million tons of coal per mine, compared to an average of 330,000 tons per mine in Appalachia. (Figure 2).
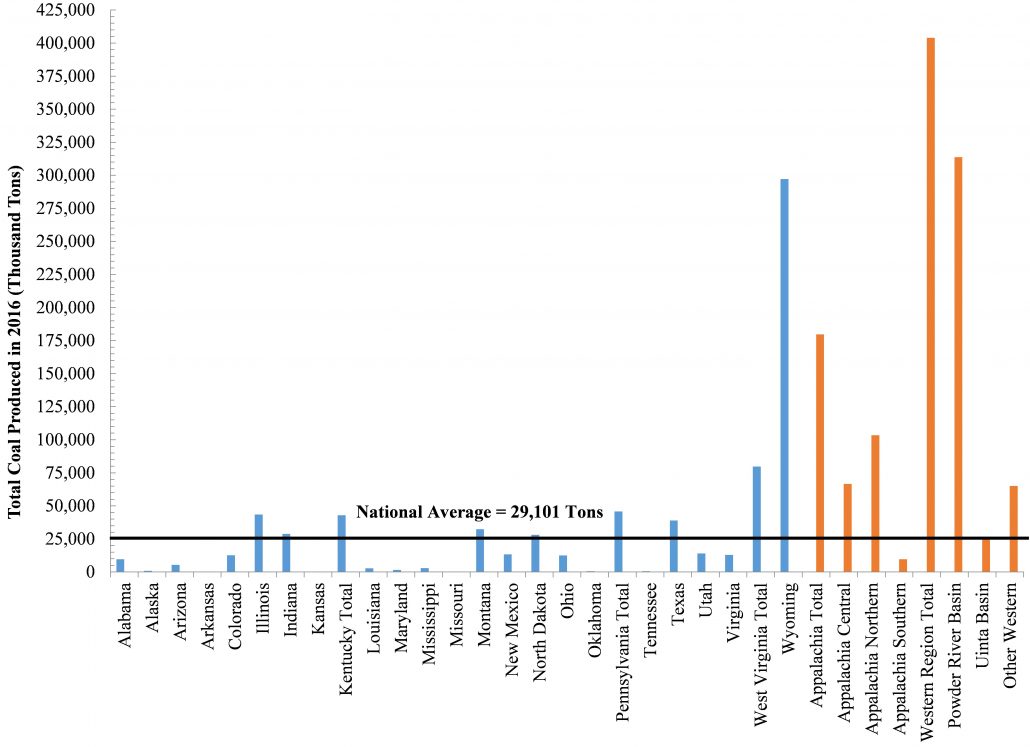
Figure 2. Total coal produced across the twenty-five coal producing states, the Appalachian region, Western Basins (2016, tons, Data Courtesy of Energy Information Administration (EIA) State Profile and Energy Estimates)
Mapping Coal and Fracking
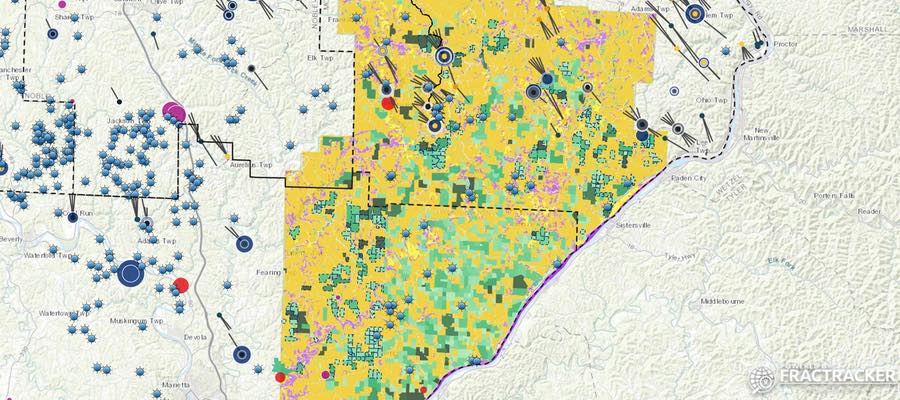
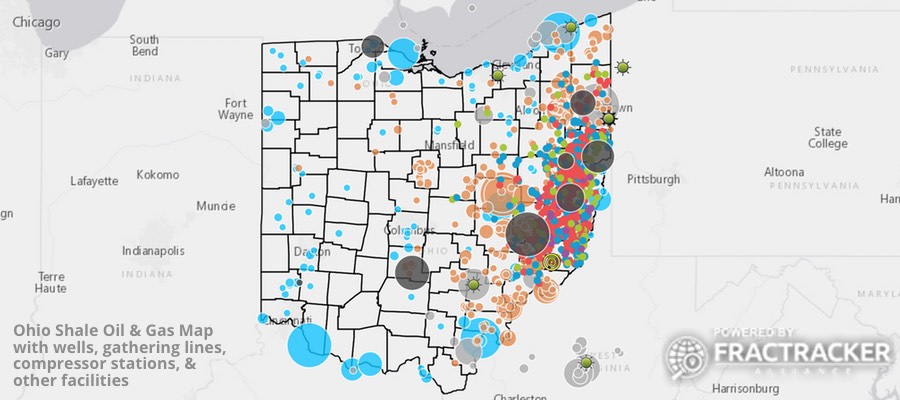
The below map depicts parcels owned by coal mining companies in the Ohio counties of Belmont, Noble, Guernsey, and Muskingum, as well as previously mined and/or potential parcels based on owner and proximity to existing mines.
We also incorporated production data (2001 to 2016) for 116 surface and strip coal mines in these and surrounding counties, natural gas pipelines, hydraulically fractured laterals, and Class II Salt Water Disposal (SWD) injection wells as of January 2018.
There are few areas in the United States where underground coal mining and fracking are taking place simultaneously and on top of each other. What could possibly go wrong when injecting massive amounts of fracking waste at high pressures into the geology below, while simultaneously pumping billions of gallons of water into hydraulically fractured laterals and mining coal at similar depths?
In the coming months and years we will be monitoring Belmont County, Ohio as an unfortunate case-study in determining the answer to such a unique question.
At the present time:
- Murray Energy, its subsidiaries, and other coal companies own approximately 15% of Belmont County.
- Coal companies and their associated real-estate firms and subsidiaries have mined or own approximately 5,615 square miles across the Noble, Belmont, Guernsey, and Muskingum counties.
- The 116 mines in this map have mined an average of 3.22 million tons of coal since 2001 and more than 373 million tons in total. Mr. Murray’s mines account for 50% of this amount, producing nearly 15 times more coal per mine than the other 112 mines.
Collectively, these mines have contributed 1.09 billion tons of CO2 and CH4+N2O in CO2 equivalents to atmospheric climate change, or 68 million tons per year (MTPY). This volume is equivalent to the annual emissions of nearly 60 million Americans or 19% of the population.
Murray’s mines alone have contributed enough greenhouse gases (CO2+CH4+N2O) to account for the emissions of 9.2% of the US population since 2001. Each Murray mine is belching out 8.41 million tons of greenhouse gases per year or roughly equivalent to the emissions of 463,489 Americans.
View map fullscreen | How FracTracker maps work
Relevant data for this map can be found at the end of this article.
Broader Implications
Robert Murray’s influence and mining impacts extend well beyond Appalachian Ohio.
Mr. Murray’s is the primary owner of 157 mines and associated facilities1 across eleven states – and five of the six major Lower 48 coal provinces – from Utah and North Dakota to Alabama, Georgia, and Florida (Figure 3). Mr. Murray likes to highlight his sage purchases of prime medium and high volatility bituminous coal real-estate over the years on his company’s website. However, nowhere in his corporate overview does he mention his most notorious mine: the abandoned and sealed underground Crandal Canyon Mine, Emery County, Utah. It was at this mine on August 6, 2007 that a collapse trapped six miners and resulted in their deaths, along with the deaths of three rescue workers. Mr. Murray told the BBC that he had had an emotional breakdown and hadn’t deserted anyone living in a little trailer adjacent to the mine’s entrance every day following the collapse. Furthermore, Mr. Murray blames such events on subsidiaries like Grenwal Resources Inc., which happens to be the owner of record for the Crandal Canyon Mine and is one of thirty-three unique subsidiaries owned by Mr. Murray (data download).
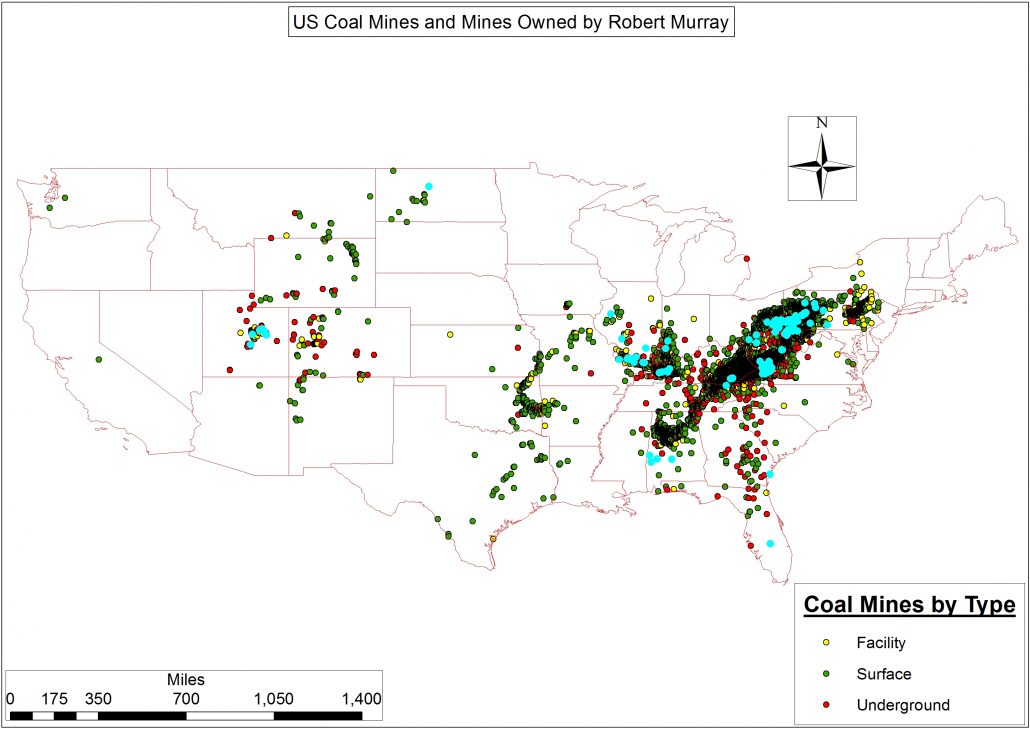
Figure 3. US Coal Mines by type and Mines Owned by Robert Murray highlighted in turquoise
Table 1. Robert Murray coal mine ownership by mine status
| Status | Number of Mines |
| Abandoned | 68 |
| Abandoned and Sealed | 62 |
| Active | 12 |
| Non-Producing | 10 |
| Temporarily Idled | 5 |
| Total | 157 |
The Politics of Energy
Robert Murray and his fellow fossil fuel energy brethren’s bet on Trump paid off, with Trump winning 99% of the vote in congressional districts where coal mines exist (Figure 4). Such a performance bested the previous GOP candidates of McCain and Romney even though they had achieved an impressive 96% of the vote. Interestingly, Trump did nearly as well in congressional districts dominated by wind farms and ethanol refineries where more than 87% of the electorate was white.
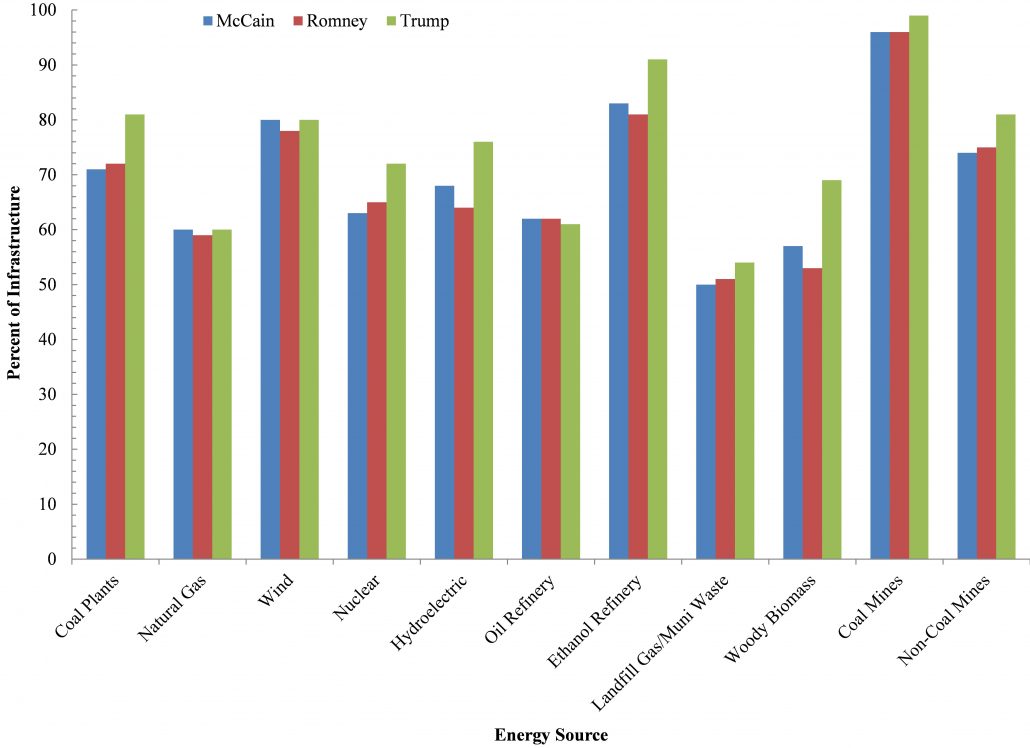
Figure 4. Presidential election results for GOP candidates in voting districts where various forms of energy are produced and/or processed, 2016, 2012, and 2008
Trump & Co. promised these districts that his administration would breathe life into the fossil fuel industry. True, Trump, Pruitt, Perry, and Interior Secretary Ryan Zinke are greasing the skids for the industry’s revival. In terms of annual production, however, it is far from certain that such moves will translate into the types of boost in employment promised by Trump during the 2016 campaign. Even if production does return, executives like Murray admit that the advent of efficiencies and extraction technologies means that the industry is mining more coal per miner than ever before:
“Trump has consistently pledged to restore mining jobs, but many of those jobs were lost to technology rather than regulation and to competition from natural gas and renewables, which makes it unlikely that he can do much to significantly grow the number of jobs in the industry,” said Murray. “I suggested that he temper his expectations. Those are my exact words,” said Murray. “He can’t bring them back.” – The Guardian, March 27, 2017
Conclusions and Next Steps
It remains to be seen how the coal mining and fracking industry’s battle for supremacy will play out from a socioeconomic, health, environmental, and regulatory perspective. While many people understand that coal jobs aren’t coming back, we shouldn’t doubt the will of the Trump administration and friends like Robert Murray to make sure that profits can still be extracted from Appalachia.
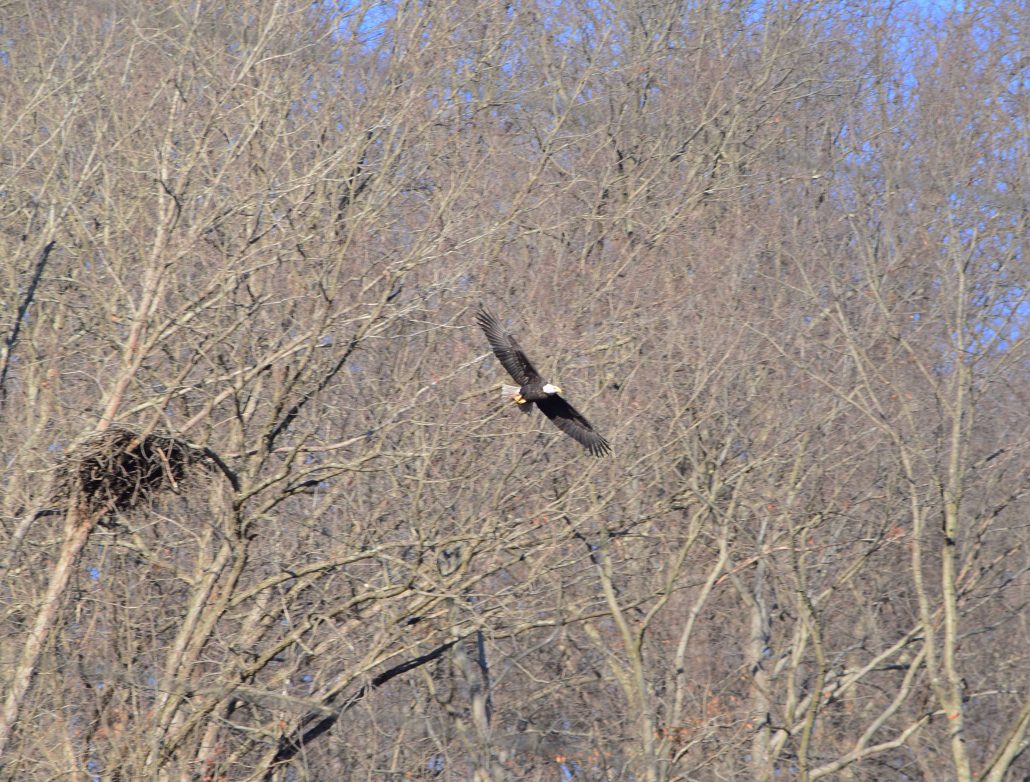
Will the fracking industry and coal barons agree to get along, or will they wage a war on multiple fronts to marginalize the other side? Will this be another natural resource conflagration? If so, how will the people – and species like the “near-threatened” Hellbender Salamander (Cryptobranchus alleganiensis) or the region’s recovering Bald Eagle (Haliaeetus leucocephalus) population that live in the disputed Appalachian communities respond? How will their already stressed day-to-day existence be affected? To this point, the fossil fuel industry has managed to blame everyone but itself for the tepid to non-existent job growth in their sectors.
The Appalachian landscape has been deeply scarred and fragmented by coal mining, and now it is experiencing a new colonizing force in the form of the hydraulic fracturing industry. When Appalachia realizes that automation, globalization, and natural gas, are the key drivers to the downfall of coal, will they bring fire, brimstone, and pitchforks to the doorstep of Murray Energy of the fracking companies? Or is Appalachia’s future merely that of an extraction colony?
Oh Say, did you see him; it was early this morning.
He passed by your houses on his way to the coal.
He was tall, he was slender, and his dark eyes so tender
His occupation was mining, West Virginia his home
It was just before noon, I was feeding the children,
Ben Moseley came running to give us the news.
Number eight was all flooded, many men were in danger
And we don’t know their number, but we fear they’re all doomed.
– “West Virginia Mine Disaster” © Jean Ritchie, Geordie Music Publishing
By Ted Auch, Great Lakes Program Coordinator, FracTracker Alliance
Endnote
- Murray is listed as the owner of 45 coal mining facilities, 35 surface mines, and 77 underground mines according to data compiled from the Department of Labor


")
")
")
")
")
")

")

")


")
")


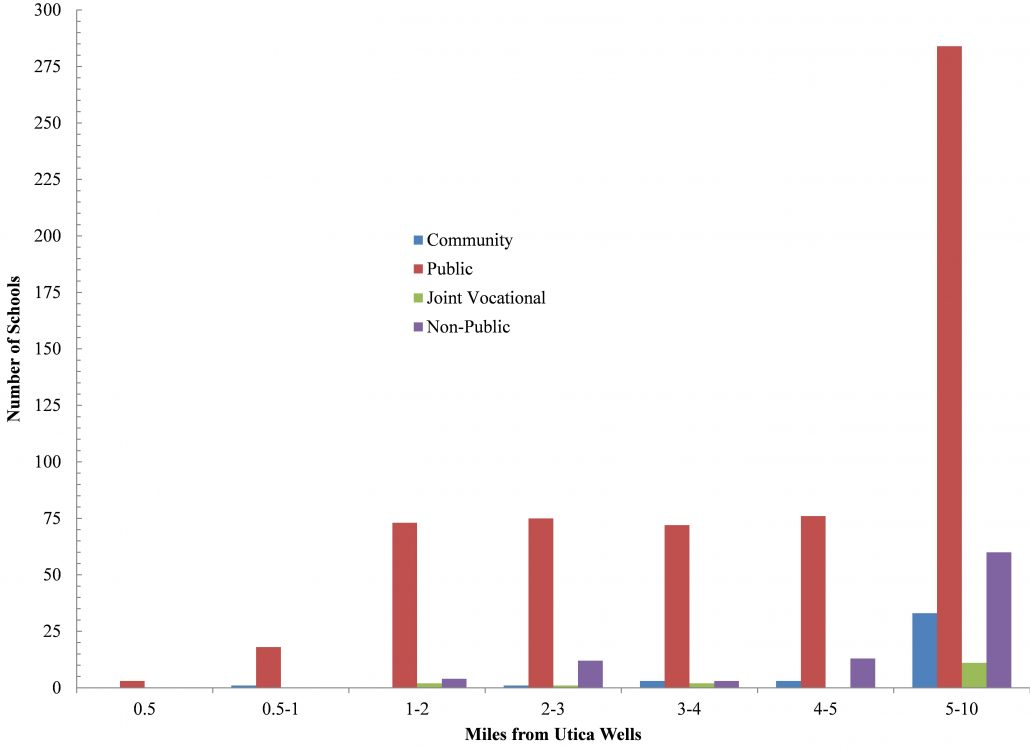

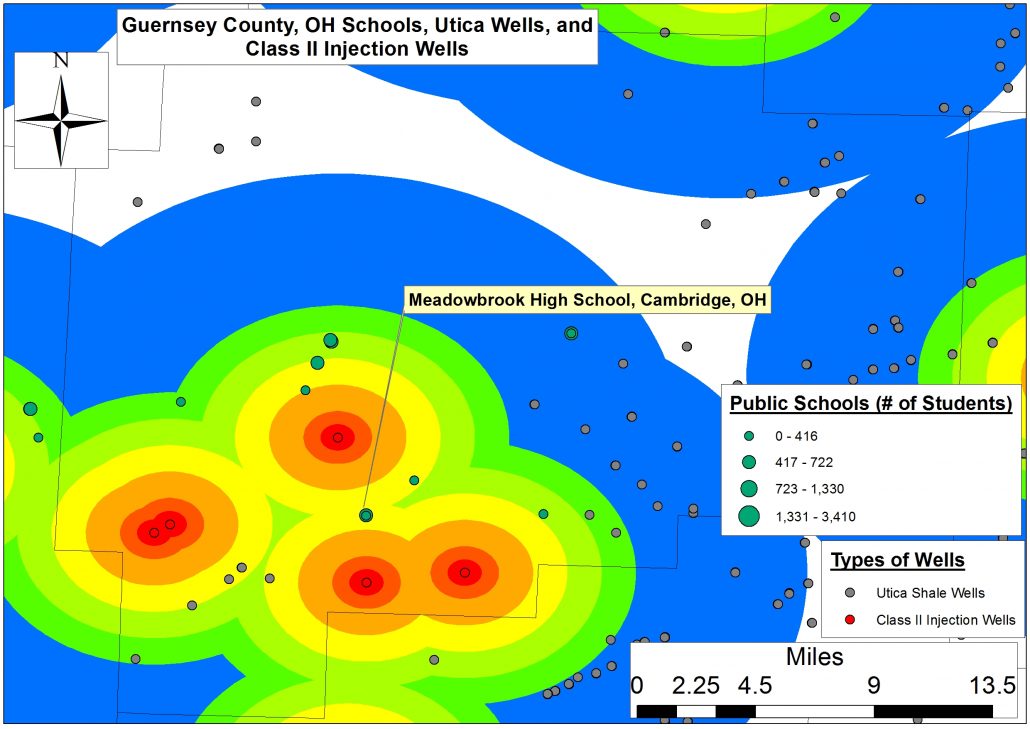


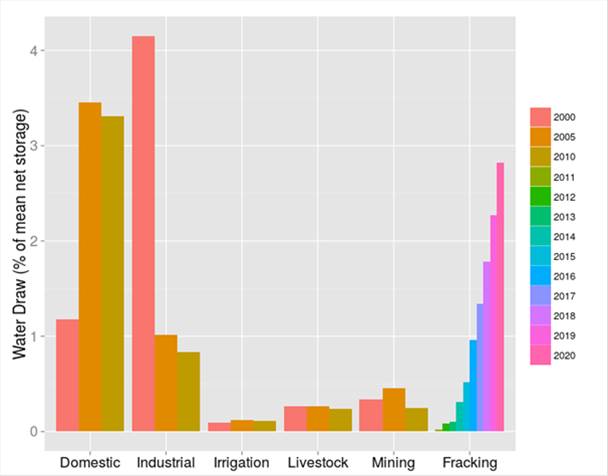
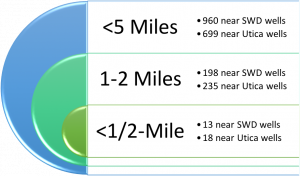 Just how close are public water supplies to Class II waste disposal wells and permitted Utica wells? As of January 15, 2017, there are 13 PWS’s within a half-mile of Ohio’s Class II SWD wells, and 18 within a half-mile of permitted Utica wells. These facilities serve approximately 2,000 Ohioans each, with an average of 112-153 people per PWS (Tables 1 and 5). Within one mile from these wells there are 64 to 66 PWSs serving 18 to 61 thousand Ohioans. That’s an average of 285-925 residents.


