Award to be presented to three environmental stewards addressing oil and gas impacts at reception held in Pittsburgh, PA, November 18th
WASHINGTON, DC – October 5, 2017 – Three community advocates were recently selected by a panel of judges to receive the 2017 Community Sentinel Award for Environmental Stewardship, presented this year by Americans Against Fracking, Earthworks, FracTracker Alliance, Halt the Harm Network, and Stop the Frack Attack – sponsored by the 11th Hour Project. Award recipients were chosen because of their steadfast determination to highlight and address the impacts of the oil and gas industry in communities across the United States. The 2017 Community Sentinel Award winners are:
Ranjana Bhandari – Arlington, Texas
Frank Finan – Hop Bottom, Pennsylvania
Ray Kemble – Montrose, Pennsylvania
This year’s recipients, nominated by their peers, have lead campaigns to prevent wastewater injection wells from being permitted near drinking water reservoirs; documented fugitive air emissions using their own personal FLIR cameras; and fought cancer and legal attacks from oil and gas companies simultaneously.
These awardees truly represent the heart of local heroes working tirelessly to safeguard their communities from fracking and its collateral impacts, while at the same time encouraging a national transition to safer, renewable forms of energy…
… remarked Brook Lenker, Executive Director of FracTracker Alliance, the organizer of the award partnership.
Recipients were selected by a committee of community defense leaders: Bill Hughes of Wetzel County Action Group, West Virginia; Pat Popple of Save the Hills Alliance, Wisconsin; Sierra Shamer of Shalefield Organizing Committee, Pennsylvania; Dante Swinton of Energy Justice, Maryland; and Niki Wong of Redeemer Community Partnership, California.
The three recipients will each be awarded $1,000 for their efforts and recognized at an evening reception at the Omni William Penn Hotel in Pittsburgh, Pennsylvania on Saturday, November 18, 2017 during the People vs. Oil and Gas Infrastructure Summit.
Learn more about the third annual Community Sentinel Award for Environmental Stewardship, or purchase tickets to the reception for $40 (includes award ceremony and reception, heavy hors d’oeuvres, and a drink).
# # #
About FracTracker Alliance
FracTracker Alliance is a national organization with regional offices in Pennsylvania, New York, Ohio, Washington DC, and California. The organization’s mission is to study, map, and communicate the risks of oil and gas development to protect our planet and support the renewable energy transformation. Learn more at fractracker.org.
https://www.fractracker.org/a5ej20sjfwe/wp-content/uploads/2016/06/SentinelAward-Feature.jpg400900FracTracker Alliancehttps://www.fractracker.org/a5ej20sjfwe/wp-content/uploads/2025/09/2025-Wordmark-Logo.pngFracTracker Alliance2017-10-05 12:30:152021-04-15 15:02:332017 Community Sentinel Award for Environmental Stewardship Recipients
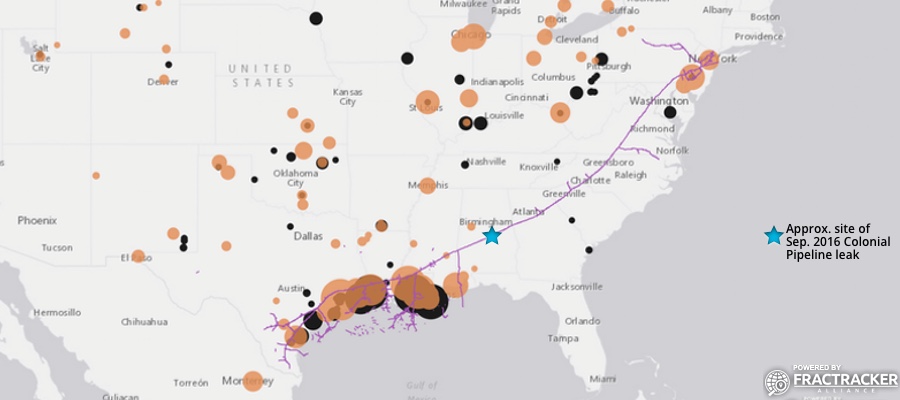
On September 9, 2016 a pipeline leak was detected from the Colonial Pipeline by a mine inspector in Shelby County, Alabama. It is estimated to have spilled ~336,000 gallons of gasoline, resulting in the shutdown of a major part of America’s gasoline distribution system. As such, we thought it timely to provide some data and a map on the Colonial Pipeline Project.
Figure 1. Dynamic map of Colonial Pipeline route and related infrastructure
The Colonial Pipeline was built in 1963, with some segments dating back to at least 1954. Colonial carries gasoline and other refined petroleum projects throughout the South and Eastern U.S. – originating at Houston, Texas and terminating at the Port of New York and New Jersey. This ~5,000-mile pipeline travels through 12 states and the Gulf of Mexico at one point. According to available data, prior to the September 2016 incident for which the cause is still not known, roughly 113,382 gallons had been released from the Colonial Pipeline in 125 separate incidents since 2010 (Table 1).
Table 1. Reported Colonial Pipeline incident impacts by state, between 3/24/10 and 7/25/16
State
Incidents (#)
Barrels* Released
Total Cost ($)
AL
10
91.49
2,718,683
GA
11
132.38
1,283,406
LA
23
86.05
1,002,379
MD
6
4.43
27,862
MS
6
27.36
299,738
NC
15
382.76
3,453,298
NJ
7
7.81
255,124
NY
2
27.71
88,426
PA
1
0.88
28,075
SC
9
1639.26
4,779,536
TN
2
90.2
1,326,300
TX
19
74.34
1,398,513
VA
14
134.89
15,153,471
Total**
125
2699.56
31,814,811
*1 Barrel = 42 U.S. Gallons
** The total amount of petroleum products spilled from the Colonial Pipeline in this time frame equates to roughly 113,382 gallons. This figure does not include the September 2016 spill of ~336,000 gallons.
Unfortunately, the Colonial Pipeline has also been the source of South Carolina’s largest pipeline spill. The incident occurred in 1996 near Fork Shoals, South Carolina and spilled nearly 1 million gallons of fuel into the Reedy River. The September 2016 spill has not reached any major waterways or protected ecological areas, to-date.
Additional Details
Owners of the pipeline include Koch Industries, South Korea’s National Pension Service and Kohlberg Kravis Roberts, Caisse de dépôt et placement du Québec, Royal Dutch Shell, and Industry Funds Management.
For more details about the Colonial Pipeline, see Table 2.
Table 2. Specifications of the Colonial and/or Intercontinental pipeline
https://www.fractracker.org/a5ej20sjfwe/wp-content/uploads/2016/09/ColonialPipeline-Feature.jpg400900FracTracker Alliancehttps://www.fractracker.org/a5ej20sjfwe/wp-content/uploads/2025/09/2025-Wordmark-Logo.pngFracTracker Alliance2016-09-26 13:35:032021-04-15 15:04:25A Proper Picture of the Colonial Pipeline’s Past
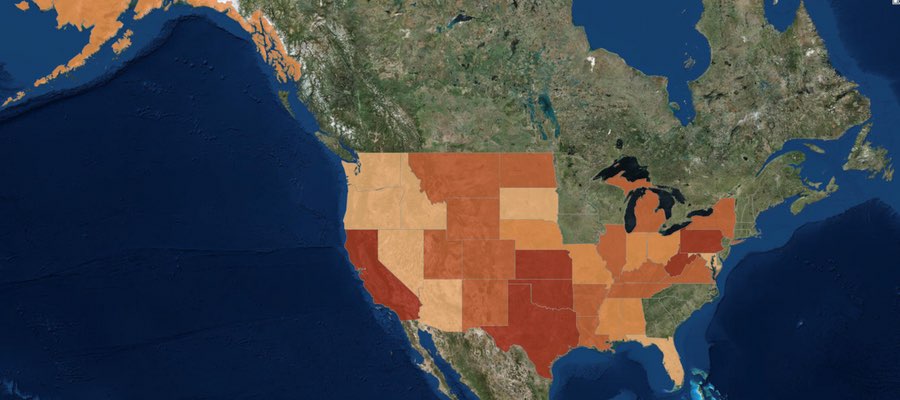
In February 2014, the FracTracker Alliance produced our first version of a national well data file and map, showing over 1.1 million active oil and gas wells in the United States. We have now updated that data, with the total of wells up to 1,666,715 active wells accounted for.
Density by state of active oil and gas wells in the United States. Click here to access the legend, details, and full map controls. Zoom in to see summaries by county, and zoom in further to see individual well data. Texas contains state and county totals only, and North Carolina is not included in this map.
While 1.7 million wells is a substantial increase over last year’s total of 1.1 million, it is mostly attributable to differences in how we counted wells this time around, and should not be interpreted as a huge increase in activity over the past 15 months or so. Last year, we attempted to capture those wells that seemed to be producing oil and gas, or about ready to produce. This year, we took a more inclusive definition. Primarily, the additional half-million wells can be accounted for by including wells listed as dry holes, and the inclusion of more types of injection wells. Basically anything with an API number that was not described as permanently plugged was included this time around.
Data for North Carolina are not included, because they did not respond to three email inquiries about their oil and gas data. However, in last year’s national map aggregation, we were told that there were only two active wells in the state. Similarly, we do not have individual well data for Texas, and we use a published list of well counts by county in its place. Last year, we assumed that because there was a charge for the dataset, we would be unable to republish well data. In discussions with the Railroad Commission, we have learned that the data can in fact be republished. However, technical difficulties with their datasets persist, and data that we have purchased lacked location values, despite metadata suggesting that it would be included. So in short, we still don’t have Texas well data, even though it is technically available.
Wells by Type and Status
Each state is responsible for what their oil and gas data looks like, so a simple analysis of something as ostensibly straightforward as what type of well has been drilled can be surprisingly complicated when looking across state lines. Additionally, some states combine the well type and well status into a single data field, making comparisons even more opaque.
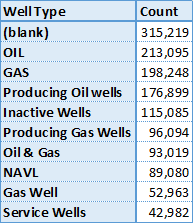
Top 10 of 371 published well types for wells in the United States.
Among all of the oil producing states, there are 371 different published well types. This data is “raw,” meaning that no effort has been made to combine similar entries, so “gas, oil” is counted separately from “GAS OIL,” and “Bad Data” has not been combined with “N/A,” either. Conforming data from different sources is an exercise that gets out of hand rather quickly, and utility over using the original published data is questionable, as well. We share this information, primarily to demonstrate the messy state of the data. Many states combine their well type and well status data into a single column, while others keep them separate. Unfortunately, the most frequent well type was blank, either because states did not publish well types, or they did not publish them for all of their wells.
There are no national standards for publishing oil and gas data – a serious barrier to data transparency and the most important takeaway from this exercise…
Wells by Location
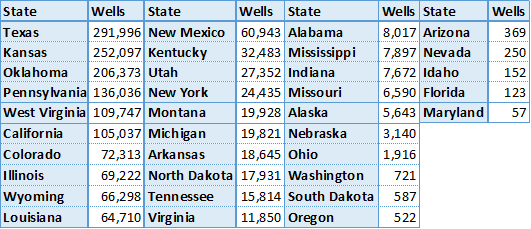
Active oil and gas wells in 2015 by state. Except for Texas, all data were aggregated published well coordinates.
There are oil and gas wells in 35 of the 50 states (70%) in the United States, and 1,673 out of 3,144 (53%) of all county and county equivalent areas. The number of wells per state ranges from 57 in Maryland to 291,996 in Texas. There are 135 counties with a single well, while the highest count is in Kern County, California, host to 77,497 active wells.
With the exception of Texas, where the data are based on published lists of well county by county, the state and county well counts were determined by the location of the well coordinates. Because of this, any errors in the original well’s location data could lead to mistakes in the state and county summary files. Any wells that are offshore are not included, either. Altogether, there are about 6,000 wells (0.4%) are missing from the state and county files.
Wells by Operator
There are a staggering number of oil and gas operators in the United States. In a recent project with the National Resources Defense Council, we looked at violations across the few states that publish such data, and only for the 68 operators that were identified previously as having the largest lease acreage nationwide. Even for this task, we had to follow a spreadsheet of which companies were subsidiaries of others, and sometimes the inclusion of an entity like “Williams” on the list came down to a judgement call as to whether we had the correct company or not.
No such effort was undertaken for this analysis. So in Pennsylvania, wells drilled by the operator Exco Resources PA, Inc. are not included with those drilled by Exco Resources PA, Llc., even though they are presumably the same entity. It just isn’t feasible to systematically go through thousands of operators to determine which operators are owned by whom, so we left the data as is. Results, therefore, should be taken with a brine truck’s worth of salt.
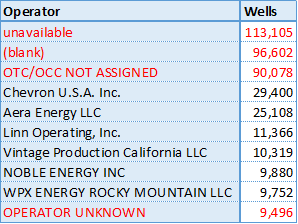
Top 10 wells by operator in the US, excluding Texas. Unknown operators are highlighted in red.
Texas does publish wells by operator, but as with so much of their data, it’s just not worth the effort that it takes to process it. First, they process it into thirteen different files, then publish it in PDF format, requiring special software to convert the data to spreadsheet format. Suffice to say, there are thousands of operators of active oil and gas wells in the Lone Star State.
Not counting Texas, there are 39,693 different operators listed in the United States. However, many of those listed are some version of “we don’t know whose well this is.” Sorting the operators by the number of wells that they are listed as having, we see four of the top ten operators are in fact unknown, including the top three positions.
Summary
The state of oil and gas data in the United States is clearly in shambles. As long as there are no national standards for data transparency, we can expect this trend to continue. The data that we looked for in this file is what we consider to be bare bones: well name, well type, well status, slant (directional, vertical, or horizontal), operator, and location. In none of these categories can we say that we have a satisfactory sense of what is going on nationally.
Click on the above button to download the three sets of data we used to make the dynamic map (once you are zoomed in to a state level). The full dataset was broken into three parts due to the large file sizes.
https://www.fractracker.org/a5ej20sjfwe/wp-content/uploads/2015/08/2015Update-Feature.jpg400900Matt Kelso, BAhttps://www.fractracker.org/a5ej20sjfwe/wp-content/uploads/2025/09/2025-Wordmark-Logo.pngMatt Kelso, BA2015-08-03 14:19:532020-07-21 10:30:051.7 Million Wells in the U.S. – A 2015 Update