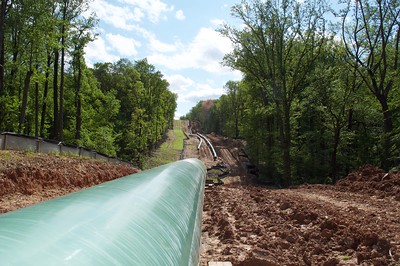
In this article, we’ll feature four contentious pipeline build-outs in the Eastern United States, show ways in which those pipelines impact natural and human communities, and provide examples of how environmental advocates have challenged these projects, with varying degrees of success.
https://www.fractracker.org/a5ej20sjfwe/wp-content/uploads/2021/03/TAuch_Transportation-RoverPipeline_Construction-EnergyTransferPartners-Woodsfield_OH_May2017.jpg5761500Karen Edelsteinhttps://www.fractracker.org/a5ej20sjfwe/wp-content/uploads/2025/09/2025-Wordmark-Logo.pngKaren Edelstein2022-11-30 17:50:122024-01-22 16:03:23A Contentious Landscape of Pipeline Build-outs in the Eastern US
Local communities are skeptical of the Chickahominy Pipeline company, which plans to build a supply line through five Virginia counties. With no track record and very little experience in pipeline construction, the company’s capacity to take on this project is questionable.
FracTracker Alliance has released a new national map, filled with energy and petrochemical data. Explore the map, continue reading to learn more, and see how your state measures up!
This map has been updated since this blog post was originally published, and therefore statistics and figures below may no longer correspond with the map
The items on the map (followed by facility count in parenthesis) include:
For oil and gas wells, view FracTracker’s state maps.
Transportation & Storage
Natural gas compressor stations (1,367) – Facilities built along a pipeline route that pressurize natural gas to keep it flowing through the pipeline.
Crude oil rail terminals (94) – Rail terminals that load and unload crude oil (liquid hydrocarbons that have yet to be processed into higher-value petroleum products).
Liquefied natural gas import/export terminals (8) – Facilities that can a) liquefy natural gas so it can be exported as LNG (liquefied natural gas) and/or b) re-gasify LNG so it can be used as natural gas. Natural gas is transported in a liquid state because it takes up less space as a liquid than as a gas.
Natural Gas Underground Storage (486) – Locations where natural gas is stored underground in aquifers, depleted gas fields, and salt formations.
Petroleum Product Terminals (1,484) – Terminals with a storage capacity of 50,000 barrels or more and/or the ability to receive volumes from tanker, barge, or pipeline. Petroleum products include products “produced from the processing of crude oil and other liquids at petroleum refineries, from extraction of liquid hydrocarbons at natural gas processing plants, and from production of finished petroleum products at blending facilities.”
Petroleum Ports (242) – A port that can import and/or export 200,000 or more short tons of petroleum products a year.
Natural gas import/export pipeline facility (54) – A facility where natural gas crosses the border of the continental United States.
Pipelines
Crude oil pipelines – major crude oil pipelines, including interstate truck lines and selected intrastate lines, but not including gathering lines.
Natural gas liquid pipelines – Also referred to as hydrocarbon gas liquid pipelines, they carry the heavier components of the natural gas stream which are liquid under intense pressure and extreme cold, but gas in normal conditions.
Natural gas pipelines– Interstate and intrastate natural gas pipelines. Due to the immensity of this pipeline network and lack of available data, this pipeline layer in particular varies in degree of accuracy.
Petroleum Product Pipelines – Major petroleum product pipelines.
Recent Pipeline Projects – Pipeline projects that have been announced since 2017. This includes projects in various stages, including under construction, complete, planned or canceled. Click on the pipeline for the status.
Processing & Downstream
Natural Gas Processing Plants (478) – Plants that separate impurities and components of the natural gas stream.
Chemical plants (36) – Includes two types of chemical plants – petrochemical production and ammonia manufacturing – that report to EPA’s Greenhouse Gas Reporting Program.
Ethylene Crackers (30) – Also referred to as ethane crackers, these petrochemical complexes that converts ethane (a natural gas liquid) into ethylene. Ethylene is used to make products like polyethylene plastic.
Petroleum Refineries (135) – A plant that processes crude oil into products like petroleum naphtha, diesel fuel, and gasoline.
Power Plants (9,414) – Electric generating plants with a capacity of at least one megawatt, sorted by energy source.
Wind Turbines (63,003) – Zoom in on wind power plants to see this legend item appear.
Natural Resources
Shale Plays (45) – Tight oil and gas shale plays, which are formations where oil and gas can be extracted.
Major Rivers
Solar Energy Potential – Potential solar energy generation, in kilowatt-hours per square meter per day – averaged annually.
This map is by no means exhaustive, but is exhausting. It takes a lot of infrastructure to meet the energy demands from industries, transportation, residents, and businesses – and the vast majority of these facilities are powered by fossil fuels. What can we learn about the state of our national energy ecosystem from visualizing this infrastructure? And with increasing urgency to decarbonize within the next one to three decades, how close are we to completely reengineering the way we make energy?
Key Takeaways
Natural gas accounts for 44% of electricity generation in the United States – more than any other source. Despite that, the cost per megawatt hour of electricity for renewable energy power plants is now cheaper than that of natural gas power plants.
The state generating the largest amount of solar energy is California, while wind energy is Texas. The state with the greatest relative solar energy is not technically a state – it’s D.C., where 18% of electricity generation is from solar, closely followed by Nevada at 17%. Iowa leads the country in relative wind energy production, at 45%.
The state generating the most amount of energy from both natural gas and coal is Texas. Relatively, West Virginia has the greatest reliance on coal for electricity (85%), and Rhode Island has the greatest percentage of natural gas (92%).
With 28% of total U.S. energy consumption for transportation, many of the refineries, crude oil and petroleum product pipelines, and terminals on this map are dedicated towards gasoline, diesel, and other fuel production.
Petrochemical production, which is expected to account for over a third of global oil demand growth by 2030, takes the form of chemical plants, ethylene crackers, and natural gas liquid pipelines on this map, largely concentrated in the Gulf Coast.
Electricity generation
The “power plant” legend item on this map contains facilities with an electric generating capacity of at least one megawatt, and includes independent power producers, electric utilities, commercial plants, and industrial plants. What does this data reveal?
In terms of the raw number of power plants – solar plants tops the list, with 2,916 facilities, followed by natural gas at 1,747.
In terms of megawatts of electricity generated, the picture is much different – with natural gas supplying the highest percentage of electricity (44%), much more than the second place source, which is coal at 21%, and far more than solar, which generates only 3% (Figure 1).
Figure 1. Electricity generation by source in the United States, 2019. Data from EIA.
This difference speaks to the decentralized nature of the solar industry, with more facilities producing less energy. At a glance, this may seem less efficient and more costly than the natural gas alternative, which has fewer plants producing more energy. But in reality, each of these natural gas plants depend on thousands of fracked wells – and they’re anything but efficient.
The cost per megawatt hour of electricity for a renewable energy power plants is now cheaper than that of fracked gas power plants. A report by the Rocky Mountain Institute, found “even as clean energy costs continue to fall, utilities and other investors have announced plans for over $70 billion in new gas-fired power plant construction through 2025. RMI research finds that 90% of this proposed capacity is more costly than equivalent [clean energy portfolios, which consist of wind, solar, and energy storage technologies] and, if those plants are built anyway, they would be uneconomic to continue operating in 2035.”
The economics side with renewables – but with solar, wind, geothermal comprising only 12% of the energy pie, and hydropower at 7%, do renewables have the capacity to meet the nation’s energy needs? Yes! Even the Energy Information Administration, a notorious skeptic of renewable energy’s potential, forecasted renewables would beat out natural gas in terms of electricity generation by 2050 in their 2020 Annual Energy Outlook.
This prediction doesn’t take into account any future legislation limiting fossil fuel infrastructure. A ban on fracking or policies under a Green New Deal could push renewables into the lead much sooner than 2050.
In a void of national leadership on the transition to cleaner energy, a few states have bolstered their renewable portfolio.
Figure 2. Electricity generation state-wide by source, 2019. Data from EIA.
One final factor to consider – the pie pieces on these state charts aren’t weighted equally, with some states’ capacity to generate electricity far greater than others. The top five electricity producers are Texas, California, Florida, Pennsylvania, and Illinois.
Transportation
In 2018, approximately 28% of total U.S. energy consumption was for transportation. To understand the scale of infrastructure that serves this sector, it’s helpful to click on the petroleum refineries, crude oil rail terminals, and crude oil pipelines on the map.
Transportation Fuel Infrastructure. Data from EIA.
The majority of gasoline we use in our cars in the US is produced domestically. Crude oil from wells goes to refineries to be processed into products like diesel fuel and gasoline. Gasoline is taken by pipelines, tanker, rail, or barge to storage terminals (add the “petroleum product terminal” and “petroleum product pipelines” legend items), and then by truck to be further processed and delivered to gas stations.
China leads the world in this movement. In 2018, just over half of the world’s electric vehicles sales occurred in China. Analysts predict that the country’s oil demand will peak in the next five years thanks to battery-powered vehicles and high-speed rail.
In the United States, the percentage of electric vehicles on the road is small but growing quickly. Tax credits and incentives will be important for encouraging this transition. Almost half of the country’s electric vehicle sales are in California, where incentives are added to the federal tax credit. California also has a “Zero Emission Vehicle” program, requiring electric vehicles to comprise a certain percentage of sales.
We can’t ignore where electric vehicles are sourcing their power – and for that we must go back up to the electricity generation section. If you’re charging your car in a state powered mainly by fossil fuels (as many are), then the electricity is still tied to fossil fuels.
Petrochemicals
Many of the oil and gas infrastructure on the map doesn’t go towards energy at all, but rather aids in manufacturing petrochemicals – the basis of products like plastic, fertilizer, solvents, detergents, and resins.
Natural gas processing plants separate components of the natural gas stream to extract natural gas liquids like ethane and propane – which are transported through the natural gas liquid pipelines. These natural gas liquids are key building blocks of the petrochemical industry.
Ethane crackers process natural gas liquids into polyethylene – the most common type of plastic.
The chemical plants on this map include petrochemical production plants and ammonia manufacturing. Ammonia, which is used in fertilizer production, is one of the top synthetic chemicals produced in the world, and most of it comes from steam reforming natural gas.
As we discuss ways to decarbonize the country, petrochemicals must be a major focus of our efforts. That’s because petrochemicals are expected to account for over a third of global oil demand growth by 2030 and nearly half of demand growth by 2050 – thanks largely to an increase in plastic production. The International Energy Agency calls petrochemicals a “blind spot” in the global energy debate.
Petrochemical development off the coast of Texas, November 2019. Photo by Ted Auch, aerial support provided by LightHawk.
Investing in plastic manufacturing is the fossil fuel industry’s strategy to remain relevant in a renewable energy world. As such, we can’t break up with fossil fuels without also giving up our reliance on plastic. Legislation like the Break Free From Plastic Pollution Act get to the heart of this issue, by pausing construction of new ethane crackers, ensuring the power of local governments to enact plastic bans, and phasing out certain single-use products.
“The greatest industrial challenge the world has ever faced”
Mapped out, this web of fossil fuel infrastructure seems like a permanent grid locking us into a carbon-intensive future. But even more overwhelming than the ubiquity of fossil fuels in the US is how quickly this infrastructure has all been built. Everything on this map was constructed since Industrial Revolution, and the vast majority in the last century (Figure 3) – an inch on the mile-long timeline of human civilization.
Figure 3. Global Fossil Fuel Consumption. Data from Vaclav Smil (2017)
In fact, over half of the carbon from burning fossil fuels has been released in the last 30 years. As David Wallace Wells writes in The Uninhabitable Earth, “we have done as much damage to the fate of the planet and its ability to sustain human life and civilization since Al Gore published his first book on climate than in all the centuries—all the millennia—that came before.”
What will this map look like in the next 30 years?
A recent report on the global economics of the oil industry states, “To phase out petroleum products (and fossil fuels in general), the entire global industrial ecosystem will need to be reengineered, retooled and fundamentally rebuilt…This will be perhaps the greatest industrial challenge the world has ever faced historically.”
Is it possible to build a decentralized energy grid, generated by a diverse array of renewable, local, natural resources and backed up by battery power? Could all communities have the opportunity to control their energy through member-owned cooperatives instead of profit-thirsty corporations? Could microgrids improve the resiliency of our system in the face of increasingly intense natural disasters and ensure power in remote regions? Could hydrogen provide power for energy-intensive industries like steel and iron production? Could high speed rail, electric vehicles, a robust public transportation network and bike-able cities negate the need for gasoline and diesel? Could traditional methods of farming reduce our dependency on oil and gas-based fertilizers? Could zero waste cities stop our reliance on single-use plastic?
Of course! Technology evolves at lightning speed. Thirty years ago we didn’t know what fracking was and we didn’t have smart phones. The greater challenge lies in breaking the fossil fuel industry’s hold on our political system and convincing our leaders that human health and the environment shouldn’t be externalized costs of economic growth.
https://www.fractracker.org/a5ej20sjfwe/wp-content/uploads/2020/02/National-map-feature-3.png400900Erica Jacksonhttps://www.fractracker.org/a5ej20sjfwe/wp-content/uploads/2025/09/2025-Wordmark-Logo.pngErica Jackson2020-02-28 17:35:142022-05-02 15:21:42National Energy and Petrochemical Map
By Guest Author: Austin Sachs, Director and founder of Protect and Divest
In most major social movements where there is an imbalance power, divestment has been a necessary part for progress, whether in South Africa or now in the environmental movement against fossil fuels. Yet, too often in the environmental movement, divestment is only pursued when all other options have run their course and failed. If we want a climate neutral society for generations to come, we must pursue divestment alongside all other actions – and alongside this divestment, a reinvestment into a society we want to see.
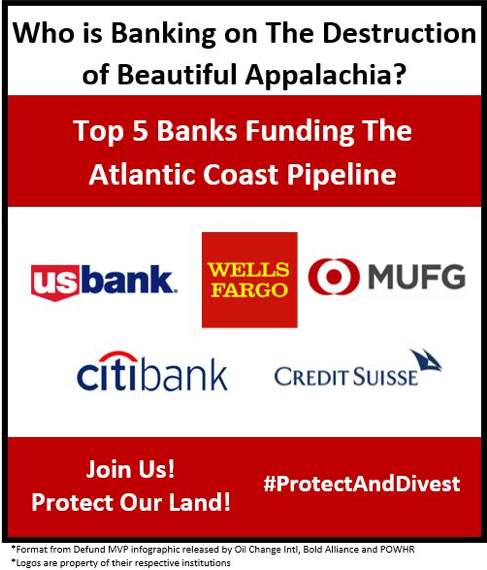
So where does this all start? Divestment begins with each of us looking into our financial accounts and seeing who we are funding with them. And that is exactly what Protect and Divest did last year. We researched the funding of the Atlantic Coast, Mountain Valley, Sabal Trail and Atlantic Sunrise pipelines to know where our money was going.
Along the entire East Coast, the TransCo Pipeline connects all these pipelines, but this infrastructure is also all connected by the same banks who are funding each and every single pipeline project. These banks range from the US banks of Wells Fargo, JP Morgan Chase, US Bank, CitiBank, and Bank of America to the International banks of the Royal Bank of Canada (RBC), Scotiabank and the Bank of Tokyo Mitsubishi UFJ. What we truly found is that no one bank is guilty alone – The entire financial industry is banking on the destruction of our beautiful home!
So where do we go if the banking industry is against a sustainable future? Well, luckily the entire industry is not against sustainability, and some heavily promote it. One of these options is Amalgamated Bank, who has promised to never invest depositor’s money into fossil fuels. Across this nation are countless credit unions doing the same for their members, who see money as a necessary tool of sustainability.
Protect and Divest has now launched our Divest the Commonwealth campaign to take our pledge one step further and move Virginia’s government funds out of fossil fuels, as well. Over $330 million dollars of the Virginia Retirement System is invested in fossil fuels. And of the stock of Duke Energy, one of the main builders of the Atlantic Coast Pipeline, 10 state pensions plans hold over $785 million in it. If the banks are guilty, so are our government pensions and funds. And it’s not like there are no sustainable options. Blackrock, the FTSE Group, and the National Resources Defense Council (NRDC) have come together to develop the FTSE ex-Fossil Fuels Index Series, a fossil fuel free index fund.
Divest the Commonwealth is working to build grassroots effort to move this money. We have started and are supporting city council resolutions from Harrisonburg, VA to Arlington, VA to Richmond, VA and are adding more weekly. Together, the cities and counties of Virginia will begin to bring about the future we want to see. Together, we will create a future we can be proud of.
Join us today and divest today! Every dollar, signature, and voice counts in making sure our money is where our mouth is. This is the way we create a world we want to live and one that we can tell our children about!
Austin Sachs is the director and founder of Protect and Divest, created to build a market solution to climate change. Brought to the environmental movement by the Standing Rock crisis, Austin has worked endlessly to create a world we can all be proud within the economic and political models existing today!
https://www.fractracker.org/a5ej20sjfwe/wp-content/uploads/2018/05/Divest-Cover.jpg400900Guest Authorhttps://www.fractracker.org/a5ej20sjfwe/wp-content/uploads/2025/09/2025-Wordmark-Logo.pngGuest Author2018-05-29 10:00:542021-04-15 15:01:18Divestment – A Necessary Step Towards a Climate Neutral Society
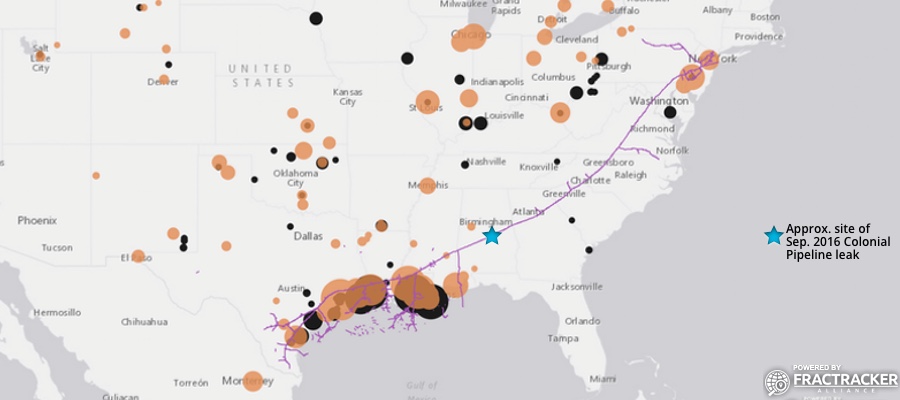
On September 9, 2016 a pipeline leak was detected from the Colonial Pipeline by a mine inspector in Shelby County, Alabama. It is estimated to have spilled ~336,000 gallons of gasoline, resulting in the shutdown of a major part of America’s gasoline distribution system. As such, we thought it timely to provide some data and a map on the Colonial Pipeline Project.
Figure 1. Dynamic map of Colonial Pipeline route and related infrastructure
The Colonial Pipeline was built in 1963, with some segments dating back to at least 1954. Colonial carries gasoline and other refined petroleum projects throughout the South and Eastern U.S. – originating at Houston, Texas and terminating at the Port of New York and New Jersey. This ~5,000-mile pipeline travels through 12 states and the Gulf of Mexico at one point. According to available data, prior to the September 2016 incident for which the cause is still not known, roughly 113,382 gallons had been released from the Colonial Pipeline in 125 separate incidents since 2010 (Table 1).
Table 1. Reported Colonial Pipeline incident impacts by state, between 3/24/10 and 7/25/16
State
Incidents (#)
Barrels* Released
Total Cost ($)
AL
10
91.49
2,718,683
GA
11
132.38
1,283,406
LA
23
86.05
1,002,379
MD
6
4.43
27,862
MS
6
27.36
299,738
NC
15
382.76
3,453,298
NJ
7
7.81
255,124
NY
2
27.71
88,426
PA
1
0.88
28,075
SC
9
1639.26
4,779,536
TN
2
90.2
1,326,300
TX
19
74.34
1,398,513
VA
14
134.89
15,153,471
Total**
125
2699.56
31,814,811
*1 Barrel = 42 U.S. Gallons
** The total amount of petroleum products spilled from the Colonial Pipeline in this time frame equates to roughly 113,382 gallons. This figure does not include the September 2016 spill of ~336,000 gallons.
Unfortunately, the Colonial Pipeline has also been the source of South Carolina’s largest pipeline spill. The incident occurred in 1996 near Fork Shoals, South Carolina and spilled nearly 1 million gallons of fuel into the Reedy River. The September 2016 spill has not reached any major waterways or protected ecological areas, to-date.
Additional Details
Owners of the pipeline include Koch Industries, South Korea’s National Pension Service and Kohlberg Kravis Roberts, Caisse de dépôt et placement du Québec, Royal Dutch Shell, and Industry Funds Management.
For more details about the Colonial Pipeline, see Table 2.
Table 2. Specifications of the Colonial and/or Intercontinental pipeline
https://www.fractracker.org/a5ej20sjfwe/wp-content/uploads/2016/09/ColonialPipeline-Feature.jpg400900FracTracker Alliancehttps://www.fractracker.org/a5ej20sjfwe/wp-content/uploads/2025/09/2025-Wordmark-Logo.pngFracTracker Alliance2016-09-26 13:35:032021-04-15 15:04:25A Proper Picture of the Colonial Pipeline’s Past
This article was originally posted on 10 July 2015, and then updated on 22 January 2016 and 16 February 2016.
Proposed Pipeline to Funnel Marcellus Gas South
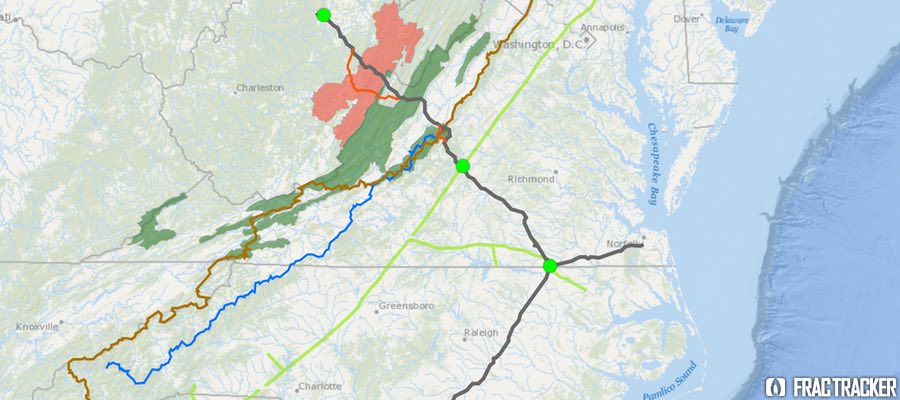
In early fall 2014, Dominion Energy proposed a $5 billion pipeline project, designed provide “clean-burning gas supplies to growing markets in Virginia and North Carolina.” Originally named the “Southeast Reliability Project,” the proposed pipeline would have a 42-inch diameter in West Virginia and Virginia. It would narrow to 36 inches in North Carolina, and narrow again to 20 inches in the portion that would extend to the coast at Hampton Roads. Moving 1.5 billion cubic feet per day of gas, with a maximum allowable operating pressure of 1440 psig (pounds per square inch gage), the pipeline would be designed for larger customers (such as manufacturers and power generators) or local gas distributors supplying homes and businesses to tap into the pipeline along the route, making the pipeline a prime mover for development along its path.
The project was renamed the Atlantic Coast Pipeline (ACP) when a coalition of four major US energy companies—Dominion (45% ownership), Duke Energy (40%), Piedmont Natural Gas (15%), and AGL Resources (5%)— proposed a joint venture in building and co-owning the pipeline. Since then, over 100 energy companies, economic developers, labor unions, manufacturers, and civic groups have joined the new Energy Sure Coalition, supporting the ACP. The coalition asserts that the pipeline is essential because the demand for fuel for power generation is predicted more than triple over the next 20 years. Their website touts the pipeline as a “Path to Cleaner Energy,” and suggests that the project will generate significant tax revenue for Virginia, North Carolina, and West Virginia.
Lew Ebert, president of the North Carolina Chamber of Commerce, optimistically commented:
Having the ability to bring low-cost, affordable, predictable energy to a part of the state that’s desperately in need of it is a big deal. The opportunity to bring a new kind of energy to a part of the state that has really struggled over decades is a real economic plus.
Unlike older pipelines, which were designed to move oil and gas from the Gulf Coast refineries northward to meet energy demands there, the Atlantic Coast Pipeline would tap the Marcellus Shale Formation in Ohio, West Virginia and Pennsylvania and send it south to fuel power generation stations and residential customers. Dominion characterizes the need for natural gas in these parts of the country as “urgent,” and that there is no better supplier than these “four homegrown companies” that have been economic forces in the state for many years.
In addition to the 550 miles of proposed pipeline for this project, three compressor stations are also planned. One would be at the beginning of the pipeline in West Virginia, a second midway in County Virginia, and the third near the Virginia-North Carolina state line. The compressor stations are located along the proposed pipeline, adjacent to the Transcontinental Pipeline, which stretches more than 1,800 miles from Pennsylvania and the New York City Area to locations along the Gulf of Mexico, as far south as Brownsville, TX.
In mid-May 2015, in order to avoid requesting Congressional approval to locate the pipeline over National Park Service lands, Dominion proposed rerouting two sections of the pipeline, combining the impact zones on both the Blue Ridge Parkway and the Appalachian Trail into a single location along the border of Nelson and Augusta Counties, VA. National Forest Service land does not require as strict of approvals as would construction on National Park Service lands. Dominion noted that over 80% of the pipeline route has already been surveyed.
Opposition to the Pipeline on Many Fronts
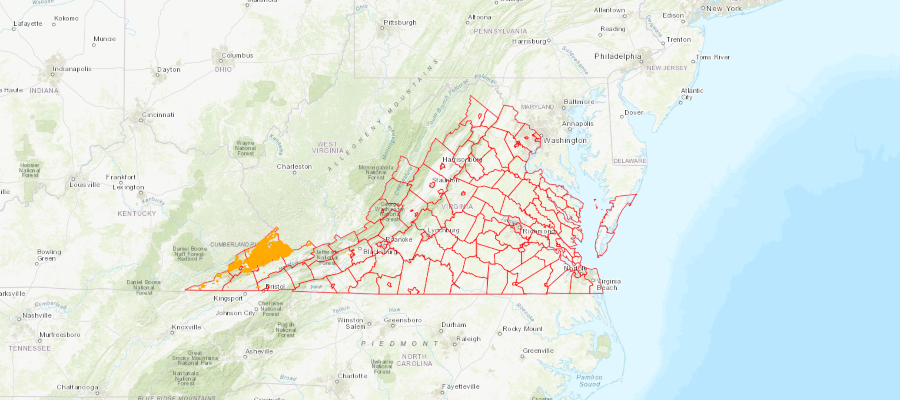
The path of the proposed pipeline crosses topography that is well known for its karst geology feature—underground caverns that are continuous with groundwater supplies. Environmentalists have been vocal in their concern that were part of the pipeline to rupture, groundwater contamination, along with impacts to wildlife could be extensive. In Nelson County, VA, alone, 70% of the property owners in the path of the proposed pipeline have refused Dominion access for survey, asserting that Dominion has been unresponsive to their concerns about environmental and cultural impacts of the project.
On the grassroots front, 38 conservation and environmental groups in Virginia and West Virginia have combined efforts to oppose the ACP. The group, called the Allegany-Blue Ridge Alliance (ABRA), cites among its primary concerns the ecologically-sensitive habitats the proposed pipeline would cross, including over 49.5 miles of the George Washington and Monongahela State Forests in Virginia and West Virginia. The “alternative” version of the pipeline route would traverse 62.7 miles of the same State Forests. Scenic routes, including the Blue Ridge Parkway and the Appalachian Scenic Trail would also be impacted. In addition, it would pose negative impacts on many rural communities but not offset these impacts with any longer-term economic benefits. ABRA is urging for a programmatic environmental impact statement (PEIS) to assess the full impact of the pipeline, and also evaluate “all reasonable, less damaging” alternatives. Importantly, ABRA is urging for a review that explores the cumulative impacts off all pipeline infrastructure projects in the area, especially in light of the increasing availability of clean energy alternatives.
Environmental and political opposition to the pipeline has been strong, especially in western Virginia. Friends of Nelson, based in Nelson County, VA, has taken issue with the impacts posed by the 150-foot-wide easement necessary for the pipeline, as well as the shortage of Department of Environmental Quality staff that would be necessary to oversee a project of this magnitude.
Do gas reserves justify this project?
Dominion, an informational flyer, put forward an interesting argument about why gas pipelines are a more environmentally desirable alternative to green energy:
If all of the natural gas that would flow through the Atlantic Coast Pipeline is used to generate electricity, the 1.5 billion cubic feet per day (bcf/d) would yield approximately 190,500 megawatt-hours per day (mwh/d) of electricity. The pipeline, once operational, would affect approximately 4,600 acres of land. To generate that much electricity with wind turbines, utilities would need approximately 46,500 wind turbines on approximately 476,000 acres of land. To generate that much electricity with solar farms, utilities would need approximately 1.7 million acres of land dedicated to solar power generation.
Nonetheless, researchers, as well as environmental groups, have questioned whether the logic is sound, given production in both the Marcellus and Utica Formations is dropping off in recent assessments.
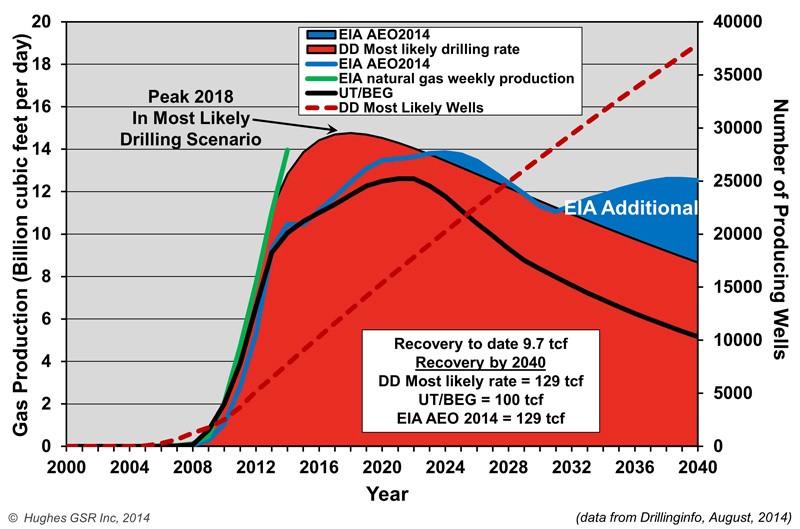
Both Nature, in their article Natural Gas: The Fracking Fallacy, and Post Carbon Institute, in their paper Drilling Deeper, took a critical look at several of the current production scenarios for the Marcellus Shale offered by EIA and University of Texas Bureau of Economic Geology (UT/BEG). All estimates show a decline in production over current levels. The University of Texas report, authored by petroleum geologists, is considerably less optimistic than what has been suggested by the Energy Information Administration (EIA), and imply that the oil and gas bubble is likely to soon burst.
Natural Gas Production Projections for Marcellus Shale
David Hughes, author of the Drilling Deeper report, summarized some of his findings on Marcellus productivity:
Field decline averages 32% per year without drilling, requiring about 1,000 wells per year in Pennsylvania and West Virginia to offset.
Core counties occupy a relatively small proportion of the total play area and are the current focus of drilling.
Average well productivity in most counties is increasing as operators apply better technology and focus drilling on sweet spots.
Production in the “most likely” drilling rate case is likely to peak by 2018 at 25% above the levels in mid-2014 and will cumulatively produce the quantity that the Energy Information Administration (EIA) projected through 2040. However, production levels will be higher in early years and lower in later years than the EIA projected, which is critical information for ongoing infrastructure development plans.
Five out of more than 70 counties account for two-thirds of production. Eighty-five percent of production is from Pennsylvania, 15% from West Virginia and very small amounts from Ohio and New York. (The EIA has published maps of the depth, thickness and distribution of the Marcellus shale, which are helpful in understanding the variability of the play.)
The increase in well productivity over time reported in Drilling Deeper has now peaked in several of the top counties and is declining. This means that better technology is no longer increasing average well productivity in these counties, a result of either drilling in poorer locations and/or well interference resulting in one well cannibalizing another well’s recoverable gas. This declining well productivity is significant, yet expected, as top counties become saturated with wells and will degrade the economics which have allowed operators to sell into Appalachian gas hubs at a significant discount to Henry hub gas prices.
The backlog of wells awaiting completion (aka “fracklog”) was reduced from nearly a thousand wells in early 2012 to very few in mid-2013, but has increased to more than 500 in late 2014. This means there is a cushion of wells waiting on completion which can maintain or increase overall play production as they are connected, even if the rig count drops further.
Current drilling rates are sufficient to keep Marcellus production growing on track for its projected 2018 peak (“most likely” case in Drilling Deeper).
Post Carbon Institute estimates that Marcellus predictions overstate actual production by 45-142%. Regardless of the model we consider, production starts to drop off within a year or two after the proposed Atlantic Coast Pipeline would go into operation. This downward trend leads to some serious questions about whether moving ahead with the assumption of three-fold demand for gas along the Carolina coast should prompt some larger planning questions, and whether the availability of recoverable Marcellus gas over the next twenty years, as well as the environmental impacts of the Atlantic Coast Pipeline, justify its construction.
Next steps
The Federal Energy Regulatory Commission, FERC, will make a final approval on the pipeline route later in the summer of 2015, with a final decision on the pipeline construction itself expected by fall 2016.
UPDATE #1: On January 19, 2016, the Richmond Times-Dispatch reported that the United States Forest Service had rejected the pipeline, due to the impact its route would have on habitats of sensitive animal species living in the two National Forests it is proposed to traverse.
UPDATE #2: On February 12, 2016, Dominion Pipeline Company released a new map showing an alternative route to the one recently rejected by the United States Forest Service a month earlier. Stridently condemned by the Dominion Pipeline Monitoring Coalition as an “irresponsible undertaking”, the new route would not only cross terrain the Dominion had previously rejected as too hazardous for pipeline construction, it would–in avoiding a path through Cheat and Shenandoah Mountains–impact terrain known for its ecologically sensitive karst topography, and pose grave risks to water quality and soil erosion.
On July 5, 2013, the lone engineer of a Montreal, Maine, and Atlantic (MMA) train arrived in Nantes, Quebec, set both the hand and air brakes, finished up his paperwork. He then left the train parked on the main line for the night, unattended atop a long grade. Five locomotives were pulling 72 tanker cars of oil, each containing 30,000 gallons of volatile crude from North Dakota’s Bakken Formation. During the night, the lead locomotive caught fire, so the emergency responders cut off the engine, as per protocol. However, that action led to a loss of pressure of the air brakes. The hand brakes (which were supposed to have been sufficient by themselves) failed, and the train began to run away. By the time it reached Lac-Mégantic early the next morning, the unattended cars were traveling 65 mph. When the train reached the center of town, 63 tank cars derailed and many of those exploded, tragically killing 47 people in a blaze that took over two days to extinguish.
With that event came a heightened awareness of the risks of transporting volatile petroleum products by rail. A derailment happened on a BNSF line near Casselton, North Dakota on December 30, 2013. This train was then struck by a train on an adjacent track, igniting another huge fireball, although this one was luckily just outside of town. On April 30, 2014, a CSX train derailed in Lynchburg, Virginia, setting the James River on fire, narrowly avoiding the dense downtown area of the city of 75,000 people.
North American petroleum transportation by rail. Click on the expanding arrows icon in the top-right corner to access the full screen map with additional tools and description.
Regulators in the US and Canada are scrambling to keep up. DOT-111 tank cars were involved in all of these incidents, and regulators seek to phase them out over the next two years. These cars account for 69% of the fleet of tank cars in the US, however, and up to 80% in Canada. Replacing these cars will be a tough task in the midst of the oil booms in the Bakken and Eagle Ford plays, which have seen crude by rail shipments increase from less than 5,000 cars in 2006 to over 400,000 cars in 2013.
This article is the first of several reports by the FracTracker Alliance highlighting safety and environmental concerns about shipping petroleum and related products by rail. The impacts of the oil and gas extraction industry do not end at the wellhead, but are a part of a larger system of refineries, power plants, and terminals that span the continent.
https://www.fractracker.org/a5ej20sjfwe/wp-content/uploads/2014/08/RailIncidentsBlog.png400900Matt Kelso, BAhttps://www.fractracker.org/a5ej20sjfwe/wp-content/uploads/2025/09/2025-Wordmark-Logo.pngMatt Kelso, BA2014-08-20 12:09:162020-07-21 10:42:43Oil Transportation and Accidents by Rail