FracTracker Alliance released a new map identifying the locations of over 1,200 oil and gas wells using toxic “forever chemicals” in Arkansas, Louisiana, Oklahoma, New Mexico, Texas, and Wyoming.
FracTracker Alliance has released a new national map, filled with energy and petrochemical data. Explore the map, continue reading to learn more, and see how your state measures up!
This map has been updated since this blog post was originally published, and therefore statistics and figures below may no longer correspond with the map
The items on the map (followed by facility count in parenthesis) include:
For oil and gas wells, view FracTracker’s state maps.
Transportation & Storage
Natural gas compressor stations (1,367) – Facilities built along a pipeline route that pressurize natural gas to keep it flowing through the pipeline.
Crude oil rail terminals (94) – Rail terminals that load and unload crude oil (liquid hydrocarbons that have yet to be processed into higher-value petroleum products).
Liquefied natural gas import/export terminals (8) – Facilities that can a) liquefy natural gas so it can be exported as LNG (liquefied natural gas) and/or b) re-gasify LNG so it can be used as natural gas. Natural gas is transported in a liquid state because it takes up less space as a liquid than as a gas.
Natural Gas Underground Storage (486) – Locations where natural gas is stored underground in aquifers, depleted gas fields, and salt formations.
Petroleum Product Terminals (1,484) – Terminals with a storage capacity of 50,000 barrels or more and/or the ability to receive volumes from tanker, barge, or pipeline. Petroleum products include products “produced from the processing of crude oil and other liquids at petroleum refineries, from extraction of liquid hydrocarbons at natural gas processing plants, and from production of finished petroleum products at blending facilities.”
Petroleum Ports (242) – A port that can import and/or export 200,000 or more short tons of petroleum products a year.
Natural gas import/export pipeline facility (54) – A facility where natural gas crosses the border of the continental United States.
Pipelines
Crude oil pipelines – major crude oil pipelines, including interstate truck lines and selected intrastate lines, but not including gathering lines.
Natural gas liquid pipelines – Also referred to as hydrocarbon gas liquid pipelines, they carry the heavier components of the natural gas stream which are liquid under intense pressure and extreme cold, but gas in normal conditions.
Natural gas pipelines– Interstate and intrastate natural gas pipelines. Due to the immensity of this pipeline network and lack of available data, this pipeline layer in particular varies in degree of accuracy.
Petroleum Product Pipelines – Major petroleum product pipelines.
Recent Pipeline Projects – Pipeline projects that have been announced since 2017. This includes projects in various stages, including under construction, complete, planned or canceled. Click on the pipeline for the status.
Processing & Downstream
Natural Gas Processing Plants (478) – Plants that separate impurities and components of the natural gas stream.
Chemical plants (36) – Includes two types of chemical plants – petrochemical production and ammonia manufacturing – that report to EPA’s Greenhouse Gas Reporting Program.
Ethylene Crackers (30) – Also referred to as ethane crackers, these petrochemical complexes that converts ethane (a natural gas liquid) into ethylene. Ethylene is used to make products like polyethylene plastic.
Petroleum Refineries (135) – A plant that processes crude oil into products like petroleum naphtha, diesel fuel, and gasoline.
Power Plants (9,414) – Electric generating plants with a capacity of at least one megawatt, sorted by energy source.
Wind Turbines (63,003) – Zoom in on wind power plants to see this legend item appear.
Natural Resources
Shale Plays (45) – Tight oil and gas shale plays, which are formations where oil and gas can be extracted.
Major Rivers
Solar Energy Potential – Potential solar energy generation, in kilowatt-hours per square meter per day – averaged annually.
This map is by no means exhaustive, but is exhausting. It takes a lot of infrastructure to meet the energy demands from industries, transportation, residents, and businesses – and the vast majority of these facilities are powered by fossil fuels. What can we learn about the state of our national energy ecosystem from visualizing this infrastructure? And with increasing urgency to decarbonize within the next one to three decades, how close are we to completely reengineering the way we make energy?
Key Takeaways
Natural gas accounts for 44% of electricity generation in the United States – more than any other source. Despite that, the cost per megawatt hour of electricity for renewable energy power plants is now cheaper than that of natural gas power plants.
The state generating the largest amount of solar energy is California, while wind energy is Texas. The state with the greatest relative solar energy is not technically a state – it’s D.C., where 18% of electricity generation is from solar, closely followed by Nevada at 17%. Iowa leads the country in relative wind energy production, at 45%.
The state generating the most amount of energy from both natural gas and coal is Texas. Relatively, West Virginia has the greatest reliance on coal for electricity (85%), and Rhode Island has the greatest percentage of natural gas (92%).
With 28% of total U.S. energy consumption for transportation, many of the refineries, crude oil and petroleum product pipelines, and terminals on this map are dedicated towards gasoline, diesel, and other fuel production.
Petrochemical production, which is expected to account for over a third of global oil demand growth by 2030, takes the form of chemical plants, ethylene crackers, and natural gas liquid pipelines on this map, largely concentrated in the Gulf Coast.
Electricity generation
The “power plant” legend item on this map contains facilities with an electric generating capacity of at least one megawatt, and includes independent power producers, electric utilities, commercial plants, and industrial plants. What does this data reveal?
In terms of the raw number of power plants – solar plants tops the list, with 2,916 facilities, followed by natural gas at 1,747.
In terms of megawatts of electricity generated, the picture is much different – with natural gas supplying the highest percentage of electricity (44%), much more than the second place source, which is coal at 21%, and far more than solar, which generates only 3% (Figure 1).
Figure 1. Electricity generation by source in the United States, 2019. Data from EIA.
This difference speaks to the decentralized nature of the solar industry, with more facilities producing less energy. At a glance, this may seem less efficient and more costly than the natural gas alternative, which has fewer plants producing more energy. But in reality, each of these natural gas plants depend on thousands of fracked wells – and they’re anything but efficient.
The cost per megawatt hour of electricity for a renewable energy power plants is now cheaper than that of fracked gas power plants. A report by the Rocky Mountain Institute, found “even as clean energy costs continue to fall, utilities and other investors have announced plans for over $70 billion in new gas-fired power plant construction through 2025. RMI research finds that 90% of this proposed capacity is more costly than equivalent [clean energy portfolios, which consist of wind, solar, and energy storage technologies] and, if those plants are built anyway, they would be uneconomic to continue operating in 2035.”
The economics side with renewables – but with solar, wind, geothermal comprising only 12% of the energy pie, and hydropower at 7%, do renewables have the capacity to meet the nation’s energy needs? Yes! Even the Energy Information Administration, a notorious skeptic of renewable energy’s potential, forecasted renewables would beat out natural gas in terms of electricity generation by 2050 in their 2020 Annual Energy Outlook.
This prediction doesn’t take into account any future legislation limiting fossil fuel infrastructure. A ban on fracking or policies under a Green New Deal could push renewables into the lead much sooner than 2050.
In a void of national leadership on the transition to cleaner energy, a few states have bolstered their renewable portfolio.
Figure 2. Electricity generation state-wide by source, 2019. Data from EIA.
One final factor to consider – the pie pieces on these state charts aren’t weighted equally, with some states’ capacity to generate electricity far greater than others. The top five electricity producers are Texas, California, Florida, Pennsylvania, and Illinois.
Transportation
In 2018, approximately 28% of total U.S. energy consumption was for transportation. To understand the scale of infrastructure that serves this sector, it’s helpful to click on the petroleum refineries, crude oil rail terminals, and crude oil pipelines on the map.
Transportation Fuel Infrastructure. Data from EIA.
The majority of gasoline we use in our cars in the US is produced domestically. Crude oil from wells goes to refineries to be processed into products like diesel fuel and gasoline. Gasoline is taken by pipelines, tanker, rail, or barge to storage terminals (add the “petroleum product terminal” and “petroleum product pipelines” legend items), and then by truck to be further processed and delivered to gas stations.
China leads the world in this movement. In 2018, just over half of the world’s electric vehicles sales occurred in China. Analysts predict that the country’s oil demand will peak in the next five years thanks to battery-powered vehicles and high-speed rail.
In the United States, the percentage of electric vehicles on the road is small but growing quickly. Tax credits and incentives will be important for encouraging this transition. Almost half of the country’s electric vehicle sales are in California, where incentives are added to the federal tax credit. California also has a “Zero Emission Vehicle” program, requiring electric vehicles to comprise a certain percentage of sales.
We can’t ignore where electric vehicles are sourcing their power – and for that we must go back up to the electricity generation section. If you’re charging your car in a state powered mainly by fossil fuels (as many are), then the electricity is still tied to fossil fuels.
Petrochemicals
Many of the oil and gas infrastructure on the map doesn’t go towards energy at all, but rather aids in manufacturing petrochemicals – the basis of products like plastic, fertilizer, solvents, detergents, and resins.
Natural gas processing plants separate components of the natural gas stream to extract natural gas liquids like ethane and propane – which are transported through the natural gas liquid pipelines. These natural gas liquids are key building blocks of the petrochemical industry.
Ethane crackers process natural gas liquids into polyethylene – the most common type of plastic.
The chemical plants on this map include petrochemical production plants and ammonia manufacturing. Ammonia, which is used in fertilizer production, is one of the top synthetic chemicals produced in the world, and most of it comes from steam reforming natural gas.
As we discuss ways to decarbonize the country, petrochemicals must be a major focus of our efforts. That’s because petrochemicals are expected to account for over a third of global oil demand growth by 2030 and nearly half of demand growth by 2050 – thanks largely to an increase in plastic production. The International Energy Agency calls petrochemicals a “blind spot” in the global energy debate.
Petrochemical development off the coast of Texas, November 2019. Photo by Ted Auch, aerial support provided by LightHawk.
Investing in plastic manufacturing is the fossil fuel industry’s strategy to remain relevant in a renewable energy world. As such, we can’t break up with fossil fuels without also giving up our reliance on plastic. Legislation like the Break Free From Plastic Pollution Act get to the heart of this issue, by pausing construction of new ethane crackers, ensuring the power of local governments to enact plastic bans, and phasing out certain single-use products.
“The greatest industrial challenge the world has ever faced”
Mapped out, this web of fossil fuel infrastructure seems like a permanent grid locking us into a carbon-intensive future. But even more overwhelming than the ubiquity of fossil fuels in the US is how quickly this infrastructure has all been built. Everything on this map was constructed since Industrial Revolution, and the vast majority in the last century (Figure 3) – an inch on the mile-long timeline of human civilization.
Figure 3. Global Fossil Fuel Consumption. Data from Vaclav Smil (2017)
In fact, over half of the carbon from burning fossil fuels has been released in the last 30 years. As David Wallace Wells writes in The Uninhabitable Earth, “we have done as much damage to the fate of the planet and its ability to sustain human life and civilization since Al Gore published his first book on climate than in all the centuries—all the millennia—that came before.”
What will this map look like in the next 30 years?
A recent report on the global economics of the oil industry states, “To phase out petroleum products (and fossil fuels in general), the entire global industrial ecosystem will need to be reengineered, retooled and fundamentally rebuilt…This will be perhaps the greatest industrial challenge the world has ever faced historically.”
Is it possible to build a decentralized energy grid, generated by a diverse array of renewable, local, natural resources and backed up by battery power? Could all communities have the opportunity to control their energy through member-owned cooperatives instead of profit-thirsty corporations? Could microgrids improve the resiliency of our system in the face of increasingly intense natural disasters and ensure power in remote regions? Could hydrogen provide power for energy-intensive industries like steel and iron production? Could high speed rail, electric vehicles, a robust public transportation network and bike-able cities negate the need for gasoline and diesel? Could traditional methods of farming reduce our dependency on oil and gas-based fertilizers? Could zero waste cities stop our reliance on single-use plastic?
Of course! Technology evolves at lightning speed. Thirty years ago we didn’t know what fracking was and we didn’t have smart phones. The greater challenge lies in breaking the fossil fuel industry’s hold on our political system and convincing our leaders that human health and the environment shouldn’t be externalized costs of economic growth.
https://www.fractracker.org/a5ej20sjfwe/wp-content/uploads/2020/02/National-map-feature-3.png400900Erica Jacksonhttps://www.fractracker.org/a5ej20sjfwe/wp-content/uploads/2025/09/2025-Wordmark-Logo.pngErica Jackson2020-02-28 17:35:142022-05-02 15:21:42National Energy and Petrochemical Map
Highlighting the maps of radioactive oil and gas exploration and production wastes created in collaboration with the Western Organization of Research Councils
By Kyle Ferrar, Western Program Coordinator, FracTracker Alliance
Scott Skokos, Western Organization of Research Councils
Oil and gas waste can be radioactive, but it is not considered “hazardous,” at least according to the federal government. In this article, we summarize several of the hazardous risks resulting from the current federal policy that fails to regulate this massive waste stream, and the gaps left by states. Of the six states mapped in this assessment, only the state of Montana has initiated any type of rule-making process to manage the waste.
When it comes to unconventional oil and gas waste streams:
Nobody can say how much of any type of waste is being produced, what it is, and where it’s ending up. – Nadia Steinzor, Earthworks
Why is accurate waste data so hard to come by? The Earthworks report, Wasting Away explains that the U.S. EPA intentionally exempted oil and gas exploration and production wastes from the federal regulations known as the Resource Conservation and Recovery Act (RCRA) despite concluding that such wastes “contain a wide variety of hazardous constituents.” As a result, there is very little waste tracking and reporting of oil and gas waste data nationally.
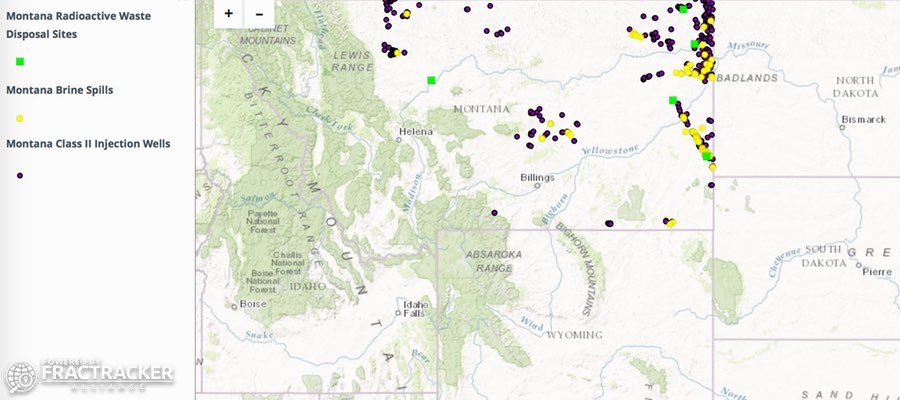
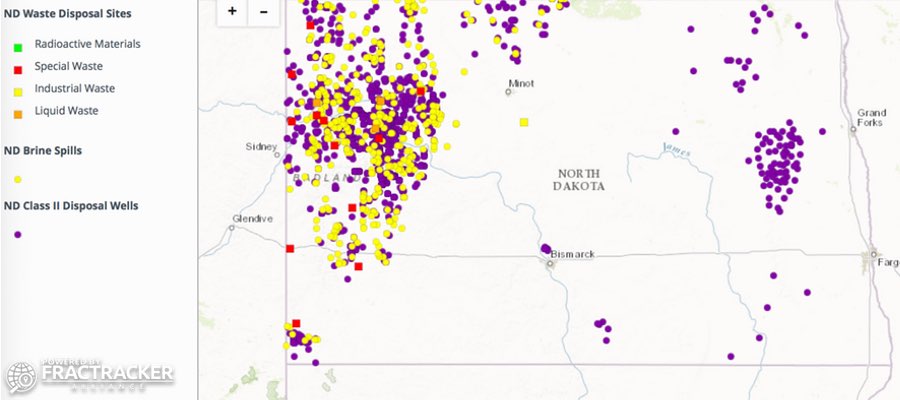
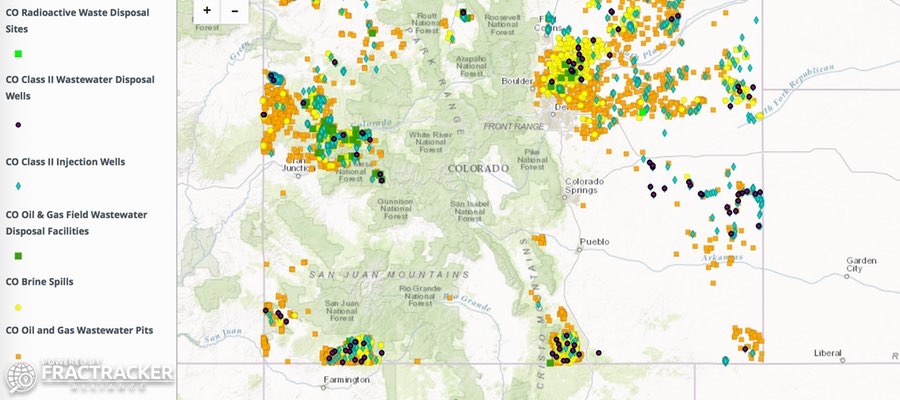
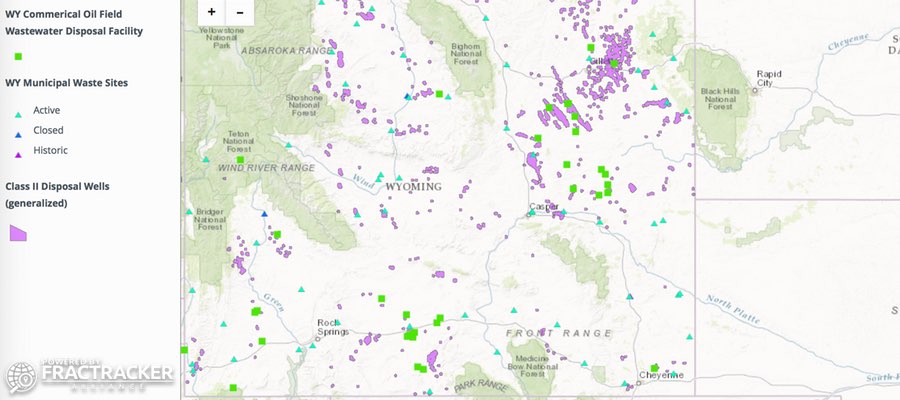
State Waste Management Maps
Some data is available at the state level, so we at FracTracker have compiled, cleaned, and mapped what little data we could find.
State-specific maps have been created for Montana, North Dakota, Colorado, and Wyoming – see below:
When we hear about “radioactive waste” associated with the energy industry, nuclear power stations and fission reactors are usually what come to mind. But, as the EPA explains, fracking has transformed the nature of the oil and gas waste stream. Components of fracking waste differ from conventional oil and gas exploration and production wastes in a number of ways:
In general, the waste stream has additional hazardous components, and that transformation includes increased radioactivity.
Fracking has allowed for more intrusive drilling, penetrating deep sedimentary formations using millions of gallons of fluid.
Drilling deeper produces more drill cuttings.
The process of hydraulic fracking introduces millions more gallons of fluid into the ground that then return to the surface. These returns are ultimately contaminated and require disposal.
The formations targeted for unconventional development are mostly ancient seabeds still filled with salty “brines” known as “formation waters.”
In addition to the hazardous chemicals in the fracking fluid pumped into the wells for fracking, these unconventional formations contain larger amounts of heavy metals, carcinogens and other toxics. This also includes more radioisotopes such as Uranium, Thorium, Radium, Potassium-40, Lead-210, and Polonium-210 than the conventional formations that have supplied the majority of oil and gas prior to the shale boom.
A variety of waste products make up the waste stream of oil and gas development, and each is enhanced with naturally occurring radioactive materials (NORM). This waste stream must be treated and disposed of properly. All the oil and gas equipment – such as production equipment, processing equipment, produced water handing equipment, and waste management equipment – also need to be considered as sources of radioactive exposure.
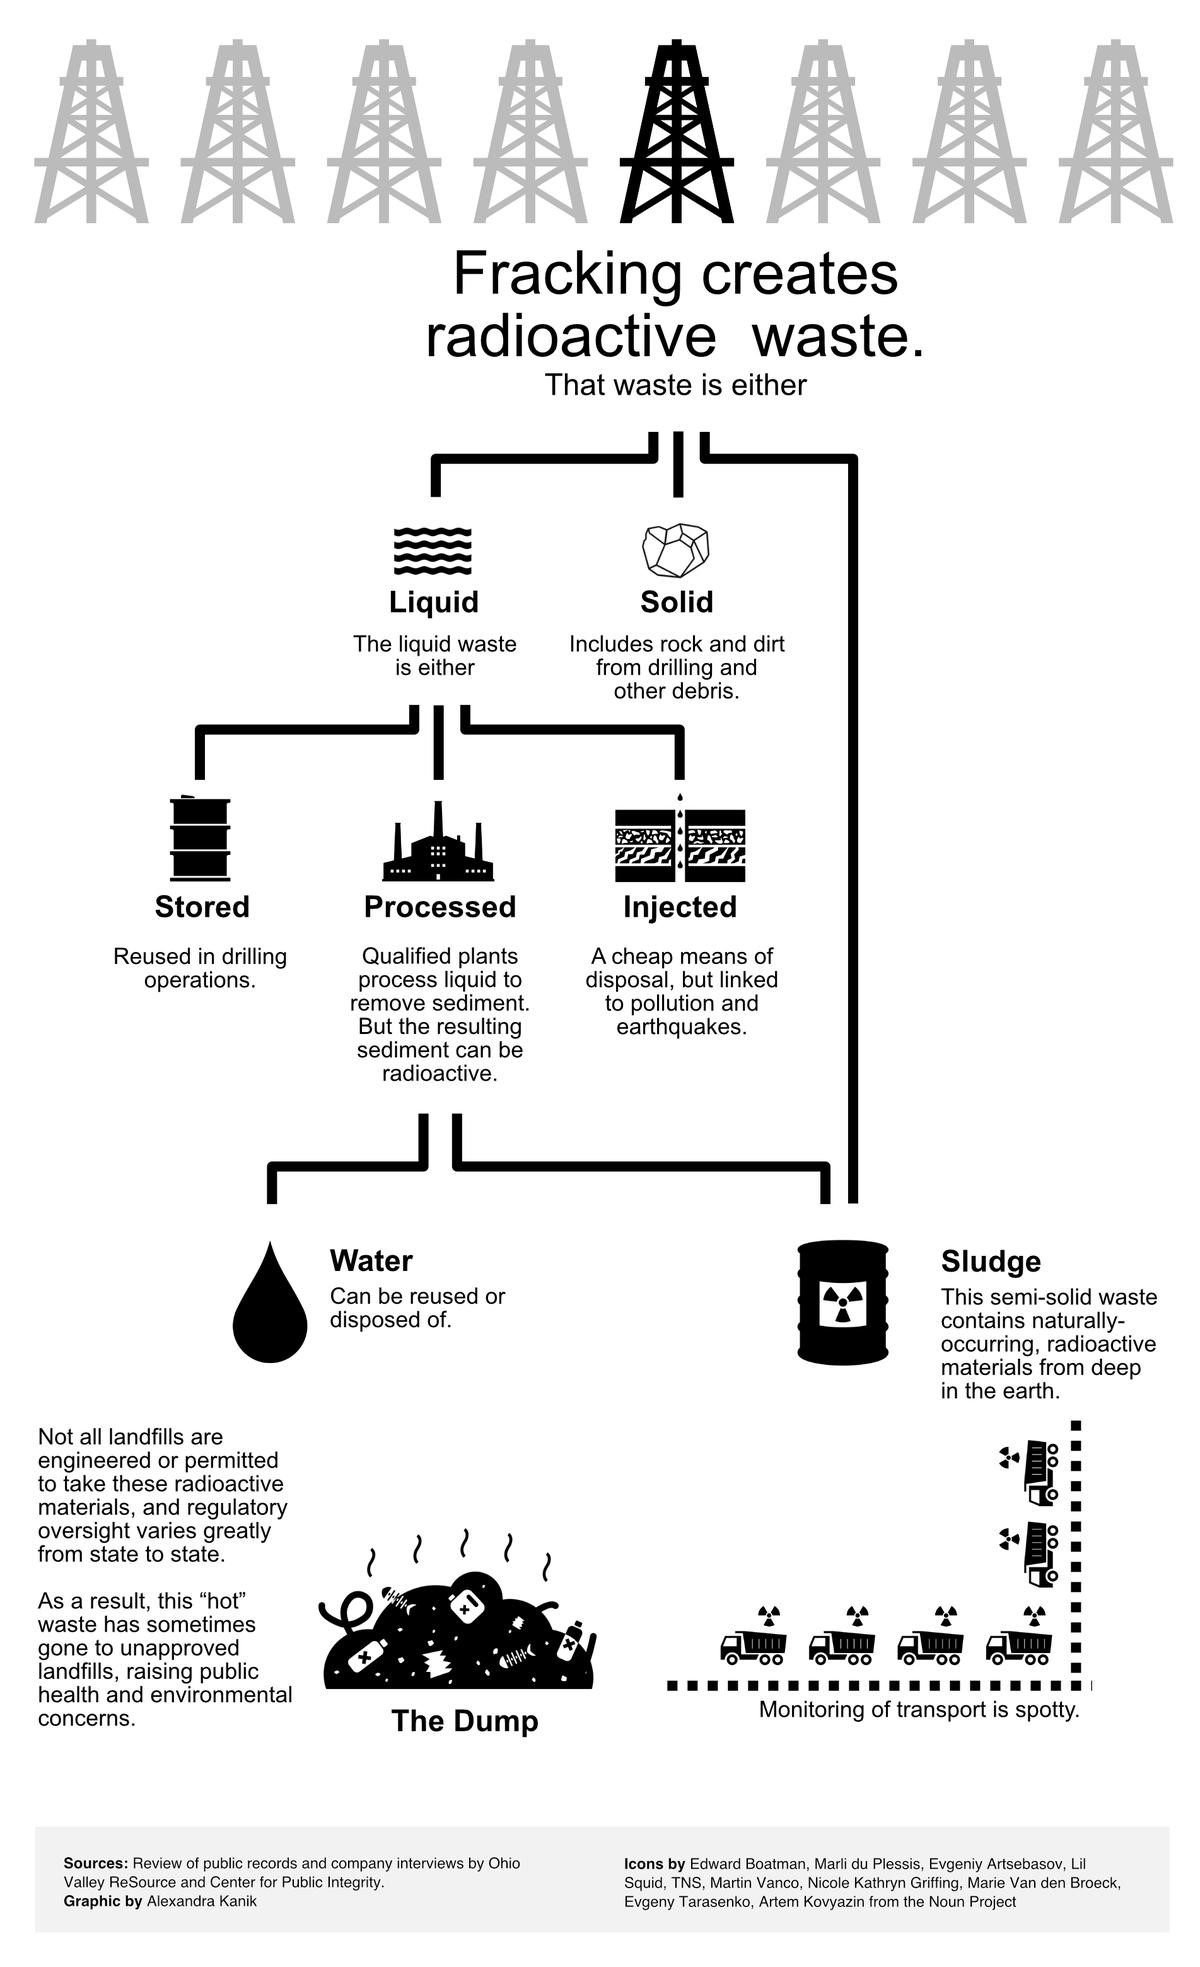
Figure 1 below explains where the waste from fracking goes after it leaves the well pad.
Figure 1. Breakdown of the radioactive oil and gas waste life-cycle
Three facets of the waste stream particularly enhanced with NORMs by fracking include scales, produced waters, and sludges.
A. Scales
When injected into the ground, fracking fluid mixes with formation waters, dissolving metals, radioisotopes and other inorganic compounds. Additionally the fracking liquids are often supplemented with strong acids to reduce “scaling” from precipitate build up (to prevent clogging up the well). Regardless, each oil well generates approximately 100 tons of radioactive scale annually. As each oil and gas reservoir is drained, the amount of scale increases. The EPA reports that lead-210 and polonium-210 are commonly found in scales along with their decay product radon at concentrations estimated to be anywhere from 480 picocuries per gram (pCi/g) to 400,000 pCi/g). Scale can be disposed of as a solid waste, or dissolved using “scale inhibitors.” These radioactive elements then end up in the liquid waste portion of the waste stream, known as produced waters.
B. Produced Waters
In California, strong acids are used to further dissolve formations to stimulate additional oil production. Acidic liquids are able to dissolve more inorganic elements and compounds such as radioisotopes. While uranium and thorium are not soluble in water, their radioactive decay products such as radium dissolve in the brines. The brines return to the surface as “produced water.” As the oil and gas in the formation are removed, much of what is pumped to the surface is formation water.
Consequently, declining oil and gas fields generate more produced water. The ratio of produced water to oil in conventional well was approximately 10 barrels of produced water per barrel of oil. According to the American Petroleum Institute (API), more than 18 billion barrels of waste fluids from oil and gas production are generated annually in the United States. There are several options for managing the liquid waste stream. The waste could be treated using waste treatment facilities, reinjected into other wells to enhance production (a cheaper option), or injected for disposal. Before disposal of the liquid portion, all the solids in the solution must be removed, resulting in a “sludge.”
C. Sludges
The U.S. EPA reports that conventional oil production alone produces 230,000 million tons – or five million ft3 (141 cubic meters) – of TENORM sludge each year. Unconventional processes produce much more sludge waste than conventional processes. The average concentration of radium in sludges is estimated to be 75 pCi/g, while the concentration of lead-210 can be over 27,000 pCi/g. Sludges present a high risk to the environment and a higher risk of exposure for people and other receptors in those environments because sludges are typically very water soluble.
Federal Exemptions
According to the EPA, “because the extraction process concentrates the naturally occurring radionuclides and exposes them to the surface environment and human contact, these wastes are classified as Technologically Enhanced Naturally Occurring Radioactive Material (TENORM).” Despite the conclusions that oil and gas TENORM pose a risk to the environment and humans, the EPA exempts oil and gas exploration and production wastes from the definition of “hazardous” under Resource Conservation and Recovery Act (RCRA) law. In fact, most wastes from all of the U.S. fossil fuel energy industry, including coal-burning and natural gas, are exempt from the disposal standards that hazardous waste normally requires.
The Center for Public Integrity calls this radioactive waste stream “orphan waste,” because no single government agency is fully managing it.
Just last month (January 10, 2017) the U.S. EPA agreed to review federal regulations of oil and gas waste – a process they were meant to do every 3 years for the last 30 years. The EPA has until March 15, 2019, to determine whether or not regulatory changes are warranted for “wastes associated with the exploration, development, or production of crude oil, natural gas, or geothermal energy.” With the recent freeze on all U.S. EPA grants, however, it is not clear whether these regulations will receive the review they need.
State Regulations
Regulation of this waste stream is left up to the states, but most states do not require operators to manage the radioactivity in oil and gas wastes, either. Because of the federal RCRA exemptions most state policies ignore the radioactive issue altogether. Operators are free to dispose of the waste at any landfill facility, unless the landfill tells them otherwise. For detailed analyses of state policies, see pages 10-45 of the No Time to Waste report. FracTracker has also covered these issues in Pennsylvania and Ohio.
Another issue that screams for federal consideration of this waste stream is that states do not have the authority to determine whether or not the wastes can cross their borders. States also do not have the jurisdiction to decide whether or not facilities in their state can accept waste from across state lines. That determination is reserved for federal jurisdiction, and there are not any federal laws regulating such wastes. In fact, these wastes are strategically exempt from federal regulation for just these reasons.
Why can’t the waste be treated?
This type of industrial waste actually cannot be treated, at least not entirely. Unlike organic pollutants that can be broken down, inorganic constituents of the waste cannot be simply disintegrated out of existence. Inorganic components include heavy metals like arsenic and bromides, as well as radioactive isotopes of radium, lead, and uranium. Such elements will continue to emit radiation for hundreds-to-thousands of years. The best option available is to find a location to “isolate” and dispose of these wastes – a sacrifice zone.
Current management practices do their best to separate the liquid portions from the solid portions, but that’s about it. Each portion can then be disposed independently of each other. Liquids are injected into the ground, which is the cheapest option where it is available. If enough of the dissolved components (heavy metals, salts, and radioisotopes) can be removed, wastewaters are discharged into surface waters. The compounds and elements that are removed from the liquid waste stream are hyper-concentrated in the solid portion of the waste, described as “sludge” in the graphic above. This hazardous material can be disposed of in municipal or solid waste landfills if the state regulators do not require the radioactivity or toxicity of this material to be a consideration for disposal. There are not federal requirements, so unless there is a specific state policy regarding the disposal, it can end up almost anywhere with little oversight. These chemicals do not magically disappear. They never disappear.
Risks
There are multiple pathways for contamination from facilities that are not qualified to manage radioactive and hazardous wastes. At least seven different environmental pathways provide potential risks for human exposure. They include:
Radon inhalation,
External gamma exposure,
Groundwater ingestion,
Surface water ingestion,
Dust inhalation,
Food ingestion, and
Skin beta exposure from particles containing the radioisotopes.
According to the EPA, the low-level radioactive materials in drilling waste present a definitive risk to those exposed. High risk examples include dust suppression and leaching. If dust is not continuously suppressed, radioactive materials in dust pose a risk to people at these facilities or those receptors or secondary pathways located downwind of the facilities. Radioactive leachate entering surface waters and groundwaters is also a significant threat. A major consideration is that radioactive waste can last in these landfills far longer than the engineered lifespans of landfills, particularly those that are not designed to retain hazardous wastes.
Cases of Contamination
North Dakota
In North Dakota, the epicenter of the Bakken Oil Fields, regulators were not ready for the massive waste streams that came from the fast growing oil fields. This allowed thousands of wastewater disposal wells be drilled to dispose of salty wastewater without much oversight, and no places in state for companies to dispose of radioactive solid waste. Many of the wastewater disposal wells were drilled haphazardly, and as a result many contaminated surrounding farmland with wastewater. With regard to radioactive solid waste, the state until recently had a de facto ban on solid radioactive waste disposal due to their radioactivity limit being 5 picocuries per gram. The result of this de facto ban made it so companies either had to make one of two decisions: 1. Haul their radioactive solid waste above the limit out of state to facilities in Idaho or Colorado; or 2. Risk getting caught illegally dumping waste in municipal landfills or just plain illegal dumping in roadsides, buildings, or farmland.
In 2014, a massive illegal dumping site was discovered in Noonan, ND when North Dakota regulators found a gas station full of radioactive waste and filter socks (the socks used to filter out solid waste from wastewater, which contain high levels of radioactivity). Following the Noonan, ND incident North Dakota regulators and politicians began discussions regarding the need for new regulations to address radioactive solid waste.
In 2015, North Dakota moved to create rules for the disposal of solid radioactive waste. Its new regulations increase the radioactivity limit from 5 picocuries per gram to 50 picocuries per gram, and sets up new requirements for the permitting of waste facilities accepting radioactive waste and the disposal of radioactive waste in the waste facilities. Dakota Resource Council, a member group of WORC, challenged the rules in the courts, arguing the rules are not protective enough and that the agency responsible for the rules pushed through the rules without following the proper procedures. Currently the rules are not in effect until the litigation is settled.
Pennsylvania
In Pennsylvania, the hotbed of activity for Marcellus Shale gas extraction, the regulatory body was ill equipped and uninformed for dealing with the new massive waste stream when it first arrived on scene. Through 2013, the majority of wastewater was disposed of in commercial and municipal wastewater treatment facilities that discharge to surface waters. Numerous facilities engaged in this practice without amending their federal discharge permits to include this new waste stream.
Waste treatment facilities in Pennsylvania tried to make the waste streams less innocuous by diluting the concentrations of these hazardous pollutants. They did this by mixing the fracking wastes with other waste streams, including industrial discharges and municipal waste. Other specialized facilities also tried to remove these dissolved inorganic elements and filter them from the discharge stream.
As a result of site assessments by yours-truly and additional academic research, these facilities realized that such hazardous compounds do not simply dilute into receiving waters such as the Allegheny, Monongahela, and Ohio rivers. Instead, they partition (settle) into sediments where they are hyper-concentrated. As a result of the lawsuits that followed the research, entire river bottoms in Pennsylvania had to be entirely dug up, removed, and disposed of in hazardous waste landfills.
Action Plans Needed
Massive amounts of solid and liquid wastes are still generated during drilling exploration and production from the Marcellus Shale. There is so much waste, operators don’t know what to do with it. In Pennsylvania, there is not much they can do with it, but it is not just Pennsylvania. Throughout the Ohio River Valley, operators struggle to dispose of this incredibly large waste stream.
Ohio, West Virginia, and Pennsylvania have all learned that this waste should not be allowed to be discharged to surface waters even after treatment. So it goes to other states – those without production or the regulatory framework to manage the wastes. Like every phase of production in the oil and gas industry, operators (drillers) shop around for the lowest disposal costs. In Estill County, Kentucky, the State Energy and Environment Department just recently cited the disposal company Advance Disposal Services Blue Ridge Landfill for illegally dumping hydraulic fracturing waste. The waste had traveled from West Virginia Marcellus wells, and ended up at an ignorant or willfully negligent waste facility.
In summary, there is inadequate federal oversight of potentially hazardous waste coming from the oil and gas industry, and there are serious regulatory gaps within and between states. Data management practices, too, are lacking. How then, is the public health community supposed to assess the risk that the waste stream poses to people? Obviously, a more thorough action plan is needed to address this issue.
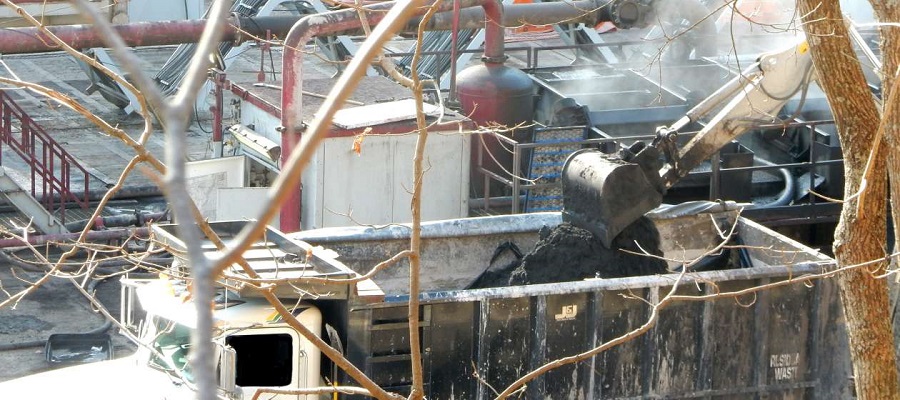
Feature image: Drill cuttings being prepared to be hauled away from the well pad. Photo by Bill Hughes, OVEC
https://www.fractracker.org/a5ej20sjfwe/wp-content/uploads/2016/04/PublicIntegrity_Bill-Hughes_re.jpg400900Kyle Ferrar, MPHhttps://www.fractracker.org/a5ej20sjfwe/wp-content/uploads/2025/09/2025-Wordmark-Logo.pngKyle Ferrar, MPH2017-03-09 13:20:442021-04-15 15:03:39Oil and Gas Wastes are Radioactive – and Lack Regulatory Oversight
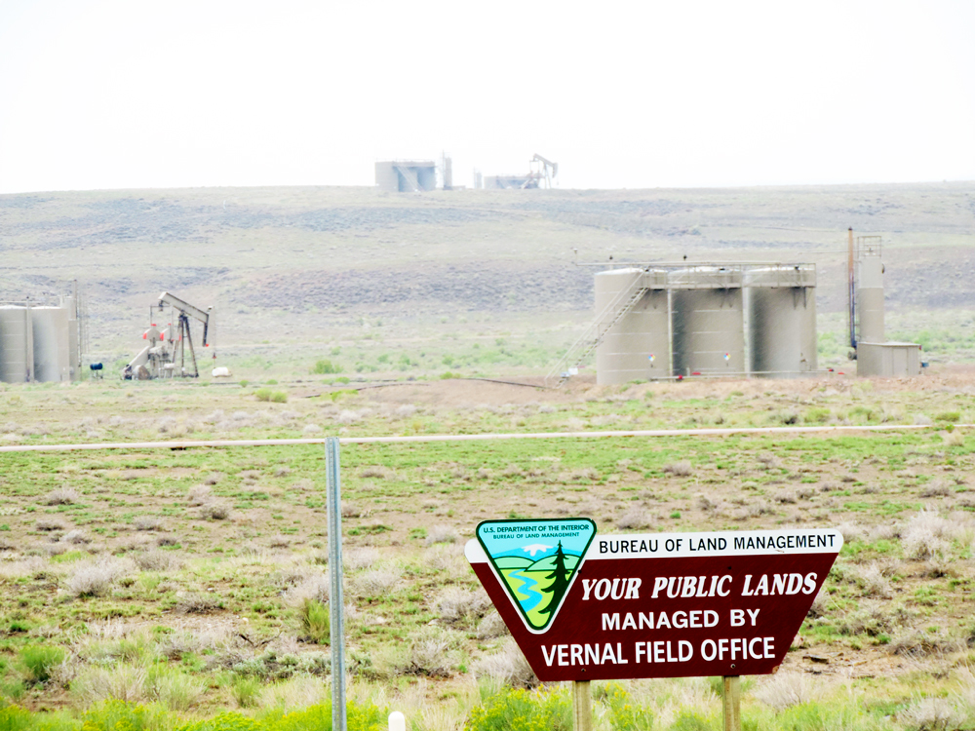
As an American, you are part owner of 640 million acres of our nation’s shared public lands managed by the federal government. And chances are, you’ve enjoyed a few of these lands on family picnics, weekend hikes or summer camping trips. But did you know that some of your lands may also be leading to toxic air pollution and poor health for you or your neighbors, especially in 5 western states that have high oil and gas drilling activity?
A set of new interactive maps created by FracTracker, The Wilderness Society, and partner groups show the threatened populations who live within a half mile of federal oil and gas wells – people who may be breathing in toxic pollution on a regular basis.
Altogether, air pollution from oil and gas development on public lands threatens at least 73,900 people in the 5 western states we examined. The states, all of which are heavy oil and gas leasing areas, include Colorado, New Mexico, North Dakota, Utah and Wyoming.
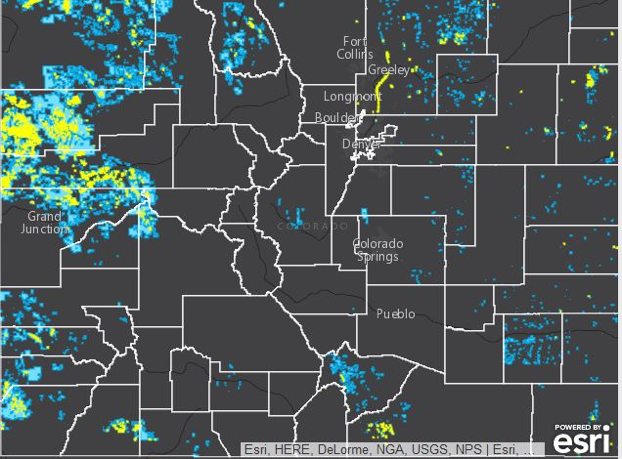
Figure 1. Close up of threat map in Colorado
In each state, the data show populations living near heavy concentrations of wells. For example just northeast of Denver, Colorado, in the heavily populated Weld County, at least 11,000 people are threatened by oil and gas development on public lands (Figure 1).
Western cities, like Farmington, New Mexico; Gillette, Wyoming; and Grand Junction, Colorado are at highest risk of exposure from air pollution. In New Mexico, especially, concentrated oil and gas activity disproportionately affects the disadvantaged and minorities. Many wells can be found near population centers, neighborhoods and even schools.
Colorado: Wells concentrated on Western Slope, Front Range
Note: The threatened population in states are a conservative estimate. It is likely that the numbers affected by air pollution are higher.
In 2014, Colorado became the first state in the nation to try to curb methane pollution from oil and gas operations through comprehensive regulations that included inspections of oil and gas operations and an upgrade in oil and gas infrastructure technology. Colorado’s new regulations are already showing both environmental and financial benefits.
But nearly 16,000 people – the majority living in the northwestern and northeastern part of the state – are still threatened by pollution from oil and gas on public lands.
Many of the people whose health is endangered from pollution are concentrated in the fossil-fuel rich area of the Western Slope, near Grand Junction. In that area, three counties make up 65% of the total area in Colorado threatened by oil and gas development.
In Weld County, just northeast of Denver, more than 11,000 residents are threatened by air pollution from oil and gas production on federal lands. But what’s even more alarming is that five schools are within a half mile radius of wells, putting children at risk on a daily basis of breathing in toxins that are known to increase asthma attacks. Recent studies have shown children miss 500,000 days of school nationally each year due to smog related to oil and gas production.
State regulations in Colorado have helped improve air quality, reduce methane emissions and promote worker care and safety in the past two years, but federal regulations expected by the end of 2016 will have a broader impact by regulating pollution from all states.
New Mexico: Pollution seen from space threatens 50,000 people
With more than 30,000 wells covering 4.6 million acres, New Mexico is one of the top states for oil and gas wells on public lands. Emissions from oil and gas infrastructure in the Four Corners region are so great, they have formed a methane hot spot that has been extensively studied by NASA and is clearly visible from space.
Nearly 50,000 people in northwestern New Mexico – 40% of the population in San Juan County – live within a half mile of a well.
Dangerous emissions from those wells in San Juan County disproportionately affect minorities and disadvantaged populations, with about 20% Hispanic, almost 40% Native American, and over 20% living in poverty.
Another hot spot of oil and activity is in southeastern New Mexico stretching from the lands surrounding Roswell to the southern border with Texas. Wells in this region also cover the lands outside of Carlsbad Caverns National Park, potentially affecting the air quality and visibility for park visitors. Although less densely populated, another 4,000 people in two counties – with around 50% of the population Hispanic – are threatened by toxic air pollution.
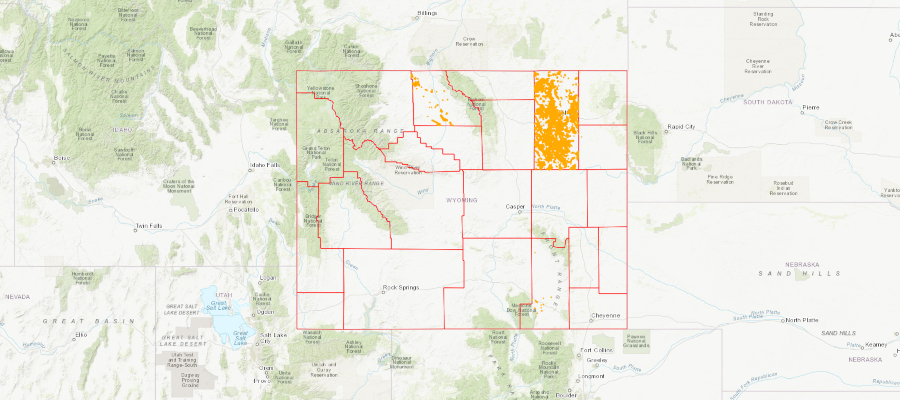
Wyoming: Oil and gas emissions add to coal mining pollution
Pollution from oil and gas development in Wyoming, which has about as many wells as New Mexico, is focused in the Powder River Basin. This region in the northeast of the state provides 40% of the coal produced in the United States.
Oil and gas pollution threatens approximately 4,000 people in this region where scarred landscapes and polluted waterways are also prevalent from coal mining.
With the Obama administration’s current pause on federal coal leasing and a review of the federal coal program underway, stopping pollution from oil and gas on public lands in Wyoming would be a major step in achieving climate goals and preserving the health of local communities.
Utah: Air quality far below federal standards
Utah has almost 9,000 active wells on public lands. Oil and gas activity in Utah has created air quality below federal standards in one-third of Utah’s counties, heightening the risk of asthma and respiratory illnesses. Especially in the Uintah Basin in northeastern Utah – where the majority of oil and development occurs – a 2014 NOAA-led study found oil and gas activity can lead to high levels of ozone in the wintertime that exceed federal standards.
North Dakota: Dark skies threatened by oil and gas activity
The geology of western North Dakota includes the Bakken Formation, one of the largest deposits of oil and gas in the United States. As a result, high oil and gas production occurs on both private and public lands in the western part of the state.
Nearly 650 wells on public lands are clustered together here, directly impacting popular recreational lands like Theodore Roosevelt National Park.
The 70,000-plus-acre park – named after our president who first visited in 1883 and fell in love with the incredible western landscape – is completely surrounded by high oil and gas activity. Although drilling is not allowed in the park, nearby private and public lands are filled with active wells, producing pollution, traffic and noise that can be experienced from the park. Due to its remote location, the park is known for its incredible night sky, but oil and gas development increases air and light pollution, threatening visibility of the Milky Way and other astronomical wonders.
Now that we can see how many thousands of people are threatened by harmful emissions from our public lands, it is more important than ever that we finalize strong federal regulations that will help curb the main pollutant of natural gas – methane – from being leaked, vented, and flared from oil and gas infrastructure on public lands.
Federal oil and gas wells in western states produce unseen pollution that threatens populations at least a half mile away. Photo: WildEarth Guardians, flickr.
We need to clean up our air now
With U.S. public lands accounting for 1/5 of the greenhouse gas footprint in the United States, we need better regulations to reduce polluting methane emissions from the 96,000 active oil and gas wells on public lands.
Right now, the Bureau of Land Management is finalizing federal regulations that are expected by the end of 2016. These regulations are expected to curb emissions from existing sources – wells already in production – that are a significant source of methane pollution on public lands. This is crucial, since by 2018, it is estimated that nearly 90% of methane emissions will come from sources that existed in 2011.
Final regulations from the Bureau of Land Management will also add to other regulations from the EPA and guidance from the Obama administration to modernize energy development on public lands for the benefit of the American people, landscapes and the climate. In the face of a changing climate, we need to continue to monitor fossil fuel development on public lands and continue to push the government towards better protections for land, air, wildlife and local communities.
By The Wilderness Society – The Wilderness Society is the leading conservation organization working to protect wilderness and inspire Americans to care for our wild places. Founded in 1935, and now with more than 700,000 members and supporters, The Wilderness Society has led the effort to permanently protect 109 million acres of wilderness and to ensure sound management of our shared national lands.
https://www.fractracker.org/a5ej20sjfwe/wp-content/uploads/2016/10/ProdPublicLand-Feature.jpg400900Guest Authorhttps://www.fractracker.org/a5ej20sjfwe/wp-content/uploads/2025/09/2025-Wordmark-Logo.pngGuest Author2016-10-31 09:00:302021-04-15 15:04:23Interactive maps show nearness of oil and gas wells to communities in 5 states
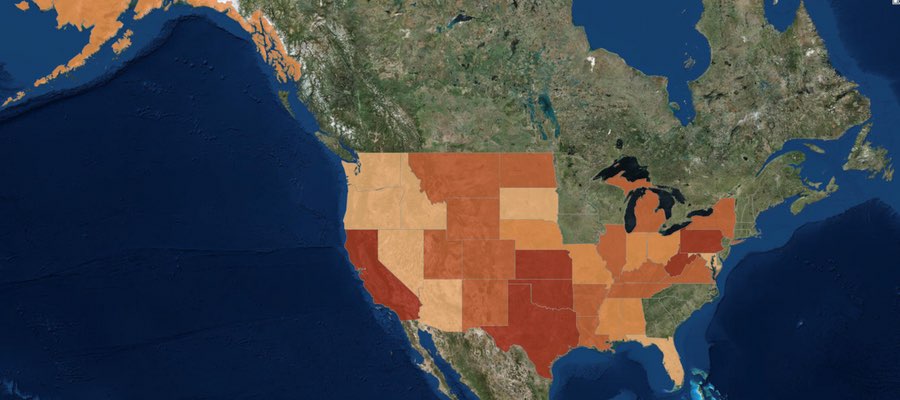
In February 2014, the FracTracker Alliance produced our first version of a national well data file and map, showing over 1.1 million active oil and gas wells in the United States. We have now updated that data, with the total of wells up to 1,666,715 active wells accounted for.
Density by state of active oil and gas wells in the United States. Click here to access the legend, details, and full map controls. Zoom in to see summaries by county, and zoom in further to see individual well data. Texas contains state and county totals only, and North Carolina is not included in this map.
While 1.7 million wells is a substantial increase over last year’s total of 1.1 million, it is mostly attributable to differences in how we counted wells this time around, and should not be interpreted as a huge increase in activity over the past 15 months or so. Last year, we attempted to capture those wells that seemed to be producing oil and gas, or about ready to produce. This year, we took a more inclusive definition. Primarily, the additional half-million wells can be accounted for by including wells listed as dry holes, and the inclusion of more types of injection wells. Basically anything with an API number that was not described as permanently plugged was included this time around.
Data for North Carolina are not included, because they did not respond to three email inquiries about their oil and gas data. However, in last year’s national map aggregation, we were told that there were only two active wells in the state. Similarly, we do not have individual well data for Texas, and we use a published list of well counts by county in its place. Last year, we assumed that because there was a charge for the dataset, we would be unable to republish well data. In discussions with the Railroad Commission, we have learned that the data can in fact be republished. However, technical difficulties with their datasets persist, and data that we have purchased lacked location values, despite metadata suggesting that it would be included. So in short, we still don’t have Texas well data, even though it is technically available.
Wells by Type and Status
Each state is responsible for what their oil and gas data looks like, so a simple analysis of something as ostensibly straightforward as what type of well has been drilled can be surprisingly complicated when looking across state lines. Additionally, some states combine the well type and well status into a single data field, making comparisons even more opaque.
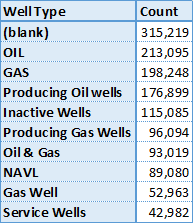
Top 10 of 371 published well types for wells in the United States.
Among all of the oil producing states, there are 371 different published well types. This data is “raw,” meaning that no effort has been made to combine similar entries, so “gas, oil” is counted separately from “GAS OIL,” and “Bad Data” has not been combined with “N/A,” either. Conforming data from different sources is an exercise that gets out of hand rather quickly, and utility over using the original published data is questionable, as well. We share this information, primarily to demonstrate the messy state of the data. Many states combine their well type and well status data into a single column, while others keep them separate. Unfortunately, the most frequent well type was blank, either because states did not publish well types, or they did not publish them for all of their wells.
There are no national standards for publishing oil and gas data – a serious barrier to data transparency and the most important takeaway from this exercise…
Wells by Location
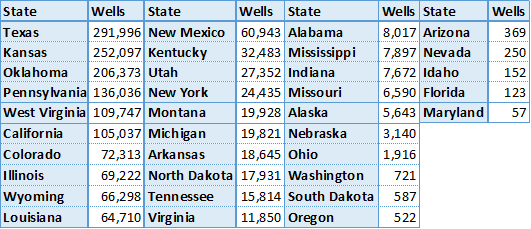
Active oil and gas wells in 2015 by state. Except for Texas, all data were aggregated published well coordinates.
There are oil and gas wells in 35 of the 50 states (70%) in the United States, and 1,673 out of 3,144 (53%) of all county and county equivalent areas. The number of wells per state ranges from 57 in Maryland to 291,996 in Texas. There are 135 counties with a single well, while the highest count is in Kern County, California, host to 77,497 active wells.
With the exception of Texas, where the data are based on published lists of well county by county, the state and county well counts were determined by the location of the well coordinates. Because of this, any errors in the original well’s location data could lead to mistakes in the state and county summary files. Any wells that are offshore are not included, either. Altogether, there are about 6,000 wells (0.4%) are missing from the state and county files.
Wells by Operator
There are a staggering number of oil and gas operators in the United States. In a recent project with the National Resources Defense Council, we looked at violations across the few states that publish such data, and only for the 68 operators that were identified previously as having the largest lease acreage nationwide. Even for this task, we had to follow a spreadsheet of which companies were subsidiaries of others, and sometimes the inclusion of an entity like “Williams” on the list came down to a judgement call as to whether we had the correct company or not.
No such effort was undertaken for this analysis. So in Pennsylvania, wells drilled by the operator Exco Resources PA, Inc. are not included with those drilled by Exco Resources PA, Llc., even though they are presumably the same entity. It just isn’t feasible to systematically go through thousands of operators to determine which operators are owned by whom, so we left the data as is. Results, therefore, should be taken with a brine truck’s worth of salt.
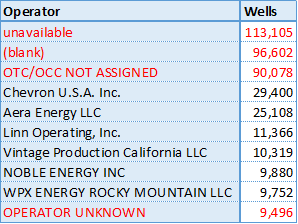
Top 10 wells by operator in the US, excluding Texas. Unknown operators are highlighted in red.
Texas does publish wells by operator, but as with so much of their data, it’s just not worth the effort that it takes to process it. First, they process it into thirteen different files, then publish it in PDF format, requiring special software to convert the data to spreadsheet format. Suffice to say, there are thousands of operators of active oil and gas wells in the Lone Star State.
Not counting Texas, there are 39,693 different operators listed in the United States. However, many of those listed are some version of “we don’t know whose well this is.” Sorting the operators by the number of wells that they are listed as having, we see four of the top ten operators are in fact unknown, including the top three positions.
Summary
The state of oil and gas data in the United States is clearly in shambles. As long as there are no national standards for data transparency, we can expect this trend to continue. The data that we looked for in this file is what we consider to be bare bones: well name, well type, well status, slant (directional, vertical, or horizontal), operator, and location. In none of these categories can we say that we have a satisfactory sense of what is going on nationally.
Click on the above button to download the three sets of data we used to make the dynamic map (once you are zoomed in to a state level). The full dataset was broken into three parts due to the large file sizes.
https://www.fractracker.org/a5ej20sjfwe/wp-content/uploads/2015/08/2015Update-Feature.jpg400900Matt Kelso, BAhttps://www.fractracker.org/a5ej20sjfwe/wp-content/uploads/2025/09/2025-Wordmark-Logo.pngMatt Kelso, BA2015-08-03 14:19:532020-07-21 10:30:051.7 Million Wells in the U.S. – A 2015 Update
Many people ask us how many wells have been hydraulically fractured in the United States. It is an excellent question, but not one that is easily answered; most states don’t release data on well stimulation activities. Also, since the data are released by state regulatory agencies, it is necessary to obtain data from each state that has oil and gas data to even begin the conversation. We’ve finally had a chance to complete that task, and have been able to aggregate the following totals:
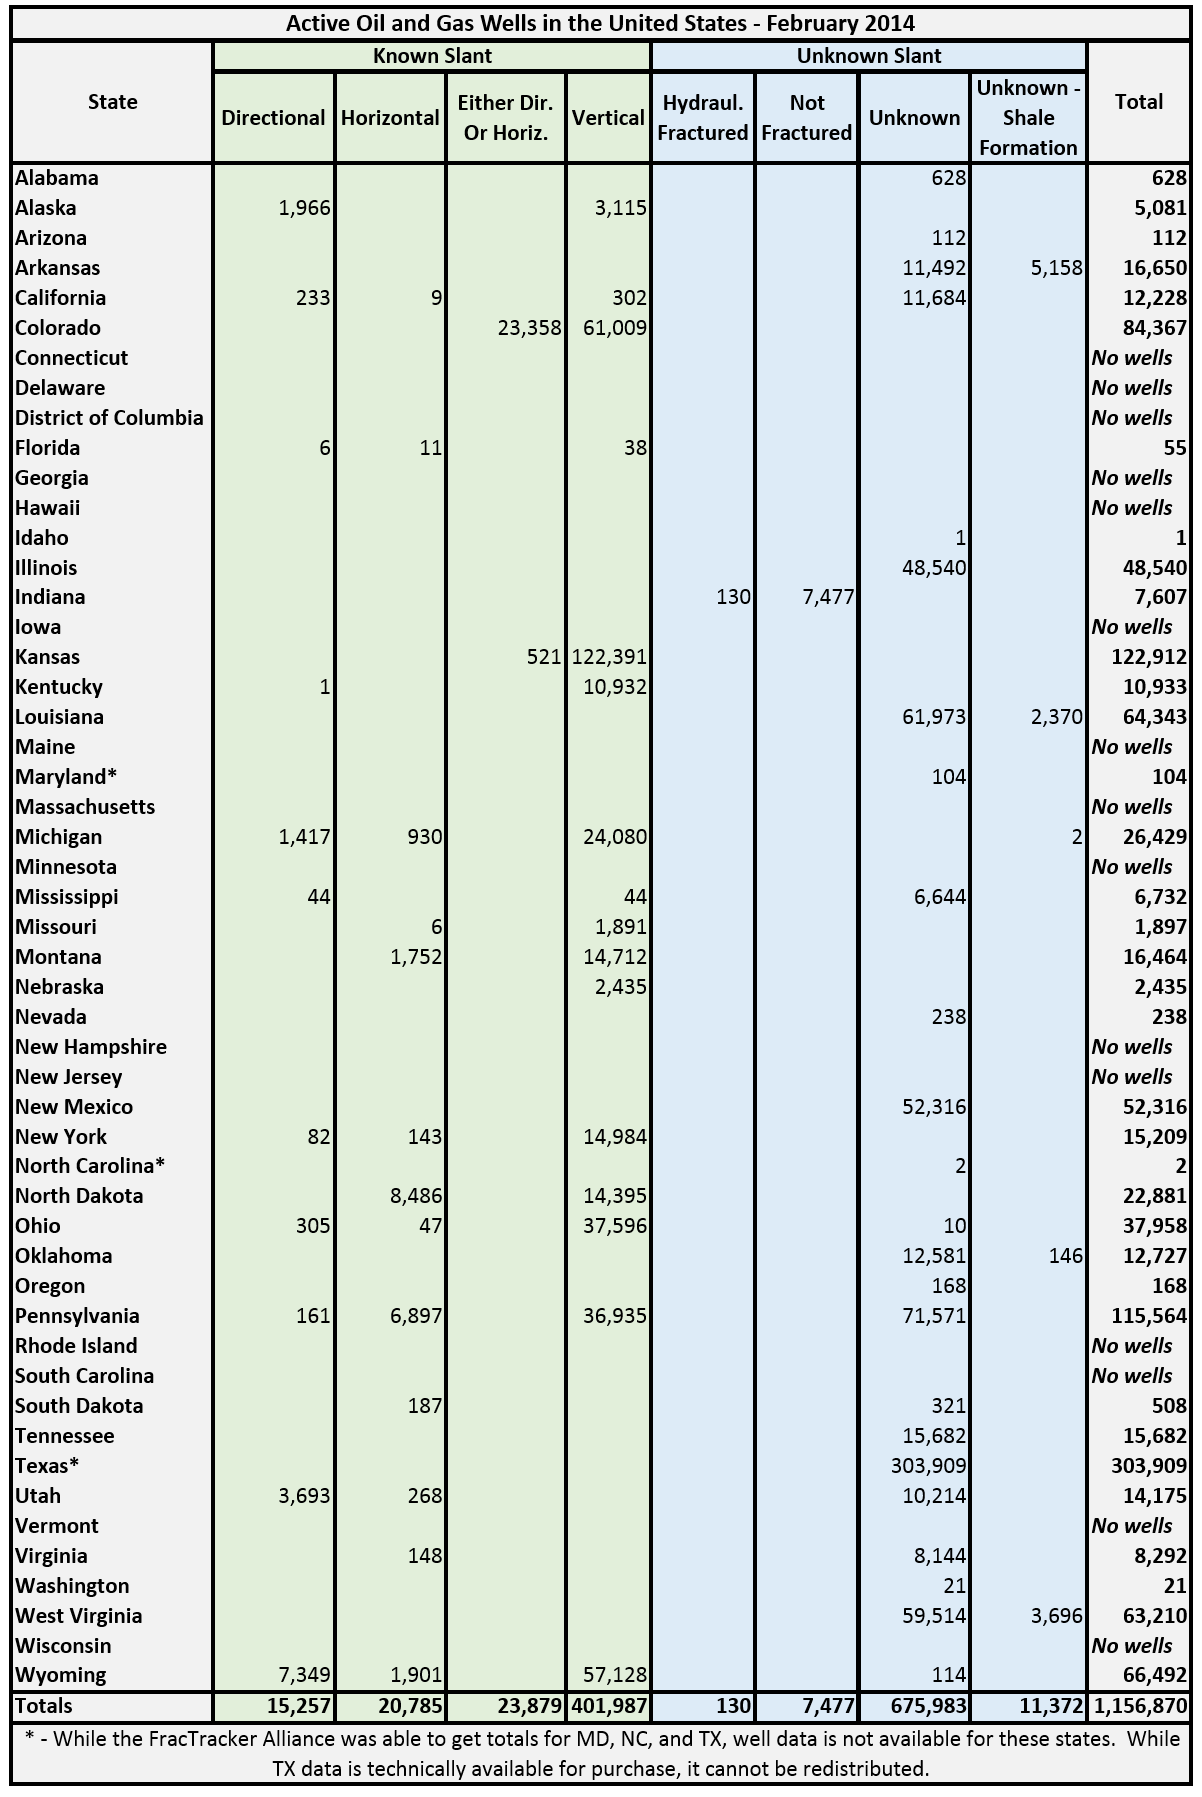
Oil and gas summary data of drilled wells in the United States.
While data on hydraulically fractured wells is rarely made available, the slant of the wells are often made accessible. The well types are as follows:
Directional: Directional wells are those where the top and the bottom of the holes do not line up vertically. In some cases, the deviation is fairly slight. These are also known as deviated or slant wells.
Horizontal: Horizontal wells are directional wells, where the well bore makes something of an “L” shape. States may have their own definition for horizontal wells. In Alaska, these wells are defined as those deviating at least 80° from vertical. Currently, operators are able to drill horizontally for several miles.
Directional or Horizontal: These wells are known to be directional, but whether they are classified as horizontal or not could not be determined from the available data. In many cases, the directionality was determined by the presence of directional sidetrack codes in the well’s API number.
Vertical: Wells in which the top hole and bottom hole locations are in alignment. States may have differing tolerances for what constitutes a vertical well, as opposed to directional.
Hydraulically Fractured: As each state releases data differently, it wasn’t always possible to get consistent data. These wells are known to be hydraulically fractured, but the slant of the well is unknown.
Not Fractured: These wells have not been hydraulically fractured, and the slant of the well is unknown.
Unknown: Nothing is known about the slant, stimulation, or target formation of the well in question.
Unknown (Shale Formation): Nothing is known about the slant or stimulation of the wells in question; however, it is known that the target formation is a major shale play. Therefore, it is probable that the well has been hydraulically fractured, with a strong possibility of being drilled horizontally.
Wells that have been hydraulically fractured might appear in any of the eight categories, with the obvious exception of “Not Fractured.” Categories that are very likely to be fractured include, “Horizontal”, “Hydraulically Fractured”, and “Unknown (Shale Formation),” the total of which is about 32,000 wells. However, that number doesn’t include any wells from Texas or Colorado, where we know thousands wells have been drilled into major shale formations, but the data had to be placed into categories that were more vague.
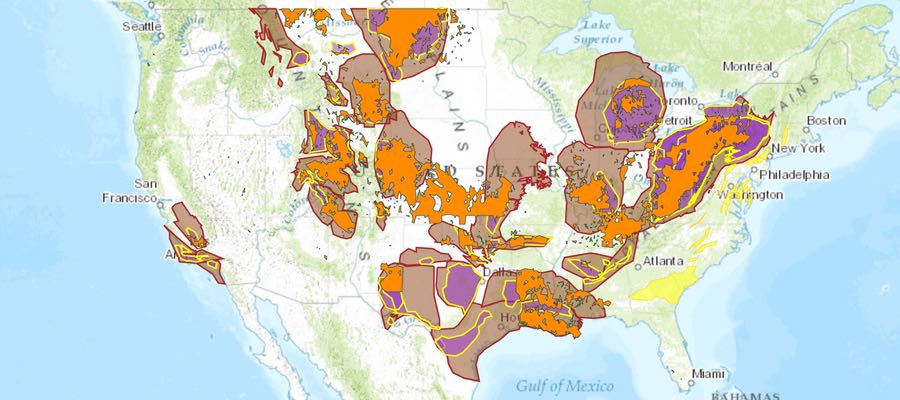
Oil and gas wells in the United States, as of February 2014. Location data were not available for Maryland (n=104), North Carolina (n=2), and Texas (n=303,909). To access the legend and other map tools, click the expanding arrows icon in the top-right corner.
The standard that we attempted to reach for all of the well totals was for wells that have been drilled but have not yet been plugged, which is a broad spectrum of the well’s life-cycle. In some cases, decisions had to be made in terms of which wells to include, due to imperfect metadata.
No location data were available for Maryland, North Carolina, or Texas. The first two have very few wells, and officials in Maryland said that they expect to have the data available within about a month. Texas location data is available for purchase, however such data cannot be redistributed, so it was not included on the map.
It should not be assumed that all of the wells that are shown in the map above the shale plays and shale basin layers are actually drilled into shale. In many cases, however, shale is considered a source rock, where hydrocarbons are developed, before the oil and gas products migrate upward into shallower, more conventional formations.
The raw data oil and gas data is available for download on our site in shapefile format.
https://www.fractracker.org/a5ej20sjfwe/wp-content/uploads/2014/03/US-ShaleViewer-Feature.jpg400900Matt Kelso, BAhttps://www.fractracker.org/a5ej20sjfwe/wp-content/uploads/2025/09/2025-Wordmark-Logo.pngMatt Kelso, BA2014-03-04 12:37:152020-07-21 10:41:55Over 1.1 Million Active Oil and Gas Wells in the US